

Abstract
Previous antemortem and postmortem tissue fatty acid composition studies have observed significant deficits in the omega-3 fatty acid docosahexaenoic acid (DHA, 22:6n-3) in red blood cell (RBC) and postmortem cortical membranes of patients with unipolar depression. In the present we determined the fatty acid composition of postmortem orbitofrontal cortex (OFC, Brodmann area 10) of patients with bipolar disorder (n=18) and age-matched normal controls (n=19) by gas chromatography. After correction for multiple comparisons, DHA (-24%), arachidonic acid (-14%), and stearic acid (C18:0)(-4.5%) compositions were significantly lower, and cis-vaccenic acid (18:1n-7)(+12.5%) composition significantly higher, in the OFC of bipolar patients relative to normal controls. Based on metabolite:precursor ratios, significant elevations in arachidonic acid, stearic acid, and palmitic acid conversion/metabolism were observed in the OFC of bipolar patients, and were inversely correlated with DHA composition. Deficits in OFC DHA and arachidonic acid composition, and elevations in arachidonic acid metabolism, were numerically (but not significantly) greater in drug-free bipolar patients relative to patients treated with mood-stabilizer or antipsychotic medications. OFC DHA and arachidonic acid deficits were greater in patients plus normal controls with high versus low alcohol abuse severity. These results add to a growing body of evidence implicating omega-3 fatty acid deficiency as well as the OFC in the pathoaetiology of bipolar disorder.
Keywords: Bipolar disorder, Postmortem brain, Orbitofrontal cortex (OFC), Docosahexaenoic acid, Arachidonic acid, Prefrontal cortex, Fatty Acid
1. Introduction
The mammalian brain is primarily composed of lipids (60-70% dry weight) that are comprised of a ratio of saturated fatty acids, monounsaturated fatty acids, and polyunsaturated fatty acids (reviewed in McNamara & Carlson, 2006). The principal polyunsaturated fatty acids in the mammalian brain are the omega-6 fatty acid arachidonic acid (AA, 20:4n-6) and the omega-3 fatty acid docosahexaenoic acid (DHA, 22:6n-3). Within brain tissues, DHA and AA preferentially accumulate in synaptosomal, astrocytic, myelin, and mitochondrial fractions (Jones et al., 1996; Suzuki et al., 1997) where they are acetylated into the sn-2 position of membrane phospholipids (Lee & Hajra, 1991). Once mobilized by phospholipase A2 (PLA2)-mediated hydrolyses of this acyl ester bond (Farooqui & Horrocks, 2004), DHA and AA exert opposing effects on the protein kinase C (PKC) signaling transduction pathway and multiple down-steam synaptic events regulated by PKC (reviewed in McNamara et al., 2006). Eicosanoids derived from AA or the precursor of DHA, eicosapentaenoic acid (EPA, 20:5n-3), are pro-inflammatory, whereas docosanoids derived from DHA are anti-inflammatory (reviewed in Farooqui et al., 2007). These data suggest that elevations in the membrane AA:DHA ratio would be detrimental to normal brain function.
There is an emerging body of evidence from cross-national epidemiological surveys (Hibbeln, 1998; Noaghiul & Hibbeln, 2003; Peet, 2004) and clinical intervention trials (reviewed in Freeman et al., 2006) that suggest that omega-3 fatty acid insufficiency may contribute to the pathoaetiology of bipolar disorder and unipolar depression. Additionally, data from epidemiological surveys, prospective, and peripheral tissue fatty acid composition studies suggest that omega-3 fatty acid insufficiency may increase risk for coronary heart disease (Bucher et al., 2002; Daviglus et al., 1997), and suicide (De Vriese et al., 2004; Huan et al., 2004; Sublette et al., 2006; Tanskanen et al., 2001), two principal causes of mortality in patients with bipolar disorder and unipolar depression (Angst et al., 2002). Peripheral tissue fatty acid composition studies have observed significant reductions in red blood cell (RBC) membrane DHA composition in patients with unipolar depression (Edwards et al., 1998; Peet et al., 1998), and we have recently observed selective deficits in DHA composition in the postmortem orbitofrontal cortex (OFC, Brodmann area 10) of patients with unipolar depression (McNamara et al., 2007a). Significant reductions in RBC DHA and arachidonic acid composition have been observed in patients with bipolar disorder (Chiu et al., 2003), but there is currently nothing known about the fatty acid composition of postmortem brain tissue from patients with bipolar disorder.
In the present study, we determined the fatty acid composition of the postmortem OFC (Brodmann area 10) of adult patients with bipolar disorder (n=18) and age-matched healthy controls with no history of psychiatric illness (n=19). The OFC was selected as the region of interest based on prior postmortem histological studies (Cotter et al., 2005; Rajkowska, 2000; Torrey et al., 2005; Uranova et al., 2001) and neuroimaging studies (Altshuler et al., 2005; Blumberg et al., 1999, Kruger et al., 2003; Lopez-Larson et al., 2002) finding abnormalities in the OFC of patients with bipolar disorder. Furthermore, lesion and imaging studies suggest that impairments in OFC function are associated with clinical features that are frequently observed in patient with bipolar disorder, including impulsivity, impairment in reward-based decision making, and substance abuse (Bechara, 2004; Kringelbach, 2005; London et al., 2000). Based on these findings, evidence for omega-3 fatty acid insufficiency in bipolar disorder, and evidence that omega-3 fatty acids play an important role in cellular signaling events in brain, we hypothesized that OFC DHA composition would be significantly lower in bipolar patients relative to age-matched healthy controls. We report significant deficits in DHA (-24%), arachidonic acid (-14%), and stearic acid (-4.5%) composition, and elevations in cis-vaccenic acid composition (+12.5%), in the OFC of bipolar patients relative to normal controls. Based on metabolite:precursor ratios, we also report significant elevations in arachidonic acid and saturated fatty acid metabolism in the OFC of bipolar patients which are inversely correlated with DHA composition.
2. Methods and Materials
2.1. Postmortem brain tissues
Frozen, unfixed, postmortem orbitofrontal cortex (OFC; Brodmann area 10) from normal (no psychiatric illness) male and female controls (n=19) and age-matched male and female patients with DSM-IV defined bipolar disorder (n=18) were used. Comparison of subject and tissue variables is presented in Table 1. Brain tissue was generously provided by the Harvard Brain Tissue Resource Center and the Stanley Research Foundation Neuropathology Consortium. Details regarding brain dissection parameters, axis I DSM-IV diagnoses, and criterion for ethanol and substance abuse severity can be obtained from www.brainbank.mclean.org and www.stanleyresearch.org (see also Torrey et al., 2000). At the time of death, the majority of bipolar patients (n=15) were receiving at least one mood-stabilizer, including lithium (n=6), valproic acid (n=6), and/or carbamazepine (n=2), antipsychotic medications, including typical antipsychotics (thiothixene: n=1, chlorprothixene: n=1, thioridazine, n=1, haloperidol, n=1) and/or atypical antipsychotics (clozapine: n=2, risperidone, n=2, olanazapine, n=2), and/or an antidepressant medications (n=4), and n=3 bipolar patients were medication-free.
Table 1.
Comparison of Subject and Brain Tissue Characteristics
| Normal (n = 19) | Bipolar (n = 18) | P-valuea | |
|---|---|---|---|
| Patient characteristics | |||
| Age at death, mean ± S.D. (range) | 42.3 ± 8.2 (29-55) | 39.6 ± 10.3 (25-55) | 0.381 |
| Gender | 14M, 5F | 12M, 6F | |
| Raceb | 12C, 7 UN | 17C, 1AA | |
| Cause of death | |||
| Suicide | 0 | 11 | |
| Cardiopulmonary | 15 | 2 | |
| Accident | 2 | 1 | |
| Other | 2 | 4 | |
| Age at disease onset (mean years ± S.D.) | - | 21.1 ± 8.6 | |
| Duration of disease (mean years ± S.D.) | - | 17.8 ± 7.47 | |
| History of Psychosis (yes/no) | - | 12/6 | |
| Cigarette smoker (yes/no)c | 2/3 | 6/3 | |
| Alcohol abuse severity (low/high)c | 10/1 | 4/6 | |
| Substance abuse severity (low/high)c | 11/0 | 8/5 | |
| Tissue characteristics | |||
| Brain hemisphere | 13L/6R | 7L/11R | |
| Brain mass (mean grams ± S.D.) | 1462 ± 133 | 1429 ± 170 | 0.521 |
| Postmortem interval (mean hours ± S.D.) | 22.6 ± 8.9 | 29.6 ± 14.0 | 0.079 |
| Storage time (mean days ± S.D.) | 330 ± 192 | 626 ± 183 | 0.010 |
| Tissue pH (mean ± S.D.) | 6.3 ± 0.3 | 6.2 ± 0.3 | 0.126 |
Unpaired t-test (2-tail).
C = Caucasian, AA = African American, UN = Unknown.
Smoking status, alcohol abuse severity, and substance abuse severity could not be ascertained for the remaining subjects.
2.2. Gas chromatography
A pilot study was conducted to compare human OFC brain samples (n=4) analyzed by direct saponification of tissue (Mecalfe et al., 1966) and by Folch extraction (Folch et al., 1957). A known mass (1 mg) of heptadecanoic acid (99%) (Matreya LLC Inc., Pleasant Gap PA) was added to each sample prior to adding the Folch solvent (2:1 vol/vol chloroform/methanol) or the saponification solution (see below). After Folch extraction, the dried lipid was analyzed by saponification and methylation. The mass of fatty acids was calculated in each sample from the relative mass of the heptadecanoic acid standard obtained by gas chromatographic analysis of the methyl esters. It was found that the relative fatty acid composition did not differ between the Folch method and the direct saponification method, and the resulting weight % values from the two methods were highly correlated (r = 0.999, p≤0.0001). The total mass (nmol/g) of fatty acids calculated relative to heptadecanoic acid also did not differ by method, and the resulting values from the two methods were highly correlated (r = 0.999, p≤0.0001). The weight % data and total mass (nmol/g) data were highly correlated using either the Folch method (r = 0.994, p≤0.0001) or the direct saponification method (r = 0.995, p≤0.0001). Because the direct saponification method removes the requirement for large quantities of solvent, and greatly reduces the time for analysis and the time that a sample is exposed to potential oxidation, fatty acid composition was determined with the direct saponification method in the present study. Data are expressed as weight percent of total fatty acids (wt % total fatty acids).
Frozen ∼100 mg cortical samples were dissected from predominantly gray matter regions of the original frozen tissue chunk, and effort was made to avoid inclusion of white matter. Cortical samples were placed in a 20 ml glass vial into which 4 ml of 0.5N methanolic sodium hydroxide was added, and the sample heated at 80°C for 5 min. Following a 10 min cooling period, 3 ml of boron trifluoride in methanol was added to methylate the sample. After an additional five minutes of heating in the water bath (80°C), the sample vial was allowed to cool, and 2 ml of a saturated solution (6.2 M) of sodium chloride and 10 ml of hexane was added. The samples were then mixed by vortex for one minute. The hexane fraction was then transferred into a 20 ml vial containing 10 mg of sodium sulfate to dry the sample. The hexane solution was then removed for GC analysis. An injection volume of 1 μL of the hexane solution was analyzed. Samples were analyzed with a Shimadzu GC-17A GC equipped with auto-injector (Shimadzu Scientific Instruments Inc., Columbia MD). The column was a DB-23 (123-2332): 30m (length), I.D. (mm) 0.32 wide bore, film thickness of 0.25 μM (J&W Scientific, Folsom CA). The GC conditions were: column temperature ramping by holding at 120°C for one minute followed by an increase of 5°C/min from 120-240°C. The temperature of the injector and flame ionization detector was 250°C. A split (8:1) injection mode was used. The carrier gas was helium with a column flow rate of 2.5 ml/min. We set the threshold at an area of 1000, which corresponds to 1 μg/mL of sample. The amount injected on the GC therefore allows us to detect 1 ng injected into the instrument, and we are able to detect 10 μg of an individual fatty acid in a 100 mg sample of tissue.
Analysis of fatty acid methyl esters is based on area under the curve calculated with Shimadzu Class VP 4.3 software. Fatty acid identification was determined using retention times of authenticated fatty acid methyl ester standards (Matreya LLC Inc., Pleasant Gap PA). We restricted our primary statistical analysis to the principal saturated fatty acids (palmitic, C16:0; stearic, C18:0; myristic, C14:0), monounsaturated fatty acids (oleic acid, 18:1n-9; cis-vaccenic acid, 18:1n-7), omega-6 polyunsaturated fatty acids (arachidonic acid, 20:4n-6; adrenic acid [docosatetraenoic acid], 22:4n-6; docosapentaenoic acid, 22:5n-6), and the omega-3 polyunsaturated fatty acid docosahexaenoic acid (DHA, 22:6n-3). Together these nine fatty acids comprise ∼90% of total fatty acids in postmortem brain tissue, and the remaining 10% are fatty acids that individually represent <2% of total fatty acids and were not detectable in all tissue samples. The majority of brain samples (n=15 normals, n=15 bipolar patients) were run in duplicate, and duplicate values were averaged for all subsequent analyses. It was determined that our assays had an overall between-sample Cronbach’s reliability coefficient of α=0.952, indicating good between-sample reliability, and statistical (unpaired t-tests, 2-tail) comparison of duplicate values did not find significant differences for any individual fatty acid (ps>0.05). All samples were processed by a technician that was blind to the group identity of the tissue samples.
2.3. Statistical analysis
Analyses of variance (ANOVA) and covariance (ANCOVA) were performed using SAS (Version 9.1, SAS Institute Cary, NC) PROC MIXED procedure. The null hypothesis that fatty acid composition does not differ by illness state (Normal, bipolar) was tested as the interaction term Illness x Fatty acid in a two-factor ANOVA. Post-hoc tests of simple effects were performed using the Bonferroni correction with a group-wise error rate of α=0.05 to evaluate illness state effects for individual fatty acids (α=0.05/9 = 0.0056). An ANCOVA repeated the steps above, adding Age (continuous), Gender (Male, Female), and second-order interaction terms of all variables, after which stepwise regression using p=0.10 as a cutoff determined which terms remained in the final model. Post-hoc tests of simple effects using the Bonferroni correction were also performed on the final ANCOVA model, with a group-wise error rate of α=0.05 to evaluate illness state effects for individual fatty acids (α=0.05/9 = 0.0056). In our analyses, model residuals were normally distributed with moderate kurtosis and negligible skew. Pearson product moment correlation analyses were performed using GB-STAT (Dynamic Microsystems, Inc., Silver Springs MD) to determine the interrelationship between fatty acid composition and subject characteristics (age at onset of illness, duration of illness, age at time of death), and postmortem tissue variables (brain pH, brain weight, postmortem interval, and days in freezer storage). All tests were 2-tailed and performed at α=0.05. Exploratory analyses of continuous variables were conducted using unpaired t-tests (2-tailed) and exact p-values reported.
3. Results
3.1. Fatty acid composition
In the OFC of normal controls, the composition of the major saturated fatty acids, monounsaturated fatty acids, and polyunsaturated fatty acids were consistent with those previously reported for postmortem frontal cortex from a larger cohort (N=38) of normal adult male and female subjects (Carver et al., 2001). We found the DHA precursors, α-linolenic acid (ALA, 18:3n-3) and EPA (20:5n-3), were below the limit of detection (<0.2 wt %) in the majority of our postmortem brain samples, consistent with prior postmortem brain studies (Carver et al., 2001; Landen et al., 2002; Yao et al., 2000). Because EPA and ALA are detectable at higher concentrations in peripheral tissues, this finding suggests that brain DHA is synthesized from ALA and EPA predominantly in the periphery. The two-factor ANOVA found a significant Illness x Fatty Acid Interaction, F(8,315)=7.67, p≤0.0001, and significant main effects of Illness, F(1,315)=5.46, p=0.020, and Fatty Acid, F(8,315)=3233, p≤0.0001. The ANCOVA did not find a significant Age at death x Fatty acid interaction, F(8,297)=1.79, p=0.079, or Gender x Fatty acid interaction, F(8,297)=0.71, p=0.680. Total saturate (ΣMA+PA+SA) (-7%, p=0.006) and total polyunsaturate (ΣAA+adrenic acid+DPA+DHA) (-15%, p=0.002) compositions were lower, and total monounsaturate (ΣOA+VA) composition higher (+14%, p=0.008), in bipolar patients relative to normal controls (Fig 1A). The Σsaturate:Σpolyunsaturate (+10%, p=0.003) and Σmonunsaturate:Σpolyunsaturate (+33%, p=0.008) ratios were higher, and the Σsaturate:Σmonounsaturate (-17%, p=0.0006) ratio lower, in bipolar patients relative to normal controls. After correction for multiple comparisons, DHA (-24%, p=0.0031), arachidonic acid (-14%, p=0.0020), and stearic acid (-4.5%, p=0.0027) compositions were significantly lower, and cis-vaccenic acid composition significantly higher (+12.5%, p=0.0011), in the OFC of bipolar patients relative to normal controls (Fig. 1B). Negative trends were observed for palmitic acid (-10%, p=0.0092) and docosapentaenoic acid (22:5n-6)(-20%, p=0.0422), and positive trends were observed for oleic acid (18:1n-9)(+15%, p=0.010) and adrenic acid (22:4n-6)(+6%, p=0.04).
Figure 1.
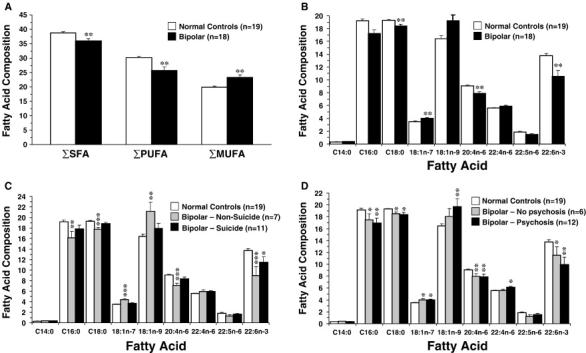
(A) Comparison of total saturated fatty acid compostion (ΣSFA), total polyunsaturated fatty acid composition (ΣPUFA), and total monounsaturated fatty acid composition (ΣMUFA) in the OFC of normal controls and patients with bipolar disorder. (B) Comparison of principal fatty acid composition in the OFC of bipolar patients and age-matched normal controls. After correction for multiple comparisons, stearic acid (C18:0), arachidonic acid (20:4n-6), and DHA (22:6n-3) composition are significantly lower, and cis-vaccenic acid (18:1n-7) composition significantly higher, in the OFC of bipolar patients relative to normal controls (**P≤0.0056 vs. normal controls). (C) OFC fatty acid composition in normal controls (n=19), bipolar patients that committed suicide (n=11), and bipolar patients that did not die from suicide (n=7). Note that DHA (22:6n-3) is the only fatty acid that is lower in the OFC of BP patients relative to normal controls (-16%, p=0.03 vs. normal controls). (D) OFC fatty acid composition in normal controls (n=19), bipolar patients with (n=12) and without (n=6) a history of psychosis. Note that alterations in fatty acid composition are greater in bipolar patients with a history of psychosis than BP patients without a history of psychosis. In (A), (C) and (D), *P≤0.05, **P≤0.01, ***P≤0.001 vs. normal controls. Data are expressed as mean fatty acid composition (μg fatty acid/100 μg fatty acids) ± S.E.M.
3.2. Suicide
In bipolar patients that committed suicide (n=11), the only fatty acid that exhibited a significant alteration relative to normal controls was DHA, which exhibited a modest reduction (-16%, p=0.03)(Fig. 1C). In bipolar patients that died of other causes (n=7), larger OFC DHA deficits were observed (-35%, p=0.0006) and alterations in several additional fatty acids were observed, including palmitic acid (-16%, p=0.0026), stearic acid (-8%, p=0.0001), cis-vaccenic acid (+21%, p≤0.0001), oleic acid (+22%, p=0.001), and arachidonic acid (-22%, p=0.0001)(Fig. 1C).
3.3. History of psychosis
Although there were no differences between bipolar patients with a history of psychosis (n=12) relative to bipolar patients without a history of psychosis (n=6) for any fatty acid or fatty acid ratio (ps>0.05), bipolar patients with a history of psychosis exhibited numerically greater OFC DHA deficits relative to normal controls than did bipolar patients without a history of psychosis (-28%, p=0.002 vs. -16%, p=0.04)(Fig. 1D). Moreover, relative to normal controls bipolar patients with a history of psychosis exhibited numerically greater reductions in palmitic acid and numerically greater elevations in oleic acid and adrenic acid than bipolar patients without a history of psychosis (Fig. 1D). Bipolar patients with a history of psychosis also exhibited a numerically larger adrenic acid:arachidonic acid ratio relative to bipolar patients without a history of psychosis (+25%, p=0.006 vs. +13%, p=0.057).
3.4. Omega-6 fatty acid metabolism
Omega-6 fatty acid metabolite:precursor ratios are presented in Table 2. We found that the omega-6 fatty acid linoleic acid (18:2n-6) exhibited a negative trend (-23%, p=0.051), and that homo-γ-linolenic acid (20:3n-6)(+7%, p=0.30) composition was not different, in bipolar patients relative to normal controls. Relative to normal controls, bipolar patients exhibited a significant elevation in the adrenic acid:arachidonic acid ratio (+21%, p=0.008), and a negative trend was found for the docosapentaenoic acid:adrenic acid ratio (-24%, p=0.055). The homo-γ-linolenic acid:linoleic acid ratio (+18%, p=0.084) and the arachidonic acid:homo-γ-linolenic acid ratio (-8%, p=0.254) did not differ significantly between normal controls and bipolar patients (Table 2). After combining normal controls and bipolar patients (N=37), OFC DHA composition was positively correlated with arachidonic acid composition (r = +0.91, p≤0.0001) and inversely correlated with adrenic acid composition (r = -0.78, p≤0.0001), and DHA was inversely correlated with the adrenic acid:arachidonic acid ratio (r = -0.93, p≤0.0001)(Fig. 2A). Docosapentaenic acid (22:5n-6) composition (r = +0.57, p=0.0003) and the docosapentaenic acid:adrenic acid ratio (r = +0.63, p≤0.0001) (Fig. 2B) were both positively correlated with DHA composition.
Table 2.
Fatty Acid Metabolite:Precursor Ratios
| Fatty acid ratioa | Enzyme | Normal (n = 19) | Bipolar (n = 18) | Δ (%) | P-valueb |
|---|---|---|---|---|---|
| Saturated fatty acids | |||||
| Oleic acid:Stearic acid | Δ9-desaturase | 0.86 ± 0.3 | 1.06 ± .07 | + 19 | 0.009 |
| Palmitoleic acid:Palmitic acid | Δ9-desaturase | 0.02 ± .00 | 0.03 ± .00 | + 12 | 0.002 |
| Monosaturated fatty acid | |||||
| cis-Vaccenic acid:Palmitoleic acid | Elongase | 6.48 ± .22 | 6.63 ± .21 | + 2 | 0.625 |
| Omega-6 fatty acids | |||||
| Homo-γ-Linolenic acid:Linoleic acid | Δ6-desaturase | 1.36 ± .09 | 1.65 ± .35 | + 18 | 0.084 |
| Arachidonic acid:Homo-γ-Linolenic acid | Δ5-desaturase | 8.92 ± .05 | 8.20 ± .41 | - 8 | 0.254 |
| Adrenic acid:Arachidonic acid | Elongase | 0.62 ± .02 | 0.79 ± .05 | + 21 | 0.0008 |
| Docosapentaenoic acid:Adrenic acid | Peroxisomalc | 0.33 ± .02 | 0.25 ± .03 | - 24 | 0.055 |
Data expressed as mean ± S.E.M.
Unpaired t-test (two-tailed).
Acyl CoA desaturation + β-oxidation.
Figure 2.
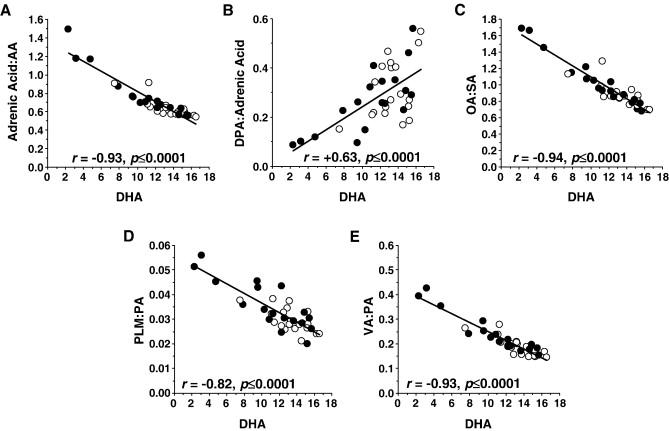
Correlations between OFC DHA (22:6n-3) composition (wt % total fatty acids) and the adrenic acid:arachidonic acid ratio (A), the DPA:adrenic acid ratio (B), the oleic acid (OA, 18:1n-9):stearic acid (SA) ratio (C), the palmitioleic acid (PLM, 16:1n-7):palmitic acid (PA) ratio (D), and the cis-vaccenic acid (VA):palmitic acid (PA) ratio (E) among normal controls (open circles) and bipolar patients (closed circles)(N=37). Associated Pearson correlation coefficients and p-values (2-tail) are presented.
3.5. Saturated fatty acid metabolism
Saturated fatty acid metabolite:precursor ratios are presented in Table 2. Relative to normal controls, bipolar patients exhibited a larger oleic acid:stearic acid ratio (+19%, p=0.009). Moreover, oleic acid composition was inversely correlated with DHA composition (r = -0.93, p≤0.0001), stearic acid composition positively correlated with DHA composition (r = +0.88, p≤0.0001), and the oleic acid:stearic acid ratio inversely correlated with DHA composition (r = -0.94, p≤0.0001)(Fig. 2A). Relative to normal controls, bipolar patients exhibited greater palmitioleic acid composition (+10%, p=0.04) and a larger palmitioleic acid:palmitic acid ratio (+21%, p=0.002)(Table 2). Moreover, palmitioleic acid composition was inversely correlated with DHA composition, though this not reach statistical significance (r = -0.29, p=0.08). Palmitic acid composition was positively correlated with DHA composition (r = +0.96, p≤0.0001), and the palmitioleic acid:palmitic acid ratio was inversely correlated with DHA composition (r = -0.82, p≤0.0001)(Fig. 2D). Similarly, relative to normal controls, bipolar patients exhibited a larger cis-vaccenic acid:palmitic acid ratio (+24%, p=0.005), and cis-vaccenic acid composition (r = -0.80, p≤0.0001) and the cis-vaccenic acid:palmitic acid ratio (r = -0.93, p≤0.0001)(Fig. 2E) were both inversely correlated with DHA composition. The cis-vaccenic acid:palmitoleic acid ratio did not differ significantly between bipolar patients and normal controls (+2%, p=0.625).
3.6. Medication effects
The OFC DHA deficit observed in drug-free bipolar patients (-44% vs. normal controls, p=0.0002) was numerically (but not significantly) greater than the deficit observed in bipolar patients treated with lithium (-22% vs. normal controls, p=0.02), valproic acid (-18% vs. normal controls, p=0.04), or antipsychotic medications (-25% vs. normal controls, p=0.006) (Fig. 3A). Similarly, the OFC arachidonic acid deficit in drug-free bipolar patients (-22% vs. normal controls, p=0.04) was numerically (but not significantly) greater than the arachidonic acid deficit observed in bipolar patients treated with lithium (-11% vs. normal controls, p=0.04), valproic acid (-11% vs. normal controls, p=0.05), or antipsychotic medications (-12% vs. normal controls, p=0.01)(Fig. 3B). Although OFC adrenic acid composition did not differ between drug-free and medicated patients (Fig. 3C), the OFC adrenic acid:arachidonic acid ratio observed in drug-free bipolar patients (+31% vs. normal controls, p=0.006) was numerically (but not significantly) greater than the ratio observed in bipolar patients treated with lithium (+24% vs. normal controls, p=0.02), valproic acid (+16% vs. normal controls, p=0.06), or antipsychotic medications (+23% vs. normal controls, p=0.01)(Fig. 3D). The OFC docosapentaenoic acid (DPA, 22:5n-6) deficit observed in drug-free bipolar patients (-44% vs. normal controls, p=0.047) was numerically (but not significantly) greater than the DPA deficits observed in bipolar patients treated with lithium (-7% vs. normal controls, p=0.71), valproic acid (-17% vs. normal controls, p=0.36), or antipsychotic medications (13% vs. normal controls, p=0.38)(Fig. 3E). Moreover, the decrease in the DPA:adrenic acid ratio observed in drug-free bipolar patients (-48% vs. normal controls, p=0.037) was numerically (but not significantly) greater than the DPA:adrenic acid ratio observed in bipolar patients treated with lithium (-10% vs. normal controls, p=0.54), valproic acid (-18% vs. normal controls, p=0.33), or antipsychotic medications (-18% vs. normal controls, p=0.24)(Fig. 3F).
Figure 3.
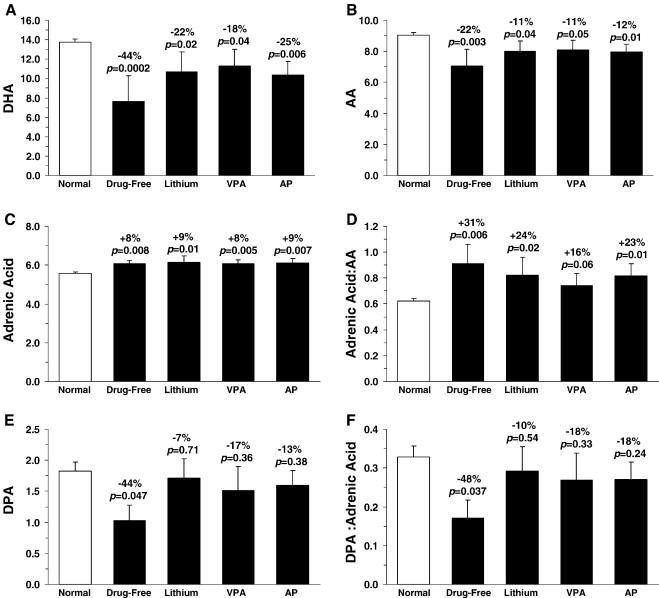
Comparison of OFC DHA composition (A), arachidonic acid composition (B), the adrenic acid composition (C), the adrenic acid:arachidonic acid ratio (D), docosapentaenoic acid (DPA, 22:5n-6) composition (E), the DPA:adrenic acid ratio in normal controls (n=19), drug-free bipolar patients (DF, n=3), and bipolar patients treated with lithium (Li, n=6), valproic acid (VPA, n=6), or antipsychotics (AP, n=10) at time of death. Note that the deficits in DHA, arachidonic acid, DPA, and the DPA:adrenic acid ratio, and elevations in adrenic acid:arachidonic acid ratio, are numerically (but not significantly) greater in drug-free bipolar patients relative to bipolar patients treated with lithium, valproic acid, or antipsychotic medications. Data are expressed as mean ± S.E.M. wt % of total fatty acids. Effect size is expressed as mean percent difference from normal controls and associated p-values (unpaired t-test, two-tail).
3.7. Alcohol and substance abuse
There were no differences between OFC DHA (p=0.069) or arachidonic acid (p=0.149) composition in bipolar patients with low alcohol abuse severity (n=4) versus bipolar patients with high alcohol abuse severity (n=6). However, OFC DHA (p=0.001) and arachidonic acid (p=0.02) composition in combined normals+bipolar with high alcohol abuse severity (n=7) were significantly lower (DHA: -42%, arachidonic acid: -17%) than combined normals+bipolar patients with low alcohol abuse severity (n=14)(Fig. 4A). There were no differences between OFC DHA (p=0.919) or arachidonic acid (p=0.629) composition in bipolar patients with low substance (drug) abuse severity (n=5) versus bipolar patients with high substance abuse severity (n=8), and there were no differences in DHA (p=0.268) or arachidonic acid (p=0.574) composition between combined normals+bipolar patients with low substance abuse severity (n=16) versus bipolar patients with high substance abuse severity (n=8)(Fig. 4B). Although underpowered, there were no differences between bipolar patients that smoked cigarettes (n=6) relative to patients that did not smoke (n=3) in OFC DHA (p=0.789) or arachidonic acid (p=0.985) concentrations. There were no differences in DHA (p=0.576) or arachidonic acid (p=0.849) concentrations between normals+BP patients that smoked cigarettes (n=8) versus those that did not smoke cigarettes (n=6).
Figure 4.
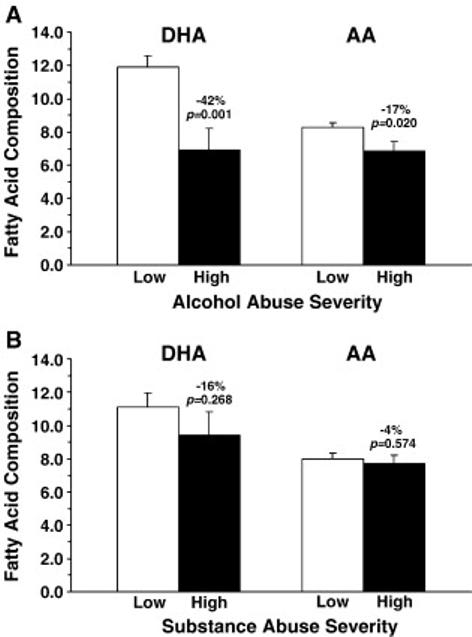
(A) Comparison of OFC docosahexaenoic acid (DHA) and arachidonic acid (AA) composition (wt % total fatty acids) in combined normals+bipolar patients with low alcohol abuse severity (n=14) and normals+bipolar with high alcohol abuse severity (n=7). Note that OFC DHA and arachidonic acid composition are significantly lower in normals+bipolar with high versus low alcohol abuse severity. (B) Comparison of OFC docosahexaenoic acid (DHA) and arachidonic acid (AA) composition in combined normals+bipolar patients with low substance abuse severity (n=14) and normals+bipolar with high substance abuse severity (n=7). Effect size is expressed as mean percent difference from normal controls and associated p-values (unpaired t-test, two-tail).
3.8. Patient and postmortem tissue variables
Within the bipolar patient group (n=18), there were no significant correlations between DHA composition and age at death (r = +0.09, p=0.70), age at onset of illness (r = -0.21, p=0.49), duration of illness (r = +0.38, p=0.20), fluphenazine mg equivalents (r = -0.11, p=0.73), brain pH (r = +0.33, p=0.19), brain weight (r = +0.09, p=0.73), postmortem interval (r = -0.11, p=0.66), or freezer storage duration (r = -0.23, p=0.45), and there were no significant correlations between other individual fatty acid compositions and these variables (all p>0.05). Within the normal control group (n=19), there were no significant correlations between OFC DHA composition and age at death (r = +0.02, p=0.92), brain pH (r = +0.24, p=0.32), brain weight (r = -0.25, p=0.30), postmortem interval (r = -0.04, p=0.87), or freezer storage duration (r = -0.14, p=0.72), and there were no significant correlations between other fatty acid compositions and these variables (all p>0.05), with the exception of OFC docosapetaenoic acid (22:5n-6) composition which was inversely correlated with age at death (r = -0.58, p=0.008). After combining normal and bipolar groups (N=37), there were no significant correlations between OFC DHA composition and age at death (r = +0.14, p=0.42), brain pH (r = +0.34, p=0.057), brain weight (r = +0.06, p=0.74), postmortem interval (r = -0.24, p=0.17), or freezer storage duration (r = -0.32, p=0.06), and there were no significant correlations between other individual fatty acid compositions and these variables (all p>0.05). The absence of correlations between freezer storage duration and DHA composition is notable in view of the greater freezer storage duration for the bipolar group relative to normal group (Table 1). Moreover, we additionally found that OFC DHA composition did not differ significantly between bipolar patients with a freezer storage duration of ≤600 d (n=7) vs. ≥600 d (n=11)(p=0.379). Furthermore, because the postmortem interval was numerically (but not significantly) greater in the bipolar group than the normal group (Table 1), we analyzed DHA composition in bipolar patients with a postmortem interval of ≤30 h (n=8) vs. ≥30 h (n=10). It was found that OFC DHA composition did not differ significantly between bipolar patients with a postmortem interval of ≤30 h versus ≥30 h (p=0.857), and the magnitude of the OFC DHA deficit relative to normal controls was similar in bipolar patients with a postmortem interval of ≤30 h (-26%, p=0.0007 vs. normal controls) or ≥30 h (-23%, p=0.0045 vs. normal controls).
4. Discussion
Evidence from peripheral tissue fatty acid composition studies suggests that patients with bipolar disorder exhibit omega-3 fatty acid insufficiency relative to normal controls (Chiu et al., 2003; Ranjekar et al., 2003). To determine whether omega-3 fatty acid insufficiency extends to brain tissue, we determined the fatty acid composition of postmortem OFC tissue from bipolar patients and age-matched normal controls. We found that OFC DHA composition was significantly lower in the OFC of bipolar patients relative to age-matched normal controls (-24%), and neither gender nor age at death were significant covariates with DHA composition. OFC DHA deficits were not significantly correlated with duration of illness or postmortem tissue variables including postmortem interval or freezer storage duration, and could not be wholly attributed to cigarette smoking status or substance abuse severity. However, alcohol abuse severity may contribute to DHA deficits in both normal controls and bipolar patients. DHA deficits were numerically (but not significantly) greater in patients with (-28%) versus without (-16%) a history of psychosis, and selective DHA deficits were observed in bipolar patients that committed suicide. OFC DHA deficits were numerically (but not significantly) greater in unmedicated versus medicated bipolar patients. Significant deficits in OFC arachidonic acid and stearic acid composition were also observed, and DHA composition was inversely correlated with elevations in arachidonic acid and stearic acid conversion/metabolism.
The present postmortem study has several important limitations. First, no information was available regarding the diets of bipolar patients or normal controls in the months preceding their death, and it is therefore not possible to investigate whether the observed OFC fatty acid abnormalities are associated with dietary versus genetic factors. Second, manic or depressive symptom severity at the time of death could not be ascertained in order to evaluate whether OFC fatty acid abnormalities correlated with illness phase or symptom severity. Third, because bipolar disorder is a heterogeneous disorder, the small number of patients in the drug-free group (n=3) may not be representative of all drug-free bipolar patients, and larger sample sizes will be required to confirm the present findings. Fourth, the DHA composition found in the OFC of normal controls may not be representative of a healthy human sample because the majority (79%) died of cardiovascular-related disease which is associated with omega-3 fatty acid insufficiency (Bucher et al., 2002; Daviglus et al., 1997). Fifth, the small number of patients for whom cigarette smoking status and other lifestyle factors could be ascertained prevents definitive assessment of the contribution of these factors to the present findings. Sixth, the present study examined one brain region which may not be representative of other brain regions in terms of fatty acid composition.
The DHA deficit observed in the postmortem OFC of bipolar patients relative to normal controls (-24%) is similar in magnitude to that previously found in the postmortem OFC of patients with non-psychotic unipolar depression (-22%)(McNamara et al., 2007a). However, two findings suggest a distinction between OFC fatty acid composition in patients with bipolar disorder versus unipolar depression. First, female patients with unipolar depression exhibited a greater OFC DHA deficit (-32%) than did male patients (-16%) (McNamara et al., 2007a), whereas female (-26%) and male (-22%) bipolar patients exhibited similar DHA deficits. Second, after correction for multiple comparisons, patients with unipolar depression exhibited selective deficits in DHA composition (McNamara et al., 2007a), whereas bipolar patients additionally exhibited significant deficits in arachidonic acid and stearic acid composition, and significantly greater cis-vaccenic acid composition, relative to normal controls. Interestingly, like patients with unipolar depression, bipolar patients that committed suicide also exhibited selective deficits in OFC DHA composition, a finding that is consistent with previous studies suggesting that omega-3 fatty acid insufficiency may increase risk for suicide (De Vriese et al., 2004; Huan et al., 2004; Sublette et al., 2006; Tanskanen et al., 2001). Furthermore, we and others have found that postmortem brain tissue from patients with schizophrenia also exhibit deficits in arachidonic acid and/or DHA composition (Horrobin et al., 1991; McNamara et al., 2007b; Yao et al., 2000), and in the present study we also observed significant deficits in arachidonic acid and DHA composition in the OFC of bipolar patients with and without a history of psychosis. Therefore, the pattern of fatty acid abnormalities observed in bipolar patients appears to overlap with both depressed (DHA deficits) and schizophrenic patients (DHA+AA deficits).
Although there were no differences between OFC DHA composition in bipolar patients with low versus high alcohol abuse severity, DHA composition was significantly lower in the OFC of combined normals+bipolar patients with high alcohol abuse severity relative to normals+bipolar patients with low alcohol abuse severity (-42%). This finding is consistent with a previous primate study which found that chronic alcohol intake was associated with a 20-30% reduction in cortical DHA composition (Pawlosky et al., 2001). We additionally found that arachidonic acid composition was significantly lower in the OFC of combined normals+bipolar patients with high alcohol abuse severity (-17%), which was not observed in primate brain after chronic alcohol intake (Pawlosky et al., 2001). Taken collectively, these data suggest that alcohol abuse may contribute in part to the cortical DHA deficits observed in bipolar patients as well as normal controls, and cortical DHA deficits may contribute in part to the negative impact of alcohol abuse on illness course and symptom severity in patients with bipolar disorder (Frye & Salloum, 2006).
We found that OFC arachidonic acid composition was significantly lower in bipolar patients relative to normal controls (-14%, p=0.002). This finding is congruent with a previous finding of lower arachidonic acid composition (-53%) in the RBC membranes of bipolar patients relative to normal controls (Chiu et al., 2003). Additionally, we found that the fatty acid metabolite of arachidonic acid, adrenic acid (22:4n-6), exhibited a positive trend in the OFC of bipolar patients relative to normal controls (+6%, p=0.04), and bipolar patients exhibited a significantly larger adrenic acid:arachidonic acid ratio (+21%, p=0.008). These data are consistent with increased conversion/elongation of arachidonic acid to adrenic acid (Leonard et al., 2004), and could reflect the shunting of adrenic acid from peroxisomal metabolism. Because adrenic acid can be metabolized to dihomoprostaglandins and competes with arachidonic acid for conversion by cyclooxygenase (Campbell et al., 1985), elevations in the conversion of arachidonic acid to adrenic acid may have implications for cyclooxygenase-mediated inflammatory pathways in brain. These findings take on additional significance in view of preclinical data finding that chronic treatment with lithium or valproic acid both decrease cyclooxygenase activity in rat brain (Bosetti et al., 2002, 2003). Abnormalities in omega-6 fatty acid metabolism appear to be restricted to the conversion/elongation of arachidonic acid to adrenic acid, because neither the precursors of arachidonic acid (linoleic acid, homo-γ-linolenic acid) nor the homo-γ-linolenic acid:linoleic acid ratio or the arachidonic acid:homo-γ-linolenic ratio differed significantly between bipolar patients and normal controls. The latter findings suggest that Δ6- and Δ5-desaturase activities do not different significantly between bipolar patients and normal controls.
In the present study, docosapentaenoic acid (DPA, 22:5n-6) composition was reduced in the OFC of bipolar patients (-20%, p=0.042) and was positively correlated with DHA composition. This finding is in stark contrast to rodent and primate studies finding that dietary-induced reductions in cortical DHA composition are associated with reciprocal elevations in DPA (Anderson et al., 2005; Contreras et al., 2001). Moreover, we found that the DPA:adrenic acid ratio was reduced (-24%, p=0.055), rather than elevated, in the bipolar OFC relative to controls, and that this ratio was also positively correlated with DHA composition. Reductions in the conversion of adrenic acid to DPA might reflect the shunting of adrenic acid away from peroxisomal metabolism. However, deficits in the conversion of adrenic acid to DPA in combination with reductions in DHA composition are also consistent with deficits in peroxisome-mediated metabolism (Sprecher & Chen, 1999). This is indirectly supported by the finding that postmortem brain tissue from patients with the peroxisomal biogenesis disorder, Zellweger’s syndrome, also exhibits deficits in both DHA and DPA composition and a reduction in the DPA:adrenic acid ratio (Martinez, 1992). These findings suggest that deficits in peroxisomal metabolism may contribute in part to the abnormalities in brain fatty acid composition/metabolism observed in patients with bipolar disorder. If true, this would have important implications for the correction of brain DHA deficits in patients with bipolar disorder. For example, bypassing peroxisomal metabolism with preformed DHA has proven efficacious for correcting DHA deficits in tissues of patients with generalized peroxisomal disorders (Martinez et al., 2001), and preformed eicosapentaenoic acid (EPA, 20:5n-3), which requires peroxisomal conversion to DHA, appears to be less efficacious than EPA+DHA in the treatment of mood symptoms in bipolar disorder patients (cf. Keck et al., 2006 vs. Stoll et al., 1999).
Several findings from the present study suggest that the abnormalities in omega-6 fatty acid composition and metabolism in the OFC of bipolar patients are related to DHA deficits. Specifically, arachidonic acid composition was positively correlated with DHA composition, whereas adrenic acid composition and the adrenic acid:arachidonic acid ratio were both negatively correlated with DHA composition. Furthermore, DHA and arachidonic acid deficits as well as elevations in the adrenic acid:arachidonic acid ratio were reduced in bipolar patients treated with mood-stabilizer or antipsychotic medications at time of death, and preclinical studies have demonstrated that chronic treatment with lithium (Chang & Jones, 1998), valproic acid (Chang et al., 2001), and antipsychotic medications (Myers et al., 2001) decrease cPLA2-mediated arachidonic acid turnover in rat brain. A role for DHA in the inhibitory regulation of arachidonic acid turnover/metabolism is additionally supported by previous in vitro studies (Galli et al., 1992; Petroni et al., 1994) and by a rat study finding that dietary-induced DHA deficits in rat frontal cortex (-31%) significantly increased calcium-dependent cPLA2 expression and activity (Rao et al., 2007). However, a second study found that larger dietary-induced DHA deficits (-88%) over perinatal development did not alter indices of arachidonic acid turnover in rat brain (Contreras et al., 2001). Taken collectively, these data suggest that moderate reductions (20-30%) in cortical DHA composition may contribute to mood-stabilizer- and antipsychotic-reversible elevations in cPLA2-mediated arachidonic acid turnover and metabolism.
In the present study, we also observed significant elevations in the oleic acid:stearic acid and palmitioleic acid:palmitic acid ratios in the OFC of bipolar patients. Because stearic acid and palmitic acid are converted to oleic acid and palmitioleic acid, respectively, by Δ9-desaturase (stearoyl-CoA desaturase), these findings are consistent with elevated Δ9-desaturase activity in the OFC of bipolar patients. Moreover, both the oleic acid:stearic acid and palmitioleic acid:palmitic acid ratios were inversely correlated with DHA composition, consistent with the repression of Δ9-desaturase mRNA expression by omega-3 polyunsaturated fatty acids (Ntambi, 1999). Although the consequences of elevated Δ9-desaturase activity are not clear, a principal product of Δ9-desaturase activity, oleic acid, is enriched in human brain white matter and rat brain myelin (Bourre et al., 1997; Wilson & Bell, 1993), and Δ9-desaturase expression is positively correlated with peripheral axonal myelination (Garbay et al., 1998). Moreover, in vitro evidence suggests that oleic acid increases neuronal apoptosis in a concentration dependent manner (Zhu et al., 2005) and stimulates protein kinase C (PKC) activity (reviewed in McNamara et al., 2006). It is of interest, therefore, that abnormalities in oligodendrocytes and myelinated fibers (Uranova et al., 2001), neuronal apoptosis (Buttner et al., 2007), and elevated indices of PKC activity (Wang & Friedman, 1996) have all been observed in postmortem brain tissue of bipolar patients.
In summary, we report significant abnormalities in the fatty acid composition of postmortem brain tissue from patients with bipolar disorder. Consistent with a previous RBC fatty acid composition study (Chiu et al., 2003), we observed significant deficits in both DHA and arachidonic acid in the postmortem OFC of bipolar patients. Additionally, we provide preliminary evidence for elevations in arachidonic acid and saturated fatty acid metabolism in the postmortem OFC of bipolar patients that are consistent with elevations in elongase and Δ9-desaturase activities and deficits in peroxisomal function. Importantly, abnormalities in both omega-6 and saturated fatty acid metabolism were inversely correlated with DHA composition, suggesting that normalization of brain DHA composition may also normalize omega-6 and saturated fatty acid composition and metabolism. The observed deficits in polyunsaturated fatty acid composition may be due to dietary deficiency, impaired biosynthesis from dietary precursors, and/or lipid peroxidation mediated by reactive oxygen species (Kuloglu et al., 2002; Ozcan et al., 2004; Ranjekar et al., 2003). Conversely, central DHA deficits may instead increase vulnerability to lipid peroxidation (Green et al., 2001). Nevertheless, these results add to a growing body of evidence finding polyunsaturated fatty acid deficits in postmortem brain tissues from patients with recurrent neuropsychiatric illnesses, including bipolar disorder (present results), major depressive disorder (McNamara et al., 2007a), and schizophrenia (Horrobin et al., 1991; McNamara et al., 2007b; Yao et al., 2000), as well as patients with Alzheimer’s disease (Nakada et al., 1990; Soderberg et al., 1991) and peroxisomal disorders (Martinez, 1992).
Acknowledgments
This work was supported in part by National Institute of Mental Health grants MH073704 and MH074858 to R.K.M., and by the Department of Veterans Affairs Medical Research Service (NMR). Postmortem tissue was donated by The Stanley Medical Research Institute’s Brain Collection courtesy of Drs. Michael B. Knable, E. Fuller Torrey, Maree J. Webster, Serge Weis, and Robert H. Yolken, and the Harvard Brain Tissue Resource Center.
Footnotes
Publisher's Disclaimer: This is a PDF file of an unedited manuscript that has been accepted for publication. As a service to our customers we are providing this early version of the manuscript. The manuscript will undergo copyediting, typesetting, and review of the resulting proof before it is published in its final citable form. Please note that during the production process errors may be discovered which could affect the content, and all legal disclaimers that apply to the journal pertain.
References
- Altshuler LL, Bookheimer SY, Townsend J, Proenza MA, Eisenberger N, Sabb F, Mintz J, Cohen MS. Blunted activation in orbitofrontal cortex during mania: a functional magnetic resonance imaging study. Biol Psychiatry. 2005;58:763–769. doi: 10.1016/j.biopsych.2005.09.012. [DOI] [PubMed] [Google Scholar]
- Anderson GJ, Neuringer M, Lin DS, Connor WE. Can prenatal N-3 fatty acid deficiency be completely reversed after birth? Effects on retinal and brain biochemistry and visual function in rhesus monkeys. Pediatr Res. 2005;58:865–872. doi: 10.1203/01.pdr.0000182188.31596.5a. [DOI] [PubMed] [Google Scholar]
- Angst F, Stassen HH, Clayton PJ, Angst J. Mortality of patients with mood disorders: follow-up over 34-38 years. J Affect Disord. 2002;68:167–181. doi: 10.1016/s0165-0327(01)00377-9. [DOI] [PubMed] [Google Scholar]
- Bechara A. The role of emotion in decision-making: evidence from neurological patients with orbitofrontal damage. Brain Cogn. 2004;55:30–40. doi: 10.1016/j.bandc.2003.04.001. [DOI] [PubMed] [Google Scholar]
- Blumberg HP, Stern E, Ricketts S, Martinez D, de Asis J, White T, Epstein J, Isenberg N, McBride PA, Kemperman I, Emmerich S, Dhawan V, Eidelberg D, Kocsis JH, Silbersweig DA. Rostral and orbital prefrontal cortex dysfunction in the manic state of bipolar disorder. Am J Psychiatry. 1999;156:1986–1988. doi: 10.1176/ajp.156.12.1986. [DOI] [PubMed] [Google Scholar]
- Bosetti F, Rintala J, Seemann R, Rosenberger TA, Contreras MA, Rapoport SI, Chang MC. Chronic lithium downregulates cyclooxygenase-2 activity and prostaglandin E(2) concentration in rat brain. Mol Psychiatry. 2002;7:845–850. doi: 10.1038/sj.mp.4001111. [DOI] [PubMed] [Google Scholar]
- Bosetti F, Weerasinghe GR, Rosenberger TA, Rapoport SI. Valproic acid down-regulates the conversion of arachidonic acid to eicosanoids via cyclooxygenase-1 and -2 in rat brain. J Neurochem. 2003;85:690–696. doi: 10.1046/j.1471-4159.2003.01701.x. [DOI] [PubMed] [Google Scholar]
- Bourre JM, Dumont OL, Clement ME, Durand GA. Endogenous synthesis cannot compensate for absence of dietary oleic acid in rats. J Nutr. 1997;127:488–493. doi: 10.1093/jn/127.3.488. [DOI] [PubMed] [Google Scholar]
- Bucher HC, Hengstler P, Schindler C, Meier G. N-3 polyunsaturated fatty acids in coronary heart disease: a meta-analysis of randomized controlled trials. Am J Med. 2002;112:298–304. doi: 10.1016/s0002-9343(01)01114-7. [DOI] [PubMed] [Google Scholar]
- Buttner N, Bhattacharyya S, Walsh J, Benes FM. DNA fragmentation is increased in non-GABAergic neurons in bipolar disorder but not in schizophrenia. Schizophr Res. 2007;93:33–41. doi: 10.1016/j.schres.2007.01.030. [DOI] [PMC free article] [PubMed] [Google Scholar]
- Campbell WB, Falck JR, Okita JR, Johnson AR, Callahan KS. Synthesis of dihomoprostaglandins from adrenic acid (7,10,13,16-docosatetraenoic acid) by human endothelial cells. Biochim Biophys Acta. 1985;837:67–76. doi: 10.1016/0005-2760(85)90086-4. [DOI] [PubMed] [Google Scholar]
- Carver JD, Benford VJ, Han B, Cantor AB. The relationship between age and the fatty acid composition of cerebral cortex and erythrocytes in human subjects. Brain Res Bull. 2001;56:79–85. doi: 10.1016/s0361-9230(01)00551-2. [DOI] [PubMed] [Google Scholar]
- Chang MC, Contreras MA, Rosenberger TA, Rintala JJ, Bell JM, Rapoport SI. Chronic valproate treatment decreases the in vivo turnover of arachidonic acid in brain phospholipids: a possible common effect of mood stabilizers. J Neurochem. 2001;77:796–803. doi: 10.1046/j.1471-4159.2001.00311.x. [DOI] [PubMed] [Google Scholar]
- Chang MC, Jones CR. Chronic lithium treatment decreases brain phospholipase A2 activity. Neurochem Res. 1998;23:887–892. doi: 10.1023/a:1022415113421. [DOI] [PubMed] [Google Scholar]
- Chiu CC, Huang SY, Su KP, Lu ML, Huang MC, Chen CC, Shen WW. Polyunsaturated fatty acid deficit in patients with bipolar mania. Eur Neuropsychopharmacol. 2003;13:99–103. doi: 10.1016/s0924-977x(02)00130-x. [DOI] [PubMed] [Google Scholar]
- Contreras MA, Chang MC, Rosenberger TA, Greiner RS, Myers CS, Salem N, Jr, Rapoport SI. Chronic nutritional deprivation of n-3 alpha-linolenic acid does not affect n-6 arachidonic acid recycling within brain phospholipids of awake rats. J Neurochem. 2001;79:1090–1099. doi: 10.1046/j.1471-4159.2001.00658.x. [DOI] [PubMed] [Google Scholar]
- Cotter D, Hudson L, Landau S. Evidence for orbitofrontal pathology in bipolar disorder and major depression, but not in schizophrenia. Bipolar Disord. 2005;7:358–369. doi: 10.1111/j.1399-5618.2005.00230.x. [DOI] [PubMed] [Google Scholar]
- Daviglus ML, Stamler J, Orencia AJ, Dyer AR, Liu K, Greenland P, Walsh MK, Morris D, Shekelle RB. Fish consumption and the 30-year risk of fatal myocardial infarction. N Engl J Med. 1997;336:1046–1053. doi: 10.1056/NEJM199704103361502. [DOI] [PubMed] [Google Scholar]
- De Vriese SR, Christophe AB, Maes M. In humans, the seasonal variation in poly-unsaturated fatty acids is related to the seasonal variation in violent suicide and serotonergic markers of violent suicide. Prostaglandins Leukot Essent Fatty Acids. 2004;71:13–18. doi: 10.1016/j.plefa.2003.12.002. [DOI] [PubMed] [Google Scholar]
- Edwards R, Peet M, Shay J, Horrobin D. Omega-3 polyunsaturated fatty acid levels in the diet and in red blood cell membranes of depressed patients. J Affect Disord. 1998;48:149–155. doi: 10.1016/s0165-0327(97)00166-3. [DOI] [PubMed] [Google Scholar]
- Farooqui AA, Horrocks LA. Brain phospholipases A2: a perspective on the history. Prostaglandins Leukot Essent Fatty Acids. 2004;71:161–169. doi: 10.1016/j.plefa.2004.03.004. [DOI] [PubMed] [Google Scholar]
- Farooqui AA, Horrocks LA, Farooqui T. Modulation of inflammation in brain: a matter of fat. J Neurochem. 2007;101:577–99. doi: 10.1111/j.1471-4159.2006.04371.x. [DOI] [PubMed] [Google Scholar]
- Folch J, Lees M, Sloane-Stanley GH. A single method for the isolation and purification of total lipids from animal tissues. J. Biol. Chem. 1957;226:497–509. [PubMed] [Google Scholar]
- Freeman MP, Hibbeln JR, Wisner KL, Davis JM, Mischoulon D, Peet M, Keck PE, Marangell LB, Richardson AJ, Lake J, Stoll AL. Omega-3 fatty acids: Evidence basis for treatment and future research in psychiatry. J Clin Psychiatry. 2006;67:1954–1967. doi: 10.4088/jcp.v67n1217. [DOI] [PubMed] [Google Scholar]
- Frye MA, Salloum IM. Bipolar disorder and comorbid alcoholism: prevalence rate and treatment considerations. Bipolar Disord. 2006;8:677–685. doi: 10.1111/j.1399-5618.2006.00370.x. [DOI] [PubMed] [Google Scholar]
- Galli C, Marangoni F, Petroni A. Modulation of arachidonic acid metabolism in cultured rat astroglial cells by long-chain N-3 fatty acids. Adv Exp Med Biol. 1992;318:115–120. doi: 10.1007/978-1-4615-3426-6_10. [DOI] [PubMed] [Google Scholar]
- Garbay B, Boiron-Sargueil F, Shy M, Chbihi T, Jiang H, Kamholz J, Cassagne C. Regulation of oleoyl-CoA synthesis in the peripheral nervous system: demonstration of a link with myelin synthesis. J Neurochem. 1998;71:1719–1726. doi: 10.1046/j.1471-4159.1998.71041719.x. [DOI] [PubMed] [Google Scholar]
- Green P, Glozman S, Weiner L, Yavin E. Enhanced free radical scavenging and decreased lipid peroxidation in the rat fetal brain after treatment with ethyl docosahexaenoate. Biochim Biophys Acta. 2001;1532:203–212. doi: 10.1016/s1388-1981(01)00132-9. [DOI] [PubMed] [Google Scholar]
- Hibbeln JR. Fish consumption and major depression. Lancet. 1998;351:1213. doi: 10.1016/S0140-6736(05)79168-6. [DOI] [PubMed] [Google Scholar]
- Horrobin DF, Manku MS, Hillman H, Iain A, Glen M. Fatty acid levels in the brains of schizophrenics and normal controls. Biol Psychiatry. 1991;30:795–805. doi: 10.1016/0006-3223(91)90235-e. [DOI] [PubMed] [Google Scholar]
- Huan M, Hamazaki K, Sun Y, Itomura M, Liu H, Kang W, Watanabe S, Terasawa K, Hamazaki T. Suicide attempt and n-3 fatty acid levels in red blood cells: a case control study in China. Biol Psychiatry. 2004;56:490–496. doi: 10.1016/j.biopsych.2004.06.028. [DOI] [PubMed] [Google Scholar]
- Jones CR, Arai T, Bell JM, Rapoport SI. Preferential in vivo incorporation of [3H]arachidonic acid from blood in rat brain synaptosomal fractions before and after cholinergic stimulation. J Neurochem. 1996;67:822–829. doi: 10.1046/j.1471-4159.1996.67020822.x. [DOI] [PubMed] [Google Scholar]
- Keck PE, Jr, Mintz J, McElroy SL, Freeman MP, Suppes T, Frye MA, Altshuler LL, Kupka R, Nolen WA, Leverich GS, Denicoff KD, Grunze H, Duan N, Post RM. Double-blind, randomized, placebo-controlled trials of ethyl-eicosapentanoate in the treatment of bipolar depression and rapid cycling bipolar disorder. Biol Psychiatry. 2006;60:1020–1022. doi: 10.1016/j.biopsych.2006.03.056. [DOI] [PubMed] [Google Scholar]
- Kringelbach ML. The human orbitofrontal cortex: linking reward to hedonic experience. Nat Rev Neurosci. 2005;6:691–702. doi: 10.1038/nrn1747. [DOI] [PubMed] [Google Scholar]
- Kruger S, Seminowicz D, Goldapple K, Kennedy SH, Mayberg HS. State and trait influences on mood regulation in bipolar disorder: blood flow differences with an acute mood challenge. Biol Psychiatry. 2003;54:1274–1283. doi: 10.1016/s0006-3223(03)00691-7. [DOI] [PubMed] [Google Scholar]
- Kuloglu M, Ustundag B, Atmaca M, Canatan H, Tezcan AE, Cinkilinc N. Lipid peroxidation and antioxidant enzyme levels in patients with schizophrenia and bipolar disorder. Cell Biochem Funct. 2002;20:171–175. doi: 10.1002/cbf.940. [DOI] [PubMed] [Google Scholar]
- Landen M, Davidsson P, Gottfries CG, Mansson JE, Blennow K. Reduction of the synaptophysin level but normal levels of glycerophospholipids in the gyrus cinguli in schizophrenia. Schizophr. Res. 2002;55:83–88. doi: 10.1016/s0920-9964(01)00197-9. [DOI] [PubMed] [Google Scholar]
- Lee CH, Hajra AK. Molecular species of diacylglycerols and phosphoglycerides and the postmortem changes in the molecular species of diacylglycerols in rat brains. J Neurochem. 1991;56:370–379. doi: 10.1111/j.1471-4159.1991.tb08161.x. [DOI] [PubMed] [Google Scholar]
- Leonard AE, Pereira SL, Sprecher H, Huang YS. Elongation of long-chain fatty acids. Prog Lipid Res. 2004;43:36–54. doi: 10.1016/s0163-7827(03)00040-7. [DOI] [PubMed] [Google Scholar]
- London ED, Ernst M, Grant S, Bonson K, Weinstein A. Orbitofrontal cortex and human drug abuse: functional imaging. Cereb Cortex. 2000;10:334–342. doi: 10.1093/cercor/10.3.334. [DOI] [PubMed] [Google Scholar]
- Lopez-Larson MP, DelBello MP, Zimmerman ME, Schwiers ML, Strakowski SM. Regional prefrontal gray and white matter abnormalities in bipolar disorder. Biol Psychiatry. 2002;52:93–100. doi: 10.1016/s0006-3223(02)01350-1. [DOI] [PubMed] [Google Scholar]
- Martinez M. Abnormal profiles of polyunsaturated fatty acids in the brain, liver, kidney and retina of patients with peroxisomal disorders. Brain Res. 1992;583:171–182. doi: 10.1016/s0006-8993(10)80021-6. [DOI] [PubMed] [Google Scholar]
- Martinez M. Restoring the DHA levels in the brains of Zellweger patients. J Mol Neurosci. 2001;16:309–316. doi: 10.1385/JMN:16:2-3:309. [DOI] [PubMed] [Google Scholar]
- McNamara RK, Carlson SE. Role of omega-3 fatty acids in brain development and function: Potential implications for the pathogenesis and prevention of psychopathology. Prostogland Leukotrienes Essential Fatty Acids. 2006;75:329–349. doi: 10.1016/j.plefa.2006.07.010. [DOI] [PubMed] [Google Scholar]
- McNamara RK, Ostrander M, Abplanalp W, Richtand NM, Benoit S, Clegg D. Modulation of phosphoinositide-protein kinase C signal transduction by omega-3 fatty acids: Implications for the pathophysiology and treatment of recurrent neuropsychiatric illness. Prostogland Leukotrienes Essential Fatty Acids. 2006;75:237–257. doi: 10.1016/j.plefa.2006.07.009. [DOI] [PubMed] [Google Scholar]
- McNamara RK, Hahn CG, Jandacek R, Rider T, Tso P, Stanford KE, Richtand NM. Selective deficits in the omega-3 fatty acid docosahexaenoic acid in the postmortem orbitofrontal cortex of patients with major depressive disorder. Biol Psychiatry. 2007a;62:17–24. doi: 10.1016/j.biopsych.2006.08.026. [DOI] [PubMed] [Google Scholar]
- McNamara RK, Jandacek R, Rider T, Tso P, Hahn CG, Richtand NM, Stanford KE. Abnormalities in the fatty acid composition of the postmortem orbitofrontal cortex of schizophrenic patients: gender differences and partial normalization with antipsychotic medications. Schizophr Res. 2007b;91:37–50. doi: 10.1016/j.schres.2006.11.027. [DOI] [PMC free article] [PubMed] [Google Scholar]
- Metcalfe LD, Schmitz AA, Pelka JR. Rapid preparation of fatty acid esters from lipids for gas chromatographic analysis. Anal Chem. 1966;38:514–515. [Google Scholar]
- Myers CS, Contreras MA, Chang MC, Rapoport SI, Appel NM. Haloperidol downregulates phospholipase A(2) signaling in rat basal ganglia circuits. Brain Res. 2001;896:96–101. doi: 10.1016/s0006-8993(01)02014-5. [DOI] [PubMed] [Google Scholar]
- Nakada T, Kwee IL, Ellis WG. Membrane fatty acid composition shows delta-6-desaturase abnormalities in Alzheimer’s disease. Neuroreport. 1990;1:153–155. doi: 10.1097/00001756-199010000-00018. [DOI] [PubMed] [Google Scholar]
- Ntambi JM. Regulation of stearoyl-CoA desaturase by polyunsaturated fatty acids and cholesterol. J Lipid Res. 1999;40:1549–1558. [PubMed] [Google Scholar]
- Noaghiul S, Hibbeln JR. Cross-national comparisons of seafood consumption and rates of bipolar disorders. Am J Psychiatry. 2003;160:2222–2227. doi: 10.1176/appi.ajp.160.12.2222. [DOI] [PubMed] [Google Scholar]
- Ozcan ME, Gulec M, Ozerol E, Polat R, Akyol O. Antioxidant enzyme activities and oxidative stress in affective disorders. Int Clin Psychopharmacol. 2004;19:89–95. doi: 10.1097/00004850-200403000-00006. [DOI] [PubMed] [Google Scholar]
- Pawlosky RJ, Bacher J, Salem N. Ethanol consumption alters electroretinograms and depletes neural tissues of docosahexaenoic acid in rhesus monkeys: nutritional consequences of a low n-3 fatty acid diet. Alcohol Clin Exp Res. 2001;25:1758–1765. [PubMed] [Google Scholar]
- Peet M. International variations in the outcome of schizophrenia and the prevalence of depression in relation to national dietary practices: an ecological analysis. Br J Psychiatry. 2004;184:404–408. doi: 10.1192/bjp.184.5.404. [DOI] [PubMed] [Google Scholar]
- Peet M, Murphy B, Shay J, Horrobin D. Depletion of omega-3 fatty acid levels in red blood cell membranes of depressive patients. Biol Psychiatry. 1998;43:315–319. doi: 10.1016/s0006-3223(97)00206-0. [DOI] [PubMed] [Google Scholar]
- Petroni A, Salami M, Blasevich M, Papini N, Galli C. Inhibition by n-3 fatty acids of arachidonic acid metabolism in a primary culture of astroglial cells. Neurochem Res. 1994;19:1187–1193. doi: 10.1007/BF00965154. [DOI] [PubMed] [Google Scholar]
- Rajkowska G. Postmortem studies in mood disorders indicate altered numbers of neurons and glial cells. Biol Psychiatry. 2000;48:766–777. doi: 10.1016/s0006-3223(00)00950-1. [DOI] [PubMed] [Google Scholar]
- Ranjekar PK, Hinge A, Hegde MV, Ghate M, Kale A, Sitasawad S, Wagh UV, Debsikdar VB, Mahadik SP. Decreased antioxidant enzymes and membrane essential polyunsaturated fatty acids in schizophrenic and bipolar mood disorder patients. Psychiatry Res. 2003;121:109–122. doi: 10.1016/s0165-1781(03)00220-8. [DOI] [PubMed] [Google Scholar]
- Rao JS, Ertley RN, Demar JC, Jr, Rapoport SI, Bazinet RP, Lee HJ. Dietary n-3 PUFA deprivation alters expression of enzymes of the arachidonic and docosahexaenoic acid cascades in rat frontal cortex. Mol Psychiatry. 2007;12:151–157. doi: 10.1038/sj.mp.4001887. [DOI] [PubMed] [Google Scholar]
- Ross BM, Hughes B, Kish SJ, Warsh JJ. Serum calcium-independent phospholipase A2 activity in bipolar affective disorder. Bipolar Disord. 2006;8:265–270. doi: 10.1111/j.1399-5618.2006.00299.x. [DOI] [PubMed] [Google Scholar]
- Soderberg M, Edlund C, Kristensson K, Dallner G. Fatty acid composition of brain phospholipids in aging and in Alzheimer’s disease. Lipids. 1991;26:421–425. doi: 10.1007/BF02536067. [DOI] [PubMed] [Google Scholar]
- Sprecher H, Chen Q. Polyunsaturated fatty acid biosynthesis: a microsomal-peroxisomal process. Prostaglandins Leukot Essent Fatty Acids. 1999;60:317–321. doi: 10.1016/s0952-3278(99)80006-4. [DOI] [PubMed] [Google Scholar]
- Stoll AL, Severus WE, Freeman MP, Rueter S, Zboyan HA, Diamond E, Cress KK, Marangell LB. Omega 3 fatty acids in bipolar disorder: a preliminary double-blind, placebo-controlled trial. Arch Gen Psychiatry. 1999;56:407–412. doi: 10.1001/archpsyc.56.5.407. [DOI] [PubMed] [Google Scholar]
- Sublette ME, Hibbeln JR, Galfalvy H, Oquendo MA, Mann JJ. Omega-3 polyunsaturated essential fatty acid status as a predictor of future suicide risk. Am J Psychiatry. 2006;163:1100–1102. doi: 10.1176/ajp.2006.163.6.1100. [DOI] [PubMed] [Google Scholar]
- Suzuki H, Manabe S, Wada O, Crawford MA. Rapid incorporation of docosahexaenoic acid from dietary sources into brain microsomal, synaptosomal and mitochondrial membranes in adult mice. Int J Vitam Nutr Res. 1997;67:272–278. [PubMed] [Google Scholar]
- Tanskanen A, Hibbeln JR, Hintikka J, Haatainen K, Honkalampi K, Viinamaki H. Fish consumption, depression, and suicidality in a general population. Arch Gen Psychiatry. 2001;58:512–513. doi: 10.1001/archpsyc.58.5.512. [DOI] [PubMed] [Google Scholar]
- Torrey EF, Barci BM, Webster MJ, Bartko JJ, Meador-Woodruff JH, Knable MB. Neurochemical markers for schizophrenia, bipolar disorder, and major depression in postmortem brains. Biol Psychiatry. 2005;57:252–260. doi: 10.1016/j.biopsych.2004.10.019. [DOI] [PubMed] [Google Scholar]
- Torrey EF, Webster M, Knable M, Johnston N, Yolken RH. The Stanley Foundation brain collection and Neuropathology Consortium. Schizophr Res. 2000;44:151–155. doi: 10.1016/S0920-9964(99)00192-9. [DOI] [PubMed] [Google Scholar]
- Uranova N, Orlovskaya D, Vikhreva O, Zimina I, Kolomeets N, Vostrikov V, Rachmanova V. Electron microscopy of oligodendroglia in severe mental illness. Brain Res Bull. 2001;55:597–610. doi: 10.1016/s0361-9230(01)00528-7. [DOI] [PubMed] [Google Scholar]
- Wang HY, Friedman E. Enhanced protein kinase C activity and translocation in bipolar affective disorder brains. Biol Psychiatry. 1996;40:568–575. doi: 10.1016/0006-3223(95)00611-7. [DOI] [PubMed] [Google Scholar]
- Wilson R, Bell MV. Molecular species composition of glycerophospholipids from white matter of human brain. Lipids. 1993;28:13–17. doi: 10.1007/BF02536353. [DOI] [PubMed] [Google Scholar]
- Yao JK, Leonard S, Reddy RD. Membrane phospholipid abnormalities in postmortem brains from schizophrenic patients. Schizophr Res. 2000;42:7–17. doi: 10.1016/s0920-9964(99)00095-x. [DOI] [PubMed] [Google Scholar]
- Zhu Y, Schwarz S, Ahlemeyer B, Grzeschik S, Klumpp S, Krieglstein J. Oleic acid causes apoptosis and dephosphorylates Bad. Neurochem Int. 2005;46:127–135. doi: 10.1016/j.neuint.2004.08.003. [DOI] [PubMed] [Google Scholar]