
Figure 4.
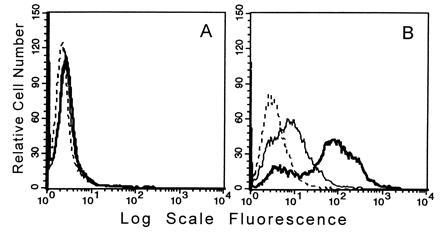
FACS analysis of CD68 surface expression on intact THP-1 cells. Binding of KP-1 (bold line) and EBM-11 (normal line) compared with that of a mouse isotype control IgG (dashed line) to intact unstimulated THP-1 monocytes (A) or to THP-1 macrophages after 3 days of stimulation with 100 nM PMA (B). In A the curves for KP-1 and EBM-11 are superimposed on one another. Only cells negative for binding of pancytokeratin were included in the analysis.