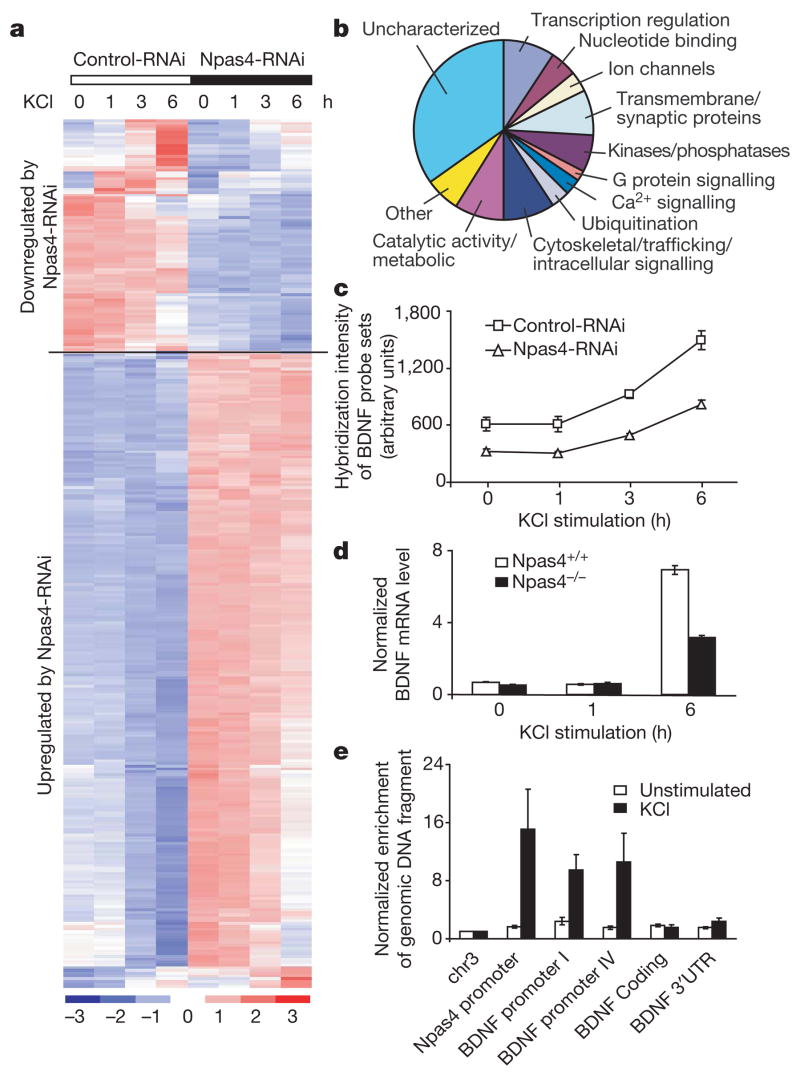
Figure 5. Npas4 controls a program of gene expression that regulates GABAergic synapses.
a, Hierarchical clustering of 327 probe sets (270 putative Npas4 target genes) based on their expression profiles using dChip49. The expression level of each probe set is normalized to a mean of 0 and a standard deviation of 1. Expression values are displayed within the range [−3, 3] with levels above, equal to or below the mean displayed in red, white and blue, respectively. Dark red represents 3 or higher, and dark blue −3 or lower. b, Biological functions of 270 putative Npas4 target genes based on Gene Ontology information provided by Affymetrix (http://www.affymetrix.com). c, BDNF expression is reduced by Npas4-RNAi (1.9 ± 0.11-fold reduction, P < 0.01, one-tailed paired t-test). Mean ± s.e.m. from three independent experiments is shown, and each data point was generated by averaging the hybridization intensity of two BDNF probe sets (1422168_a_at and 1422169_a_at). d, BDNF levels are consistently reduced in neurons from Npas4−/− mice compared with their wild-type littermates (58.46 ± 6.49% decrease, 95% confidence interval 30.5–86.4%). Cortical cultures prepared from Npas4+/+ and Npas4−/− littermates (7 DIV) were stimulated with KCl (55 mM), and BDNF mRNA levels were measured by quantitative reverse transcriptase PCR using primers in BDNF coding region. Three littermate pairs from three different litters were analysed; data (mean ± s.e.m.) from one representative pair is shown. e, Npas4 interacts directly with BDNF promoters I and IV in an activity-dependent manner, as shown by chromatin immunoprecipitation. The Npas4 promoter is used as a positive control. Data are normalized to a control region on chromosome 3 and are presented as mean ± s.e.m. from five independent experiments.

