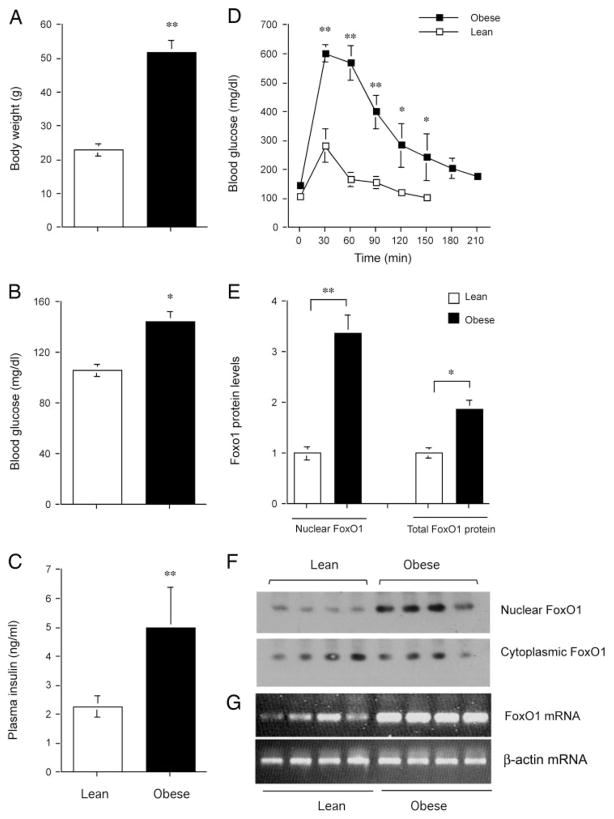
Fig. 7.
FoxO1 expression in high-fat diet-induced obese mice. C57 BL/6J mice at 6 wk of age were fed a high-fat diet (n = 6) or regular chow (n = 6) for 2 months. A, Body weight. B, Fasting blood glucose levels. C, Fasting plasma insulin levels. D, Blood glucose profiles during GTT. E, Nuclear and total FoxO1 protein levels. F, Immunoblot of cytoplasmic vs. nuclear FoxO1 protein. G, FoxO1 mRNA levels. Total liver RNA was prepared for the determination of FoxO1 mRNA levels by semiquantitative RT-PCR using β-actin mRNA as control. Fasting blood glucose and plasma insulin levels were determined after a 16-h fast. *, P < 0.05; **, P < 0.001.

