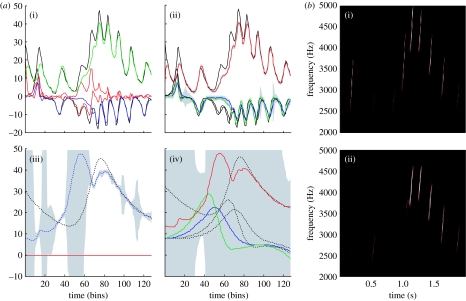
Figure 3.
Results of a Bayesian inversion or deconvolution of the sonogram shown in figure 2. (a) Song recognition: the time courses of (i) causal and (ii) hidden states. (i) These are the true and predicted states driving the syrinx and are simple mappings from two of the three hidden states of the first-level attractor. The solid lines correspond to the conditional mode and the dotted lines correspond to the true values. The discrepancy is the prediction error and is shown as a red line. (ii) The true and estimated hidden states of the first-level attractor. Note that the third hidden state has to be inferred from the sensory data. Confidence intervals on the conditional expectations are shown in grey and demonstrate a high degree of confidence, because a low level of sensory noise was used in these simulations. Also shown are the corresponding (iii) causes and (iv) hidden states at the second level. Again, the conditional expectations are shown as solid lines and the true values as broken lines. Note the inflated conditional confidence interval halfway through the song when the third and fourth chirps are misperceived. (b)(i) The stimulus and (ii) percept in sonogram format, detailing the expression of different frequencies generated over peristimulus time.

