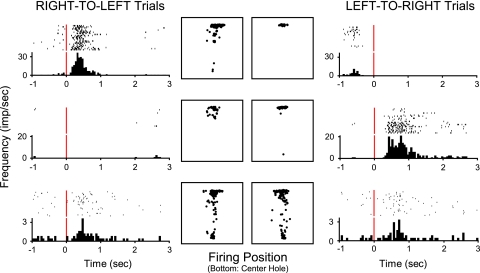
Fig. 2.
Raster displays, firing rate histograms, and firing positions from three example neurons for reward-related neurons. The upper panels show a unit that preferred the RIGHT-TO-LEFT sequence. The middle panels show a unit that preferred the LEFT-TO-RIGHT sequence, and the bottom panels show an episode-independent type. Each raster display and histogram was aligned with the time of reward delivery (t = 0). The two figures depicted at the center of each row show the firing positions of each unit from the top view of the experimental chamber (from the onset of reward delivery to the offset of the central light). The central hole is shown at the bottom of each figure

