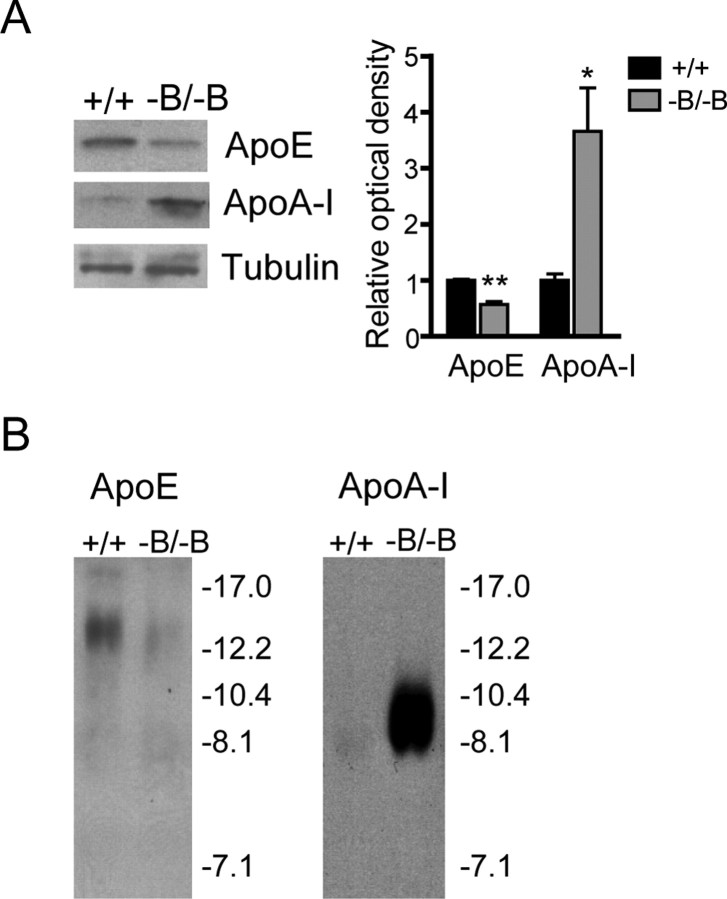
Figure 5.
ApoE and ApoA-I levels in the brain and CSF of Abca1−B/−B mice. A, Immunoblots of brain tissue from control and Abca1−B/−B mice using ApoE and ApoA-I specific antibodies. Tubulin was used as a loading control. Densitometry analysis demonstrated a 40% decrease in ApoE and a 250% increase in ApoA-I signal intensity in Abca1−B/−B mice compared with control mice. Graph shows means ± SEM (*p < 0.05, **p < 0.01, n = 3 per group). B, CSF samples (3 μl) were run on a nondenaturing gel and probed for ApoE (left) and ApoA-I (right).

