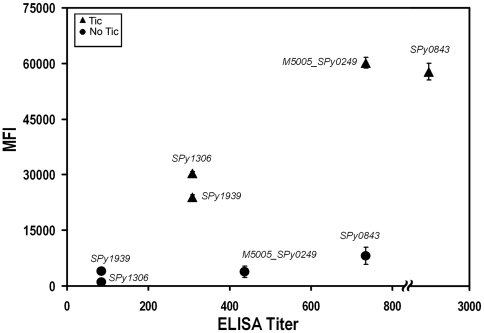
Figure 3. Correlation between sera ELISA titers and MFI.
Black circles and triangles represent the ELISA Titers (geometric means, x-axis) and Mean Fluorescent Intensities (arithmetic means, y-axis) obtained using 8 sera from either no tic or tic patients with each of the antigens Spy0843, M5005_Spy0249, Spy1306 and Spy1939. Standard errors of the means are reported. Both ELISA titers and MFIs differences between the two sera classes were statistically significant with P values<0.05 calculated either with T Student (ELISA) or Fisher's exact test (MFI).

