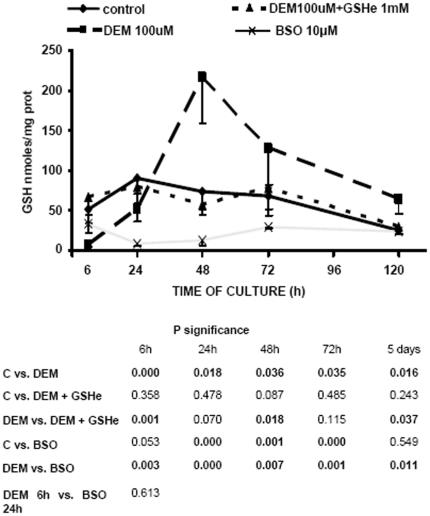
Figure 2. GSH depletion in 3T3 fibroblasts. The total cellular GSH concentration was assessed.
The cells were plated as described previously (4) and after attaching 100 µM DEM, or 10 mM BSO, or 100 µM DEM+1 mM GSHe were added. The total cellular concentration of GSH was determined spectrophotometrically as described in “Materials and Methods”. The results are presented as mean±SD of 5–12 different experiments.

