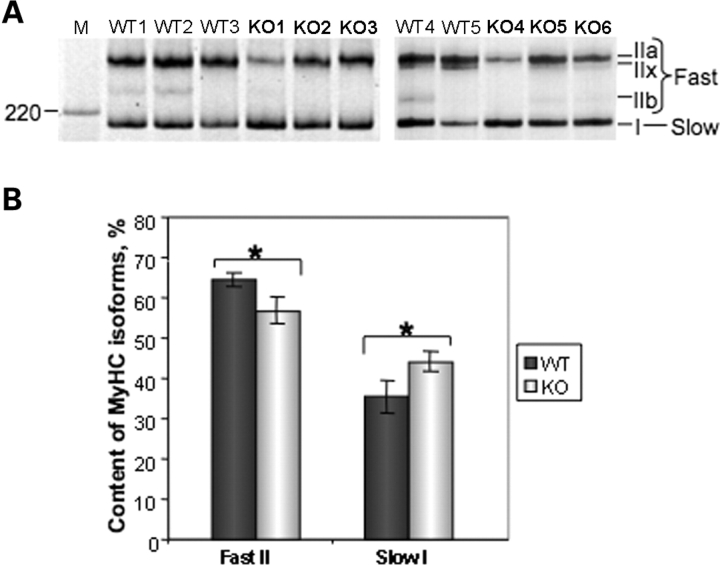
Figure 8.
Decreased axonal diameter in T32KO is associated with a shift in fiber-type-specific MYHC isoforms. (A) MYHC isoform gel electrophoresis of soleus muscle lysates. Positions of individual MYHC isoforms are indicated. Five WT and six KO muscles were analyzed. M: Benchmark protein ladder (Invitrogen). (B) Quantification of the gels shown in (A). The fraction corresponding to individual MYHC isoforms were calculated as a percent of total MYHC content ± SEM in each sample. This accounted for the differences in loading. MYHC isoforms IIa and IIx co-migrate, and therefore were quantified together. Amount of MYHC type II (fast) is decreased and amount of MYHC type I (slow) is increased in T32KO soleus muscle by ∼8%, compared with WT (*P < 0.05).

