
Fig. 6.
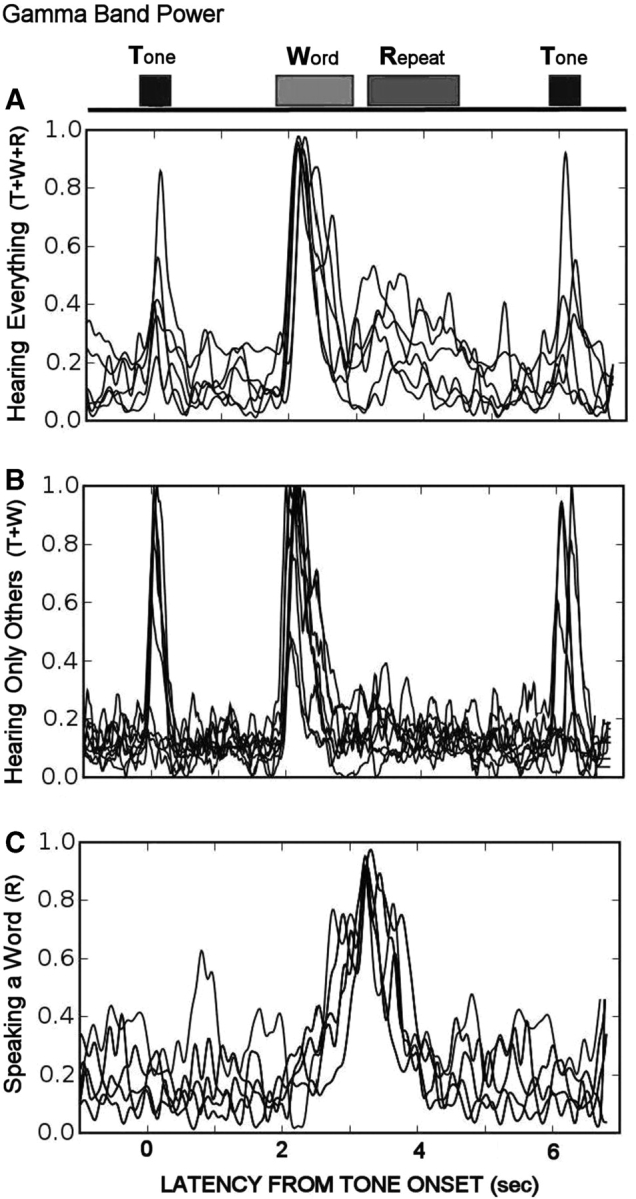
Changes in ECoG power in the high gamma band (70–100 Hz) for each event. Within each box, each tracing represents a different subject. (A) ECoG channels close to the primary auditory cortex showed increased gamma activity for all events. (B) ECoG channels located over primary auditory areas of the temporal lobe responded to all external events except the subject's own voice. (C) Frontal/parietal ECoG channels showed increased gamma activity only when the subjects said the words.