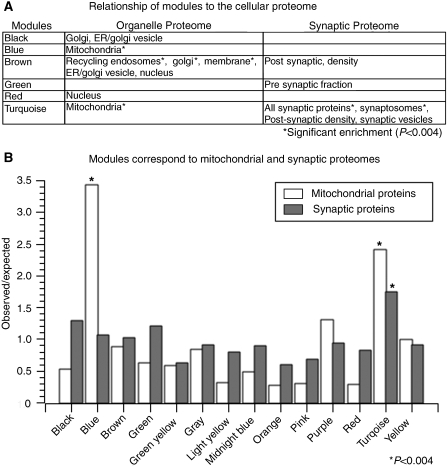
Figure 5.
Modules correspond to various aspects of the proteome. Comparison of module membership to the organelle proteome and synaptic proteome. (A) Table depicting modules with nominally significant (P<0.05) enrichment in specific components of either the organelle or synaptic proteome. Three modules have significant overlap with the organelle proteome after strict Bonferroni correction (P<0.004), including the brown (#3), blue (#2), and turquoise (#12) modules. The brown (#3) module overlaps significantly with multiple organelles that are involved in protein trafficking, such as the golgi (P=7.7e−4), recycling endosomes (P=7.4e−11), and the plasma membrane (P=3.0e−5). (B) Barplot showing the comparisons between module membership and the mitochondrial or synaptic proteomes. The y-axis represents the observed to expected ratio of enrichment of either mitochondrial or synaptic proteins (see key) within each module. The asterisk denotes significant enrichment within the module after Bonferroni correction (P<0.004). Mitochondrial proteins are 3.4 (P=6.4e−9) and 2.4 fold (P=5.6e−5) enriched in the blue (#2) and turquoise (#12) modules, respectively. However, the synaptic proteins are only significantly enriched over expected values in the turquoise module (P=2.4e−7).

