Figure 7.
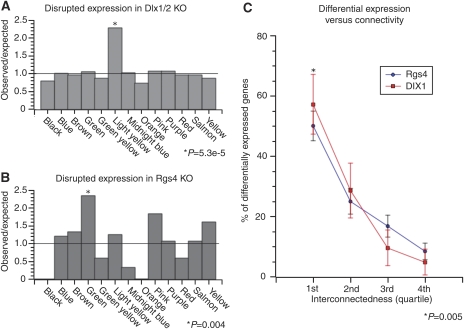
In vivo validation of network model. Validation of the network model using gene expression data from two separate knockout mice. (A) Barplot representing the observed to expected ratio of differentially expressed genes (P<0.01) by module in the Dlx1/2 knockout mice and (B) Rgs4 knockout mice. In both the cases, only the modules containing the deleted gene were significantly enriched in differentially expressed genes (P<0.05). (C) Relationship between a gene's topological overlap or connectedness with a ‘hub' gene (i.e. Dlx1/Dlx2 or Rgs4) and differential expression. Genes were ranked by connectivity within the module and the number that was differentially expressed within each quartile was counted and expressed as a percentage of total differentially expressed genes within the module. Error bars show the margin of error for the percentages. In both modules, there is a clear relationship in which genes that are highly connected to the deleted gene are more likely to be differentially expressed than other genes that are not as well connected. Nearly 60% of the genes that were differentially expressed in the enriched modules of either knockout strains were in the top quartile of connectivity with the deleted gene, which is significantly greater than other quartiles (P<0.005).

