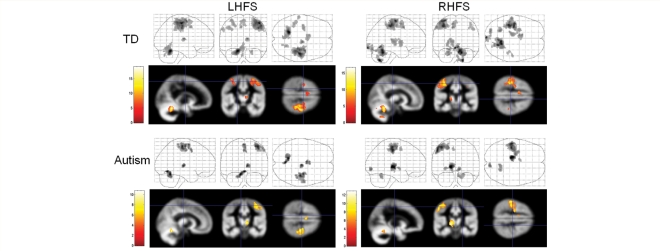
Figure 1.
Glass brain and sectional maps showing regions where fMRI activation was significantly associated with LHFS (left images) and RHFS (right images), each contrasted with rest, for TD children (upper images) and children with autism (lower images). All maps were thresholded at P = 0.05 corrected for multiple comparisons. Neurologic convention is used (i.e. right = right hemisphere; projections looking rightward or into the page).

