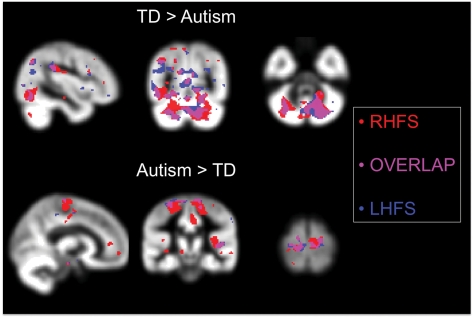
Figure 3.
Sectional maps showing localization of differences in fMRI activation between children with autism and TD children during RHFS (red), LHFS (blue), and the overlap between RHFS and LHFS (pink). The upper maps show regions where TD children showed greater activation than did those with autism; the lower maps show regions where children with autism showed greater activation than did TD children. The results are based on a Gaussian random effects analysis of each group of 13 participants; all maps were thresholded at P = 0.05 uncorrected for multiple comparisons. Representative slices are shown in the sagittal (left hemisphere), coronal and axial planes. Neurologic convention is used (i.e. right = right hemisphere; projections looking rightward or into the page).

