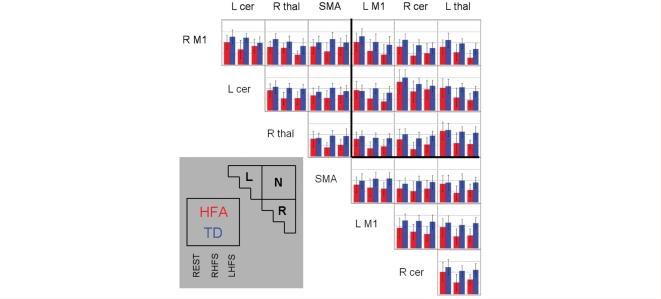
Figure 4.
Bar graphs demonstrating differences in functional connectivity between HFA and TD children. The legend in the grey box explains how information is presented. Within the triangle as a whole, the six boxes in the top-left portion represent connectivity between region-pairs in left-handed (L) motor circuits (e.g. right motor cortex, left cerebellum), the six boxes in the bottom-right portion represent connectivity between region-pairs in right-handed (R) motor circuits (e.g. left motor cortex, right cerebellum), and the nine boxes in the top-right represent connectivity between region-pairs in hand-neutral (N) motor circuits (e.g. right motor cortex, left motor cortex). Within each box, the three plots, from left to right, represent connectivity between the region pair during rest (left), RHFS (middle) and LHFS (right), respectively; children with HFA are shown in red and TD children are show in blue. Also within each box, the y-axis represents normalized r-values, and the axis ranges from 0 to 2; standard deviation bars are shown. Labels at the top and left of the figure demonstrated the region-pairs examined in each box (R = right; L = left; M1 = primary motor cortex; cer = anterior cerebellum; thal = thalamus).

