

Abstract
Proton MR spectroscopic imaging (MRSI) of human cerebral cortex is complicated by the presence of an intense signal from subcutaneous lipids, which, if not suppressed before Fourier reconstruction, causes ringing and signal contamination throughout the metabolite images as a result of limited k-space sampling. In this article, an improved reconstruction of the lipid region is obtained using the Papoulis-Gerchberg algorithm. This procedure makes use of the narrow-band-limited nature of the subcutaneous lipid signal to extrapolate to higher k-space values without alteration of the metabolite signal region. Using computer simulations and in vivo experimental studies, the implementation and performance of this algorithm were examined. This method was found to permit MRSI brain spectra to be obtained without applying any lipid suppression during data acquisition, at echo times of 50 ms and longer. When applied together with optimized acquisition methods, this provides an effective procedure for imaging metabolite distributions in cerebral cortical surface regions.
Keywords: 1H NMR spectrscopy, brain, truncation artifact, Papoulis-Gerchberg algorithm
INTRODUCTION
In vivo MR spectroscopic imaging (MRSI) (1, 2) is typically obtained using only a limited number of sample points in the spatial dimensions. This is necessary to offset sensitivity limitations while also maintaining acceptable acquisition times. With Fourier reconstruction, the effect of this limited sampling is the well-known Gibbs ringing and the associated signal contamination. The most commonly applied method for reducing this ringing is application of a spatial filter, though this also results in an undesirable decrease in spatial resolution. When multiple averages are required, e.g., with 31P MRSI, some advantage can be gained by using weighted averaging on acquisition to perform the spatial filtering (3); however, for 1H MRSI, this option is not feasible, because only a single acquisition per k-space point is typically required. For all imaging methods, some optimization of the k-space sampling distributions (4-6) can be used to obtain small improvements in the spatial response function.
For 1H MRSI in human brain, the effect of truncated sampling can be particularly severe because of the presence of an intense signal arising from subcutaneous lipids in the scalp, which may be one or two orders of magnitude greater than the metabolite resonances of interest. These lipid resonances cover a wide frequency range in the spectral dimension, which is further broadened by magnetic field inhomogeneity caused by local susceptibility gradients at the edge of the head. The resultant lipid resonances overlap a large spectral region of interest, and if not suppressed the Gibbs ringing from this region makes measurement of metabolites throughout the brain extremely difficult. Several methods of reducing the lipid signal intensity on acquisition have been proposed, including long echo times (7), preselection of a volume in the brain using volume selective excitation (8), outer volume suppression (9), and lipid nulling (10). Unfortunately, the implementation of a spatially selective excitation or suppression method, which completely removes lipid signals while leaving neighboring brain metabolite signals unaltered, is currently problematic, making observation of cerebral cortex near the brain surface extremely difficult. Similarly, lipid saturation or nulling may also alter metabolite resonance intensities. Consequently, all of these techniques result in some loss of either spatial or spectral information.
An alternative, although not mutually exclusive, approach to lipid suppression is acquisition of the complete 1H MRSI data, including the full signal from the lipid region, followed by application of alternative reconstruction or postprocessing procedures to limit the truncation artifacts. For imaging of cortical surface regions, this approach requires the almost complete suppression of lipid signals within a distance equivalent to one or two nominal voxels in the metabolite image. De Beer et al. (11) have proposed subtraction of the lipid rcsonances after Fourier reconstruction and line-fitting. However, as demonstrated later in this report, we have found that for 1H MRSI of human brain, the interference patterns due to Gibbs ringing from different lipid signals at multiple scalp regions result in such rapid spatial anti spectral variations of the contaminating lipid signal that the line-fitting techniques are severely limited in separating metabolite resonances from the strong interfering lipid signal.
Alternative spectral analysis methods, such as maximum entropy and autoregressive estimation, have improved performance over Fourier analysis for truncated data samples (12). These methods potentially offer some advantage if applied to spatial reconstruction: however, these have yet to be demonstrated for in vivo MRSI data which frequently exhibit low signal-to-noise ratios (SNRs). More promising methods appear to be modeling-based image reconstruction methods, which permit extrapolation of the acquired data to reduce the truncation artifacts. A review of these methods has been presented (13). These methods have been shown to provide a reduction of Gibbs ringing seen in MRI data; however, they have not been applied to the much more severe case of lipid ringing in 1H MRSI. Plevritis (14) has used maximum likelihood reconstruction, a noniterative extrapolation method that uses prior knowledge of the boundary of the brain and head using a MRI reference image. Our experience with this method (J. Gerson, M. W. Weiner, A. A. Maudsley; unpublished results) indicates that, although some improvement of the lipid ringing can be obtained, the method is sensitive to noise and boundary definitions, which require exact coregistration of MRI and MRSI information. For removal of ringing from subcutaneous lipids, we have achieved greater levels of reduction with the method presented here, which we also find to be much more robust.
A report that specifically addresses the lipid contamination in MRSI has been presented by Patel et al. (15), and related reports using weighted averaging (16, 17) have been presented using a 1D example. In these reports, an iterative data extrapolation method was applied to the lipid resonance only. By effectively improving the spatial resolution for this signal region, the lipid ringing and signal contamination was reduced. The algorithm takes advantage of the known distribution of the lipids, obtained using a reference MRI, and the acquired data are maintained at all iterations, assuring no alteration of the metabolite information. This iterative extrapolation method is very similar to a 2D implementation of the Papoulis-Gerchberg (PG) algorithm (18, 19), for extrapolation of band-limited signals. For 1H MRSI, the subcutaneous lipid signal has a good SNR and is localized to a narrow region, i.e., it is strongly band-limited. These characteristics indicate that the PG algorithm can be expected to perform well for extrapolation of lipid signals. In this article, we examine the performance of the PG algorithm applied to the lipid resonances in MRSI data, using information of the signal distribution obtained directly from the MRSI data.
Several studies have examined the performance of the PG algorithm (20-23) for data extrapolation and for interpolation of missing samples; however, these have typically considered signals with a SNR, bandwidth, and relative extrapolation factors that are inappropriate for MRSI data. In all cases, the PG algorithm was used to concentrate signal energy within the known band-limited signal region. In this article, we consider a different aim, i.e., to reduce ringing outside of that region. We examine the performance and several implementation issues of this algorithm for application to 1H MRSI data, with the aim of developing methods to obtain metabolite images and spectra from human cortex without distortion from subcutaneous lipid signals. To achieve this aim, it is assumed that 1H MRSI is to be carried out with no form of lipid suppression beyond that obtained by moderate T2 losses. Results are demonstrated using computer simulations and with metabolite images and spectra obtained from human brain at 1.5T.
METHODS
Implementation of the PG Algorithm
The PG algorithm is an iterative technique that extrapolates a discretely sampled signal outside its measured time interval, when its Fourier transform (FT) is band-limited. The method has been described in detail elsewhere (20-23) and will be outlined only briefly here. The algorithm starts with the discrete FT of the acquired data, zero-filled to the size of the desired extrapolation, which shows considerable truncation artifacts. All data outside of a frequency region that is known to contain the band-limited signal are then set to zero; the inverse FT is taken and the data in the sampled interval replaced by the original acquired data. The procedure is then iterated and at each stage the FT of the extrapolated data exhibits reduced truncation artifacts arising from signals within the band-limited signal region. The algorithm is also called the method of alternating projections because it iterates between band-limited and time-limited functions (23).
We consider spectroscopic data acquired in two spatial dimensions, as f(kx,ky,t), and the reconstructed MRSI data as F(x,y,ω). The PG algorithm was performed in both spatial dimensions for the band-limited subcutaneous lipid signal and applied at all frequencies in the spectral dimension. The spatial distribution of the lipid signal was used to define the band-limiting operation, which we refer to as the lipid mask, M(x,y), which has value 1 in locations that contain lipid, and is otherwise 0. The band-limiting operation was therefore performed as a space-limiting operator by setting F(x,y,ω) = 0. for all M(x,y) = 0 and for all ω. Extension to three spatial dimensions is readily obtained and will not be specifically considered here, and the frequency index, ω, is omitted in the following description to simplify the notation. Note that the region defined for the band-limiting operator needs not be contiguous, and any truncation artifacts that may arise from edges within the metabolite region are unaffected by this procedure. Furthermore, although the 3D FT is necessary to obtain M(x,y), in subsequent iterations it is not necessary to perform the FT in the spectral dimension; i.e., operations alternate between the data f(kx, ky,t) and F(x,y,t), with the FT in the spectral dimension performed only at the final iteration, or if M(x,y) is to be recomputed. This permits a reduction in computation time.
The accurate definition of the lipid mask is important. Although high-resolution MRI methods can be used to identify lipid regions, we have chosen to obtain the lipid mask directly from the MRSI data. This avoids registration problems between the MRI and the MRSI, including potential misregistration due to the chemical shift artifact, and does not require an additional data acquisition. To obtain the function M(x,y), a lipid image, L(x,y), was first obiained at the resolution of the extrapolated image, after zero-filled Fourier reconstruction of the acquired MRSI data and spectral integration of F(x,y,ω) at each location. It was necessary to perform spectral integration over a wide spectral region, Δω, which included the lipid resonances though excluded the water region. since BO inhomogeneity and local magnetic susceptibility variations cause a range of lipid resonance frequencies. Although the integration also included signal contributions from metabolites, the result was heavily dominated by lipid. To identify the lipid region a simple threshold operation was applied to the image data, at a level ∊, such that:
| [1] |
PG extrapolation using the same mask was applied at all frequencies in the spectral dimension. Different methods for determining ∊ were evaluated, and are described in the following section.
The PG algorithm was implemented using the IDL programming language (Research Systems Inc., Boulder CO). Typical processing times on a Sun Sparc LX for the 1H MRSI data described below, for a final data size of 64 × 64 × 512 complex points, was approximately 30 min.
Computer Simulation Studies
Using computer simulations, we examined the implementation and performance of the PG algorithm. For these studies, either a 1D profile or 2D image data set was simulated to represent features typical for 1H MRSI data of human brain. This included two distinct object regions: (a) a narrow ring representing intense subcutaneous lipid signal that surrounds (b) a low signal region representing brain metabolite signal contributions. Simulation studies described in the following section examine different methods of obtaining the lipid mask, the optimum criteria to terminate the iteration, and degree of reduction of ringing for different lipid intensities.
Data Acquisition Methods
Multiplane 1H MRSI of the whole head was carried out at 1.5T (Siemens hfagnetom Vision) on four normal subjects. Data were acquired for three planes using circular k-space sampling (6) with a diameter of 36 points, 512 sample points in the spectral dimension, 15-mm slice thickness, and 240-mm field of view. Data sets were acquired with CHESS water suppression (24), at echo times of 50 and 142 ms and with TR = 1800 ms, giving a total measurement time of approximately 30 min. The spectral sweep width was 1000 Hz. Sampling was performed asymmetrically with respect to the echo center, with 22% and 40% of the sampling period occurring before the echo center for TEs of 50 ms and 142 ms, respectively. All studies were performed without any additional lipid suppression beyond that obtained by T2 losses and with no signal averaging. For all studies, a head and neck restraint was used to minimize motion. To further minimize the effect of motion occurring toward the end of the study, the phase-encoding order was chosen to start at the zero encoding value, and proceed with increasing encoding gradient magnitudes for both encoding directions. After acquisition, the MRSI data were zero-filled to a rectangular matrix of 64 × 64 × 512 points, Fourier transformed, and processed by the PG lipid extrapolation routine. A 4-Hz Gaussian line broadening was used in the spectral dimension, and no additional spatial smoothing was used except where indicated for comparison purposes.
RESULTS AND DISCUSSION
Computer Simulation Studies
1D Simulation Example
Figure 1 shows a 1D simulation of a MRSI profile through the head, comparing Fourier reconstruction and the PG extrapolation result with truncated sampling. The ideal profile is shown in Fig. 1a, which represents a high-resolution crossection through a 1H metabolite image of the brain, with the large signals at the edges arising from lipid regions and the center showing the lower brain metabolite signal region with some additional structure. The maximum lipid to metabolite ratio was 25:1. This profile was initially defined with 1024 points and inverse Fourier transformed to the time domain. To generate the truncated time-data for the following simulations only the central 32 data points were retained and either zero-filled or extrapolated to 64 points. To permit evaluation of the extrapolation methods, additional data using twice the number of sample points, i.e., the central 64 data points, was also retained. In all simulations, a symmetrical spatial-frequency (k-space) sampling distribution was assumed, as is typically implemented for 1H MRSI.
FIG. 1.

Comparison of Fourier reconstruction and PG extrapolation for a 1D simulation: (a) ideal high-resolution spatial profile with 1024 frequency-domain points; (b) mask used to identify the band-limited signal regions for extrapolation; (c) FT using 32 sample points zero-filled to 64 points; (d) FT of 64 sample points; (e) PG extrapolation of 32 to 64 points (f-h) same as for (c-e), but with added noise.
Figure 1b shows the lipid mask used for PG extrapolation, obtained from the FT of 32 sample points zero-filled to 64 points (Fig. 1c) and thresholded at 15% of the data maximum. The total width of both band-limited signal regions represents 22.7% of the spectral width. Figure 1d shows the result of the FT for a signal sampled with twice the number of sample points, i.e., 64 points, to enable comparison with the result of PG extrapolation, which is shown in Fig. 1e. This result was obtained after application of the PG algorithm for extrapolation from 32 to 64 points and using 40 iterations. Figures 1f-1h show the corresponding zero-filled, fully sampled, and extrapolated data, in the presence of normally distributed random noise. The maximum SNR for the lipid signal in the frequency domain was 80:1, for the 64-point sampled data shown in Fig. 1g.
Figure 1 illustrates some characteristics of the FT and performance of the PG algorithm. First, the PG extrapolated result (Fig. 1e) shows significant reduction of ringing from the lipid regions, especially outside of the object, and compares favorably with data obtained using twice as many sample points (Fig. 1d). Ringing at internal edges within the metabolite region remains, as well as one or two low-valued points at the lipid-metabolite edge region. In the following evaluation of the PG method, we have therefore not included M/N points at the edges of the central metabolite region, where N is the number of sampled points, and M is the extrapolated data size and is equal to two points in this example. Second, it is well known that with truncated sampling the FT result with zero filling always exhibits Gibbs ringing (Fig. 1c), although without zero filling, ringing is observed only when a frequency is digitized such that the sampled interval is not equal to a multiple of the period of that frequency (25). Similarly, ringing is observed from the edge of a continuous frequency distribution only when the location of that edge results in an asymmetrical signal distribution over a sampled frequency interval (26). This is the case for the profile shown in Fig. 1d, where ringing is evident even in the absence of zero filling. However, in contrast, the extrapolation result (Fig. 1e) shows a profile that exhibits a much-reduced ringing. This result also indicates that the PG procedure does not exactly recover the original signal. Close examination of the time-domain data for simpler examples indicates that the extrapolated result is a good estimation of the original data for only a few time points immediately neighboring the sampled data segment, after which the estimated signal is reduced in intensity and the period may change. The result is that the end data points are always small, and that the first and last data points are close in value (i.e., Data Points 1 and 64 in this case).
A third observation from Fig. 1 is that within the band-limited signal regions, specifically at the top of the lipid sections, the extrapolation result may have worse ringing than the zero-filled FT result. This occurs if the number of iterations is continued beyond that necessary, although it is of no concern for this application. Finally, a comparison of Figs. 1e and 1h shows that, for SNR levels typical for MRSI, the extrapolation procedure is relatively insensitive to noise. This is a consequence of the fact that extrapolation is carried out for the lipid signal only, for which the SNR is very high. An additional observation is that in this example the extrapolated signal (Fig. 1h) was sampled with one half of the data points used for Fig. 1g. with the result that the extrapolated metabolite signal has a SNR which is approximately √2 better than that for the fully sampled data (13). Although this is achieved with a concomitant loss of spatial resolution for the metabolite signal, in this example, the improved SNR in the metabolite region enables better visualization of the signal.
Formation of the Lipid Mask
Several schemes for determining the threshold level, ∊, and generating the lipid mask, M(x,y), were examined using in vivo MRSI data. The performance of each method was evaluated by visual inspection of the resultant metabolite images and verified using 1D simulation with measurement of the residual ringing outside of the lipid region.
The effect of different methods for generating the lipid mask on the outcome of the PG extrapolation is illustrated in Fig. 2, using a 1D simulation. Figures 2a and 2b show the ideal high-resolution profile and the corresponding result obtained with 64 sampled data points and zero-filled FT reconstruction to 128 points. The results of PG extrapolation using a mask that is accurately defined, or that is larger or smaller than the actual signal region, are shown in Figs. 2c-2e, respectively. In these figures, the plot scale has been increased to view the low central signal region, and the lipid mask used in each case is shown below. For these simulations, 40 iterations were used and the mask was kept fixed during all iterations. If the mask is too large (Fig. 2d), the algorithm still provides substantial reduction of ringing outside of the band-limited signal region, though potentially useful data points within the mask region are lost. If the mask is too small (Fig. 2e), the result is clearly incorrect and ringing is enhanced. In defining the lipid mask, it is therefore not necessary to use an exact edge definition, although it is important to bias toward a larger selected region than may be necessary. This is readily achieved by using mild spatial smoothing of the lipid image and a low threshold value; however, care must be taken not to use a threshold value that is too small, such that ringing in nonlipid regions is also included. This case is illustrated in Fig. 2f, where the threshold was set at 5%, resulting in isolated points outside of the lipid region being given value 1 in the mask. After PG extrapolation, the data at these points were incorrectly enhanced.
FIG. 2.

Simulation results illustrating the effect of different lipid masks, showing: (a) the high-resolution profile function; (b) Fourier reconstruction using 64 samples zero-filled to 128; (c-g) PG extrapolation results for different masks. The masks were obtained as: (c) the correct size; (d) too wide; (e) too narrow; (f) obtained using a threshold value that is too low; (g) same as (f), but using the adaptive threshold method described in the text. In each case, the mask is shown in the lower section of the figure.
The following methods for generating the lipid mask were investigated: (a) The threshold value, ∊, was interactively changed and the result viewed, permitting the threshold to be set to the lowest level that did not include any ringing artifact. Typical threshold values were between 15% and 25% of the maximum amplitude. This mask was then used for all iterations. (b) The mask was recomputed at each iteration using a variable threshold level, ∊n, determined as a fixed fraction (e.g., 15%) of the maximum of the integrated lipid image generated from the previous iteration result. (c) At each iteration, the integrated lipid image was regenerated and a new mask obtained using the same threshold data value that was used for the first iteration. (d) The threshold level was adaptively varied at each iteration (20), as described below. (e) The fixed threshold method was applied on a local basis, i.e., different threshold levels could be identified for different regions of the image.
For the adaptive method, the threshold at the nth iteration, ∊n, was changed according to the minimum value of the integrated lipid signal for the current iteration, Ln(x,y), over the region of the previous mask, Mn-1(x,y), i.e.. as:
| [2] |
where Vn = Minimum|Ln(x,y)|, for x,y ∈ Mn-1(x,y) = 1, and μ is a constant between 0.9 and 0.99. For most rapid convergence, the starting threshold level, ∊0, must be close to the value used for the final mask. However, because this is not known a priori, a lower starting threshold level should be assumed. This ensures that all lipid signal locations are contained within the mask, and with each iteration the threshold level may be increased if necessary, according to Eq. [2]. If the starting threshold value is chosen too low such that a few points within the metabolite region are also included, the adaptive method will still converge, provided that the number of incorrect points is small and a sufficient number of iterations are used. This is illustrated in Fig. 2g, where the 5% threshold, also shown in Fig. 2f, was processed using 60 iterations with the adaptive method.
To summarize the findings of the methods investigated: Method (a) involved the least computation requirement and generally performed well, although it required operator input. Method (b) tended to result in a mask which was too small, since each iteration resulted in more signal energy becoming redistributed within the band-limited signal region, increasing the lipid signal and the threshold value and thereby resulting in a decreasing mask size. Method (c) tended to converge to the correct mask, although this could also result in nonlipid features being included if the initial threshold value were not well chosen. Method (d), using the adaptive threshold determination, was the most robust, permitting a wider range of initial threshold values. Finally, it was only found necessary to use the local threshold value of method (e) for data that had a wide range of lipid intensity, including small lipid “hot spots.”
Termination Criteria
The usual criteria for termination of the PG iteration is through measurement of the mean squared energy difference between two successive iterations, measured over the whole data set (18). However, for this application, the result is dominated by the lipid signal which is of less interest, and we have therefore used a modified criterion using the fractional change at each iteration of the nonlipid regions of the image only, as:
| [3] |
where Fn(r,ω) is taken as the nth iteration result, ω runs over the whole spectrum, and the algorithm was terminated when ΔE falls below a predefined value. The integration was therefore performed over all image data except the lipid region, which places greater sensitivity to reducing ringing outside of the band-limited signal regions. The convergence rate of the PG algorithm can be improved by modifying the amplitude of the extrapolated result at each iteration, based on the value of ΔE (21); however, this modification was not included in our implementation. The result of Eq. [3], for increasing the iteration number with two in vivo MRSI data sets, is shown in Fig. 3. Testing for termination at each iteration is computationally relatively costly, and we found it reasonable to perform 20 iterations before performing the test. For most applications, the maximum iteration number was limited to 60, because little visible improvement was found beyond this point. For the results shown in the following figures, the algorithm was terminated when ΔE was less than 3 × 10⁻³.
FIG. 3.
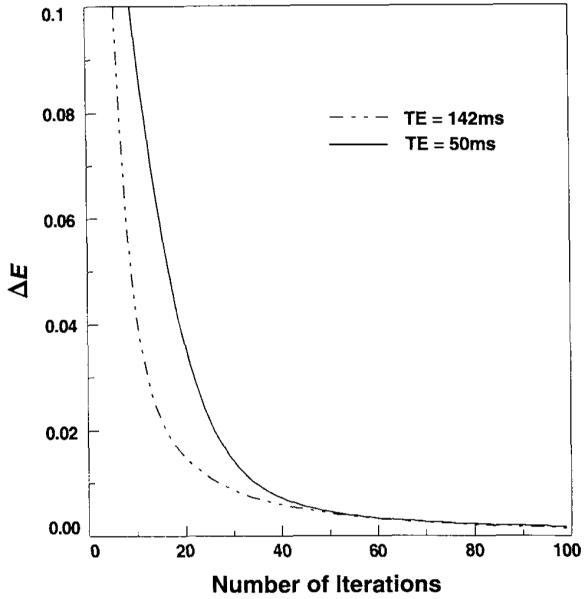
Energy difference, ΔE, as shown in Eq. [3], used to test for termination of the algorithm plotted against increasing number of iterations for two in vivo MRSI data sets, obtained at 50 ms (solid line) and 142 ms (dashed line).
Performance Limits
It is of interest to compare performance of the extrapolation approach with the hypothetical ideal lipid-suppression method, i.e., one that provides total suppression of subcutaneous lipid without spectral distortion in neighboring brain regions. To this aim, we have examined the range of lipid to metabolite intensity ratio where the reduction of truncation artifact using PG extrapolation is effective and, secondly, the additional sensitivity of the extrapolation approach to movement of the subject.
Figure 4 shows a comparison of the maximum error in the amplitude of the central region of the simulated 1D lipid and metabolite profile for the zero-filled FT reconstruction and the PG-extrapolated result with increasing lipid iniensity. The simulated profile was similar to that used for Fig. 1 and consisted of two “lipid” regions, of value ILip, and a central “metabolite” region of value Imet. The two lipid regions occupied 25% of the spectral width. The number of sampled points was 32, with zero filling or extrapolation to 64 points, and the PG extrapolation was terminated at 40 iterations. The ordinate shows the relative maximum of the absolute difference for each result from the ideal metabolite data value, i.e.,
| [4] |
where F is the resultant data value, S is the true data value, and the location x’ is defined for the central metabolite region only. For this test, two points at each edge of the metabolite region were excluded from x’ to avoid the known errors in this region. Figure 4 shows that, for metabolite-to-lipid intensity ratios of greater than 1:6, the PG algorithm increases errors in comparison with the zero-filled FT. This is to be expected, since as the band-limited signal requirement is clearly no longer satisfied. For very low metabolite-to-lipid ratios, the band-limited nature of the signal is clearly satisfied and a large degree of reduction in the truncation artifact is achieved; however, with larger lipid intensities, the small amount of residual ringing remaining after PG extrapolation becomes significant relative to the small metabolite intensity. For this study, the maximum value of the residual ringing becomes equal to the metabolite intensity at a ratio of approximately 1:160.
FIG. 4.
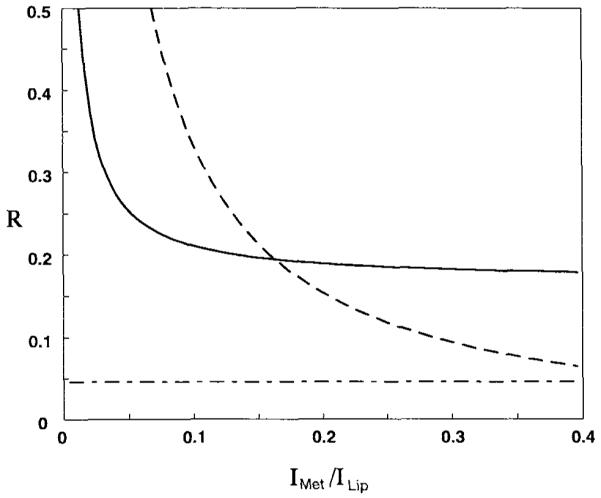
Maximum relative amplitude error, R, in the central region of a simulated 1D profile across the brain plotted against the ratio of the metabolite signal amplitude,Imet, to the lipid amplitude, Ilip, for a zero-filled Fourier reconstruction (dotted line) and PG extrapolation (solid line). The horizontal dashed lined represents the same error measurement for Fourier reconstruction of the central metabolite region only, in the absence of any lipid signal.
Figure 4 also shows a horizontal line that represents the relative amplitude error, over the region described by x’, for the case of a zero-filled FT of the metabolite region only; i.e., this represents the ideal experimental acquisition where the lipid signal is totally suppressed. It can be seen that the PG algorithm never achieves a level of performance equivalent to reducing ringing to the level that would be obtained for the metabolite only. However, it should be kept in mind that this previous statement does not take into account the additional discrimination of lipid and metabolite resonances possible in the spectral domain. This level of lipid contamination should be well tolerated by parametric spectral analysis methods, which allow for separation of narrow resonances super-imposed on a smoothly varying baseline (27).
Effect of Subject Movement
One expected limitation of 1H MRSI without suppression of lipid signals before data acquisition is increased susceptibility to movement artifacts arising from the intense lipid signal region. An additional concern is that the subsequent application of the PG algorithm may cause additional image artifacts, further exacerbating the effects of motion. To examine the effect of motion, a computer simulation was carried out for a 2D object that moved during the phase encoding. The simulated object consisted of a bright ring representing the intense lipid signal of amplitude 15 times larger than a central signal region representing brain metabolites, and the simulated k-space data were generated for 32 × 32 spatial-frequency sample points. This was repeated for a stationary object and for several examples of a single movement occurring at different points during the simulated k-space acquisition sequence. The k-space extrapolation was then carried out as previously described, and the resultant images were viewed for effects of motion. For comparison, the simulation was repeated using an object function where the lipid ring had a lower amplitude, equal to the metabolite region, and was then subjected to the same motion.
To summarize the results of this study, artifacts were evident in all cases of simulated object motion with increased amplitude of artifacts when the stronger lipid signal was present; however, the PG extrapolation procedure still achieves considerable reduction of truncation artifact, and no evidence of additional artifacts was observed.
Experimental Results
Figures 5-7 show results for 1H MRSI data acquired at TE = 50 ms. Figure 5 shows the N-acetylaspartate (NAA) metabolite image, generated by spectral integration of the magnitude data over a frequency band of 0.2 ppm, which covered the full extent of the NAA resonance across the data set. No additional baseline correction or spectral line fitting has been used. Figures 5a and 5b show the conventional zero-filled Fourier reconstruction and the result after PG extrapolation of the lipid region. For these images, the scaling factor used on image display has been increased to enable observation of the brain signal while saturating the lipid signal region. A dramatic reduction in ringing from the lipid region can be seen in Fig. 5b, after PG extrapolation. An additional observation is a dark ring at the inner edge of the lipid region. Although this structure corresponds to a region including cerebral spinal fluid and bone that do not contain NAA, it is likely that this feature is artifactually enhanced by the residual ringing after PG extrapolation, as observed with the simulation result of Fig. 1e. The darker region seen in the prefrontal region of the brain is caused by signal loss due to susceptibility-induced magnetic field distortion commonly observed in this region. For comparison, the T2- weighted MRI corresponding to the center of the thicker slice used for MRSI is shown in Fig. 5c.
FIG. 5.

(a-c) NAA images from human brain, for TE = 50 ms: (a) zero-filled Fourier reconstruction; (b) after PG extrapolation of the lipid region; (c) MRI (2500/80) corresponding to the center of the metabolite image slice; (d) NAA image after PG extrapolation and spectral baseline fit-and-subtract procedure; (e) spatially smoothed version of the zero-filled reconstruction (a); (f) spatially smoothed version of the PG extrapolation result (b), after removal of sianals contained within the region of the lipid mask.
FIG. 7.

Representative spectra selected from two voxels in the temporo-parietal cortical region: (a, b) spectra obtained after zero-filled FT; (c, d) the corresponding spectra after PG extrapolation.
As previously shown, the PG extrapolation does not achieve total suppression of lipid ringing within the metabolite region. However, the characteristics of the residual lipid signals are such that they appear in tho spectral dimension as broad, slowly varying signal contributions, which enables them to be separated from the narrower metabolite resonances and removed. This same procedure is frequently necessary to remove additional baseline contributions from residual water and macromolecular resonances at shorter TE values. We have examined the use of a simple baseline fit and subtract routine applied to the k-space extrapolated MRSI data, from which the NAA image is shown in Fig. 5b, and the result is shown in Fig. 5d. A least-squares cubic spline fit was used to automatically fit the slowly varying spectral signal components of both real and imaginary components. Data points from regions including the NAA, creatine, and choline resonances were excluded during the fit, and a variable knot placement with greater density over the region from approximately 2.2 to 0.5 ppm was used. This method permitted more accurate fitting of contaminating lipid signals, where rapid variation of resonance amplitudes with frequency are commonly found. The baseline fit was performed for all spectra in the MRSI data set, and the fit result was subtracted from the data. In addition, regions of strong lipid signal were set to zero. Figure 5d indicates that some further improvement of image quality can be obtained; however, the automated baseline subtraction method used in this example is considered to be suboptimal. A further improvement in image quality should be possible using image formation after parametric spectral analysis that incorporates a flexible baseline model (27).
For correct implementation of this k-space extrapolation algorithm, no spatial smoothing can be applied before application of the PG extrapolation. Smoothing may be applied after lipid k-space extrapolation; however, it should be kept in mind that the k-space data describing each of the lipid and metabolite signal contributions extend over different regions. Because the lipid region is clearly identified, different operations may readily be performed to the lipid and the metabolite image regions. Figures 5e and 5f compare smoothing of the zcro-filled Fourier reconstruction result and after PG extrapolation. In both cases, smoothing was performed in the k-space domain, using a Gaussian k-space weighting function with weight equal to 0.4 at the diameter of the acquired k-space data. Figure 5e shows the smoothed zero-filled NAA image, corresponding to Fig. 5a. Although ringing from the lipid region is reduced, it is still present and information in the cortical surface regions is obscured. Figure 5f shows the smoothed NAA image obtained after PG extrapolation (Fig. 5b) and removal of the lipid by setting to zero all image data values where M(x,y) > 0. Information at the cortical surface is largely retained.
Figures 6a and 6b show stackplots of spectra selected from the same data as shown in Figs. 5a and 5b. Spectra are shown for all voxels along Row 32, running across the center of the head. Several spectra from the start of the plot, corresponding to the left hand side of Fig. 5 and including the initial lipid region, have been omitted to view spectra across the brain that would otherwise be obscured by the intense lipid signals. A reduction in lipid ringing is clearly evident with the PG extrapolation result. In addition, the signal energy in the lipid region is more concentrated, as indicated by a more intense and narrower lipid region.
FIG. 6.

Stackplot of spectra from voxels across the head, selected from Row 32 of the same data shown in Fig. 5. Spectra from 16 voxels at the front of the plot are omitted to permit observation of signals in the brain region. Data are shown for: (a) zero-filled Fourier reconstruction, (b) after PG extrapolation.
To better evaluate the improvement in the resultant data, spectra from two voxels selected from the temporo-parietal cortical region are shown in Fig. 7. The relative reduction of the integrated lipid resonance in the frequency range of 2.5 ppm to 1.0 ppm was approximately 85% for Fig. 7a and 76% for Fig. 7b. A final observation of the data shown in Figs. 6 and 7 is that the contaminating lipid resonances in the brain are seen to be rapidly changing in both the spectral and spatial dimensions. This is a consequence of the multiple spatial and spectral sources of interfering lipid that appear with varying phase throughout the field of view, resulting in constructive and destructive interference. This characteristic makes operations such as parametric spectral analysis or subtraction of unwanted baseline resonances extremely problematic unless the lipid signal is reduced before applying these procedures.
Figure 5 shows only the NAA image obtained at TE = 50 ms; however, additional results obtained for images of the creatine and choline spectral regions and for MRSI data obtained at TE = 142 ms, where the lipid contamination is less severe, also demonstrate improved image quality after lipid k-space extrapolation. Among the 1H MRSI data sets acquired in this study, a considerable variation of lipid amplitudes has been observed. For two of these studies, with TE = 50 and 142 ms, we have measured ratios of the average lipid amplitude to the average NAA signal level to be 90:1 and 40:1, respectively. Taking the peak amplitude of the lipid, these ratios increase to 135:l and 95:1, respectively. A preliminary MRSI study has also been carried out for TE = 20 ms, which showed inadequate quality of the final metabolite images after PG extrapolation, despite a large reduction in lipid ringing having been achieved. However, for these data, the lipid-to-NAA amplitude ratio was over 600:1, which clearly exceeds the range over which reasonable performance of the PG extrapolation algorithm is to be expected. An additional concern for short TE data such as these is that the final quality of the metabolite images may also be affected by receiver dynamic-range limitations.
CONCLUSIONS
Proton metabolic imaging of human cortex potentially offers considerable clinical information; however, observation near the brain surface has previously required additional experimental methods to overcome excessive signal contamination from subcutaneous lipid. We have demonstrated that the use of a simple postprocessing technique permits a significant reduction of this lipid signal contamination, and when used together with optimized acquisition methods, i.e., using circular k-space and an increased number of k-space points, these methods permit 1H metabolite imaging of the cortex at moderate TE values. The PG extrapolation method can be readily implemented in a fully automated and reliable manner, with knowledge of the spatial distribution of the lipid resonance obtained from the MRSI data themselves.
Results indicate that the PG method is effective for a wide range of lipid-to-metabolite ratios. For clinical studies, the quality of metabolite images after lipid extrapolation will be subject to additional concerns. Most notably, when intense lipid signals are present, the result becomes increasingly sensitive to motion, indicating that additional measures to limit subject motion, or to correct for their effects, may be necessary. We therefore conclude that, for TE values of 50 ms or less, as well as in individual subjects with large subcutaneous lipid regions, additional lipid reduction may be required before signal detection. For this purpose, localized reduction of lipid may be sufficient; e.g., in many subjects, we have observed that the most intense lipid signals are found in frontal and posterior regions. Lipid suppression applied in these regions may be sufficient to enable short TE MRSI of cortical regions elsewhere.
Simulation studies indicate that the reduction of truncation artifact achievable using PG extrapolation can never match the ideal situation where the complete brain MRSI data are acquired without any lipid signal whatso-ever: for 1H MRSI of internal brain regions, the use of experimental methods to eliminate subcutaneous lipid signals before signal acquisition may be more suitable. However, in the choice of technique, additional considerations include potential errors and signal losses introduced by the lipid suppression technique. The most visible reduction in ringing artifact is clearly produced where the lipid signal is strongest, which for in vivo MRSI is of particular interest for detection of the doublet of lactate centered at 1.3 ppm. For analysis of lactate distributions using the methods described here, or indeed with almost any MRSI method, additional spectral discrimination will still be necessary to separate any residual lipid contamination from the lactate doublet, e.g., by using suitable parametric modeling methods (27). Although metabolite resonances in the range of 2.0 to 4.0 ppm. including NAA, creatine, and choline, normally overlap to a much lesser extent with lipid resonances, the B0 field variation normally encountered in the head results in significant overlap of lipid signals also occurring in this spectral region. Substantial improvement of the quality of NAA images has been demonstratpd, and we also observe smaller improvement for metabolite images of creatine and choline.
It should be noted that the PG method always maintains the original acquired data. Therefore, any lipid signals arising from within the brain will be unaffected by the PG extrapolation procedure, with the exception of having reduced contamination from subcutaneous lipid signal contributions. Similarly, no improvement in the spatial resolution of the metabolite signals is obtained. However, this method can be combined with other post-processing approaches. For example, iterative smoothing methods (13, 28) can be applied to enhance edges of the metabolite region. The implementation of these methods will be greatly facilitated by prior removal of thr intense lipid ringing.
Acknowledgments
This work was supported by Public Health Service Grants CA48815 and AG10897.
REFERENCES
- 1.Brown TR, Kincaid BM, Ugurbil K. NMR chemical shift imaging in three dimensions. Proc. Natl. Acad. Sci. U S A. 1982;79:3523–3526. doi: 10.1073/pnas.79.11.3523. [DOI] [PMC free article] [PubMed] [Google Scholar]
- 2.Maudsley AA, Hilal SK, Perman WH, Simon HE. Spatially resolved high-resolution spectroscopy by four-dimensional NMR. J. Magn. Reson. 1983;51:147–152. [Google Scholar]
- 3.Mareci TH, Brooker HR. High-resolution magnetic resonance spectra from a sensitive region defined with pulsed field gradients. J. Magn. Reson. 1984;57:157. [Google Scholar]
- 4.Ehrhardt JC. MR data acquisition and reconstruction using efficient sampling schemes. IEEE Trans. Med. Imaging. 1990;9:305–309. doi: 10.1109/42.57768. [DOI] [PubMed] [Google Scholar]
- 5.Schuff N, Ehrhardt JC, Weiner MW. Efficient data acquisition for 2D spectroscopic imaging using hexagonal k-space sampling; Proc., SMR, 2nd Annual Meeting; San Francisco. 1994.p. 1117. [Google Scholar]
- 6.Maudsley AA, Matson GB, Hugg JW, Weiner MW. Reduced phase-encoding in spectroscopic imaging. Magn. Reson. Med. 1994;31:645–fi51. doi: 10.1002/mrm.1910310610. [DOI] [PubMed] [Google Scholar]
- 7.Campbell ID, Dobson CM, Williams RJP, Wright PE. Pulse methods for the simplification of protein NMR spectra. FEBS Lett. 1975;57:96–99. doi: 10.1016/0014-5793(75)80160-8. [DOI] [PubMed] [Google Scholar]
- 8.Luyten PR, Marien AJH, Heindel W, et al. Metabolic imaging of patients with intercranial tumors: H-1 MR spectroscopic imaging and PET. Radiology. 1990;176:791–799. doi: 10.1148/radiology.176.3.2389038. [DOI] [PubMed] [Google Scholar]
- 9.Duijn JH, Matson GB, Maudsley AA, Weiner MW. 3D phase-encoding 1H spectroscopic imaging of human brain. Magn. Reson. Imaging. 1992;10:315–319. doi: 10.1016/0730-725x(92)90490-q. [DOI] [PubMed] [Google Scholar]
- 10.Spielman DM, Pauly JM, Macovski A, Glover GH, Enzmann DR. Lipid suppressed single and multisection 1H SI of human brain. J. Magn. Reson. Imaging. 1992;2:253–262. doi: 10.1002/jmri.1880020302. [DOI] [PubMed] [Google Scholar]
- 11.de Beer R, van den Boogaart A, van Ormondt D, Pijnappel WWF, den Hollander JA, Marien AJH, Luyten PR. Application of time domain fitting in the quantification of in vivo 1H spectroscopic imaging data sets. NMR Biomed. 1992;5:171–178. doi: 10.1002/nbm.1940050403. [DOI] [PubMed] [Google Scholar]
- 12.Kay SM, Marple SL. Spectrum Analysis: A modern perspective. (Review article) Proc. IEEE. 1981;69:1380–1419. [Google Scholar]
- 13.Liang Z-P, Boada FE, Constable RT, Haake EM, Lauterbur PC, Smith MR. Constrained reconstruction methods in MR imaging. Rev. Magn. Reson. Med. 1992;4:67–186. [Google Scholar]
- 14.Plevritis SK, Macovski A. Spectral extrapolation of spatially bounded images. IEEE Trans. Med. Imaging. 1995;14:487–497. doi: 10.1109/42.414614. [DOI] [PubMed] [Google Scholar]
- 15.Patel MS, Hu X. Selective data extrapolation for chemical shift imaging; Proc., SMR, 2nd Annual Meeting; 1994.p. 1168. [Google Scholar]
- 16.Hu X, Patel M, Ugurbil K. A new strategy for spectroscopic imaging. J. Magn. Reson. B. 1994;103:30–38. doi: 10.1006/jmrb.1994.1004. [DOI] [PubMed] [Google Scholar]
- 17.Hu X, Patel M, Chen W, Ugurbil K. Reduction of truncation artifacts in chemical-shift imaging by extended sampling using variable repetition time. J. Magn. Reson. 1995;B 106:292–296. doi: 10.1006/jmrb.1995.1047. [DOI] [PubMed] [Google Scholar]
- 18.Papoulis A. A new algorithm in spectral analysis and band-limited extrapolation. IEEE Trans. Circuits Syst. 1975;CAS-22:735–742. [Google Scholar]
- 19.Gerchberg RW. Super-resolution through error energy reduction. Optica Acta. 1974;21:709–720. [Google Scholar]
- 20.Papoulis A, Chamzas CC. Detection of hidden periodicities by adaptive extrapolation. IEEE Trans. Acoust. Speech Signal Processing. 1979;27:492–500. [Google Scholar]
- 21.Chamzas CC, Xu WY. An improved version of Papoulis-Gerchberg algorithm on band-limited extrapolation. IEEE Trans. Acoust. Speech Signal Processing. 1984;31:437–440. [Google Scholar]
- 22.Ferreira PJSG. Interpolation and the discrete Papoulis-Gerchberg algorithm. IEEE Trans. Signal Processing. 1994;42:2596–2606. [Google Scholar]
- 23.Jain AK. Fundamentals of Digital Image Processing. Prentice Hall; Englewood Cliffs, NJ: 1988. [Google Scholar]
- 24.Haase A, Frahm J, Hanicke W, Matthaei D. 1H NMR chemical shift selective (CHESS) imaging. Phys. Med. Biol. 1985;30:341–344. doi: 10.1088/0031-9155/30/4/008. [DOI] [PubMed] [Google Scholar]
- 25.Brigham EO. The Fast Fourier Transform and its Applications. Prentice-Hall, Inc.; Engelwood Cliffs, NJ: 1988. [Google Scholar]
- 26.Koch T, Brix G, Lorenz WJ. Theoretical description, measurement, and correction of localization errors in 31P chemical-shift imaging. J. Magn. Reson. B. 1994;104:199–211. [Google Scholar]
- 27.Provencher SW. Estimation of metabolite concentrations from localized in vivo proton NMR spectra. Magn. Reson. Med. 1993;30:672–679. doi: 10.1002/mrm.1910300604. [DOI] [PubMed] [Google Scholar]
- 28.Constable RT, Henkelman RM. Data extrapolation for truncation artifact removal. Magn. Reson. Med. 1991;17:108–118. doi: 10.1002/mrm.1910170115. [DOI] [PubMed] [Google Scholar]