

Abstract
The ultimate goal of phagosomal maturation is the delivery of internalized, particulate cargo to acidic, hydrolytically-competent compartments capable of mediating its degradation. Here we outline in detail three fluorometric techniques that allow the study of phagosomal maturation in macrophages by quantifying functionally important features of the lumenal environment of the developing phagosome in real time. The first assay utilizes a particle-restricted, pH-sensitive fluorochrome to measure the acidification of the phagosome. The second reports on the development of the proteolytic capacity of the phagosome by following the hydrolysis of a fluorogenic, generic proteinase substrate. The third quantifies the accumulation of lysosomal constituents within the phagosome by measuring the FRET efficiency between a particle-restricted, donor fluor and a fluid phase acceptor fluor that had been chased previously into lysosomes. The assays are described as population-based methodologies utilizing a spectrofluorometer, though alternatively, can be adapted readily to confocal-based technologies for single phagosomal measurements.
Keywords: phagosome, lysosome, phagocytosis, macrophage, pH, proteolysis, lumen
1. Introduction
The phagosome is an exquisitely dynamic organelle. Whilst traditional, static techniques have led to much of today’s knowledge of the phagosome, real-time fluorescent approaches are necessary for the kinetic analysis of phagosomal development. The majority of the more recent techniques focus on changes to the cytoplasmic aspect of the phagosome, concentrating on regulatory or signaling components. In contrast, techniques that report on the dynamics of the lumenal environment remain scarce. This chapter focuses on three, real-time, fluorometric techniques that quantify the development of functionally-relevant aspects of phagosomal lumenal biology, namely pH, proteolytic capacity and relative acquisition of lysosomal cargo. These assays give the investigator three distinct yet interdependent parameters which proceed with different kinetics, that collectively document the maturation of the lumenal aspect of the phagosome.
Lumenal acidification occurs within seconds of phagosomal formation principally via recruitment and activity of vacuolar-ATPases (V-ATPases) (1, 2). Typically, within 15-30 minutes, the phagosome reaches and maintains a lumenal pH between 4.5 and 5 (3). This rapid and complete acidification is an important early feature of the phagosome and directly influences its enzymatic activites and physical properties (4). The pH-sensitive fluorochromes carboxyfluorescein and Oregon green have both been utilized by a number of investigators to measure pH of various subcellular compartments (1, 2, 5, 6). The fluorescent emission from carboxyfluorescein and Oregon green are differentially affected by changes in pH, varying with the wavelength of excitation. In particular, fluorescent emission of carboxyfluorescein at 520 nm is more sensitive to decreasing pH when excited at 490 nm than it is at 450 nm. This allows the excitation ratio to be used as an internally-controlled value that reports on the pH of the environment immediately surrounding the fluorophore. This value can be converted to pH with polynomial regression to a standard curve. Here we outline the measurement of phagosomal pH in macrophages using carboxyfluorescein covalently coupled to experimental particles.
The phagosome of the macrophage is adept at degrading most biological macromolecules, this process being central to its function. In particular, a large proportion of the hydrolytic machinery is dedicated to the hydrolysis of protein (7). The development of the proteolytic capacity of the phagosome is multifactorial, requiring delivery and activation of proteases such as the cathepsins, and an acidic pH (4). In this chapter we describe an assay that measures the bulk proteolytic activity of the maturing phagosome, utilizing particle-associated albumin labeled heavily with a self-quenching fluor. Following phagocytosis, proteolysis results in the dequenching of the substrate’s fluor relative to a calibration fluorochrome on the particle. The rate of change of the ratio of the two fluorescent intensities is indicative of the bulk proteolytic capacity of the phagosomal lumen.
Finally, it is accepted generally that the maturation of a phagosome is more intricate than the single fusion event with one lysosome. Rather, the phagosome progressively accumulates membranous and lumenal components of the late endosomes and lysosomes through multiple fusion events (8). Yet many investigators use phagosomal-lysosomal (P-L) fusion as an indicator of phagosomal maturation by counting phagosomes that are deemed “fused” with a lysosome, implying a single, absolute, fusion event. In essence, they are counting the number of phagosomes that have accrued sufficient lysosomal reporter exceeding a threshold imposed by the sensitivity of the apparatus or, most frequently, the human eye. The assay outlined in this chapter quantifies the accumulation of preformed lysosomal constituents within the maturing phagosome in real-time by exploiting fluorescence resonance energy transfer (FRET) between an acceptor fluor that has been chased into lysosomes and a particle restricted donor fluor. The profiles generated report on the kinetics and extent of lysosomal contribution to the phagosomal content.
The particular methodologies outlined in this chapter are described as population-based assays with measurements taken from an area of a monolayer containing up to 4 × 10⁴ macrophages. Population-based methodologies offer a number of advantages over single cell techniques: they require comparatively basic instrumentation and technical expertise; there is a reduced need for qualitative assessment hence reducing user bias; and as phagosomal populations are relatively heterogeneous (9, 10), measurements taken over a large population are often statistically sound, thus offering the investigator the opportunity to more confidently test numerous variables in a relatively short period. Population based assays however, do not necessarily obviate the need for single cell measurements. As an alternative, the techniques outlined in this chapter can be readily applied to a single cell format, although the confocal instrument required has to be capable of performing spectral separation for the FRET assays.
2. Materials
2.1 Cells, reagents and buffers
Macrophages: Both bone-marrow derived murine macrophages (BMMØ) and macrophage-like cell lines have been used (see Note 1). BMMØ’s are derived from the bone marrow extracted from the femurs, tibias and iliums of euthanized mice and maintained in Dulbecco’s modified Eagle’s medium (DMEM) (Gibco, Grand Island, NY, USA) supplemented with 10% fetal bovine serum (FBS), 5% horse serum, 2 mM L-glutamine, 1 mM sodium pyruvate and 20% L-cell conditioned media (BMMØ media). RAW 264.7 cells (available from the American Type Culture Collection, Rockville, MD, USA) are maintained in DMEM supplemented with 10% FBS and 1.5 g/ml sodium bicarbonate.
Cover slips: Clean 0.13 × 12.5 × 25 mm cover glass (see Note 2). Sterilize by autoclave.
Binding buffer: Tissue culture tested PBS pH 7.2 (Gibco, Grand Island, NY, USA) adjusted to contain 1 mM CaCl2, 2.7 mM KCl, 0.5 mM MgCl2, 5 mM dextrose, 10 mM HEPES and 5 % FBS.
Cuvette buffer: Tissue culture tested PBS pH 7.2 (Gibco, Grand Island, NY, USA) adjusted to contain 1 mM CaCl2, 2.7 mM KCl, 0.5 mM MgCl2, 5 mM dextrose, 10 mM HEPES and 0.1 % calf skin gelatin (see Note 3).
Binding dish: A microbiological Petri dish containing a square piece of parafilm adhered to the lower plate surrounded by a damp Kimwipe® tissue.
0.4 % trypan blue (Gibo, Grand Island, NY, USA).
Experimental particles: 3.0 μm carboxylate-modified silica particles (Si-COOH) 5 % suspension (Kisker Biotech, Steinfurt, Germany) (see Note 4).
Amine reactive fluorescent reagents: 5-(and-6)-carboxyfluorescein, succinimidyl ester (mixed isomers) (CF-SE); Alexa Fluor 488® carboxylic acid, succinimidyl ester (mixed isomers) (Alexa488-SE); Alexa Fluor 594® carboxylic acid, succinimidyl ester (mixed isomers) (Alexa594-SE) (Molecular Probes, Eugene, OR, USA). Dissolve in high quality anhydrous dimethylsulfoxide (DMSO) (Sigma Sigma, St Louis, MO, USA) at 5 mg/ml before use. Stock solutions can be aliquoted and stored at -20°C. Protect reagents from light and moisture.
DQ green bodipy BSA (DQ-BSA) (Molecular Probes, Eugene, OR, USA). Store as desiccate at -20 °C until use. Protect from light.
Alexa Fluor® 594 hydrazide, sodium salt (Alexa594-HA) (Molecular Probes, Eugene, OR, USA). Dissolve in tissue-culture grade PBS pH 7.2 at 1 mg/ml. Store at -20 °C. Protect from light.
Cyanamide (Sigma, St Louis, MO, USA). Store as desiccate at 4 °C.
Coupling Buffer: 0.1 M sodium borate (Sigma, St Louis, MO, USA) in ddH2O. Adjust pH to 8.0 with 10 M NaOH. Filter sterilize through 0.22 μm filter.
Quenching Buffer: 250 mM glycine (Sigma, St Louis, MO, USA) in PBS pH 7.2. Filter sterilize through 0.22 μm filter.
Defatted bovine serum albumin (Sigma, St Louis, MO, USA).
α-D-mannosylated-PITC-albumin (Sigma St Louis, MO, USA).
Sodium azide 2 % aqueous solution. Very toxic.
Reference pH buffers (pH 4-5.5): 0.15 M potassium acetate. Adjust pH to 4.0, 4.5, 5.0 and 5.5 with 10 M NaOH.
Reference pH buffers (pH 6-7.5): 0.1 M PIPES, 0.1 M KCl. Adjust pH to 6.0, 6.5, 7.0, 7.5 and 8.0 with 5 M HCl.
2.2 Instruments
Temperature controlled spectrofluorometer with variable excitation and emission monochromators. The authors use the QMSE4 model spectrofluorometer from Photon Technologies International (Lawrenceville, NJ, USA) equipped with a thermostat-controlled 4 chambered turret for simultaneous measurement of 4 experimental variables. The QMSE4 is interfaced with a PC compatible computer and is managed by Felix32 software (Photon Technologies International, Lawrenceville, NJ, USA).
Quartz 10×10×45 mm cuvettes (Fisher Scientific, Pittsburgh, PA, USA).
Fluorescent microscope with standard FITC and Texas Red filter sets. The authors use the Zeiss Axioskop 2 plus (Carl Zeiss MicroImaging Inc., Thornwood, NY, USA).
3. Methods
3.1 Macrophage monolayer preparation and handling
Fully differentiated BMMØ monolayers are grown to confluency in untreated Petri dishes. Growth media is removed and replaced with cold PBS pH7.2 (without Ca2+ and Mg2+) and incubated at 4 °C for 10 minutes to facilitate BMMØ detachment from the plastic. BMMØ’s are then gently dislodged with a rubber policeman and centrifuged at 230 g at 4 °C for 10 minutes.
Sterile, clean 12.5×25 mm cover slips are placed in a sterile Petri dish using fine-point forceps that have been dipped in 70 % ethanol and flamed (see Note 5).
BMMØ’s are gently resuspended in 1 ml BMMØ media, counted using a hemocytometer and diluted appropriately in BMMØ media to achieve ~1.25 × 10⁶ macrophages/ml.
10 ml of BMMØ suspension is added to the Petri dish and incubated at 37 °C for 24 hours to allow a monolayer to establish on the cover slips. Care should be exercised to prevent excessive movement of the cover slips in the Petri dish. The BMMØ-monolayer covered cover slips (subsequently referred to as monolayers) are then ready for fluorometric analysis.
3.2 Spectrofluorometer setup and operation
The spectrofluorometer should be set up according to manufacturer’s directions such that optimal measurements can be taken using the desired wavelengths (see Note 6).
Clean quartz cuvettes containing cuvette buffer are inserted into a thermostat-controlled sample holder and warmed to 37 °C prior to the loading of the monolayers (see Note 7).
Using fine-point forceps, a monolayer-covered cover slip is grasped at one end (see Note 8) and dipped 10 times into a sterile 50 ml tube containing binding buffer to remove BMMØ growth media and loosely adhered cells. The cover slip is then placed in the cuvette with a vertical orientation (length of the cover slip parallel to the long axis of the cuvette), on the diagonal (width of the cover slip at 45° to the short axes of the cuvette) and with the cellular side facing the emission slit, as shown in Fig. 1.
At this point, sufficient background measurements of each monolayer are recorded for the wavelengths required.
At the conclusion of the background determination, the cover slips are carefully removed from the cuvettes using forceps and placed with the cellular side up, on the parafilm within the binding dish.
85 μl of a suspension of the appropriate experimental particles is carefully laid over each monolayer. The meniscus should be maintained over the cover slip at room temperature for 3 minutes (see Note 9).
The cover slips are once again dipped 10 times in binding buffer to remove unbound particles and are placed in the cuvettes with the same orientation.
The appropriate successive fluorescent measurements are recorded, alternating between each sample.
At the conclusion of the assay, the cover slips are removed by forceps and placed cellular side down onto 30 μl of 0.4 % trypan blue on a glass slide and examined with bright-field and fluorescence microscopy. Careful attention should be paid to macrophage viability, optimal bead to BMMØ ratio and the presence of extracellular beads. This is an extremely important control and must be completed with every sample. Data should be disregarded should there be an increase in macrophage viability, overloaded macrophages or the presence of any extracellular particles.
Fig. 1.

Orientation of the BMMØ monolayer in the spectrofluorometer. Cover glass is oriented to achieve a 45° incidence with the excitation beam (excitation λ), and with the cells facing the emission slit.
3.3. Kinetic analysis of phagosomal pH
3.3.1. Preparation of pH-sensitive particles
50 mg of carboxylate-modified silica particles are washed three times in 1ml of PBS by brief vortexing and centrifugation in a tabletop microfuge at 2000 g for 60 seconds.
Particles are resuspended in PBS (pH 7.2) with 25 mg/ml of the heterobifunctional crosslinker cyanamide (freshly made) and incubated at room temperature with agitation for 15 minutes. Excess cyanamide is removed by washing the particles twice with coupling buffer.
Particles are resuspended in 1 ml of coupling buffer with 5 mg of defatted BSA and 1 mg of α-D-mannosylated-PITC-albumin, and incubated with agitation for 6 hours. This step covalently attaches the albumin to the particles through the cyanamide crosslinker. The BSA generally serves as a coupler itself for further derivation with carboxyfluorescein-SE whist also serving to coat the electrostatic surface of the particle with protein. The α-D-mannosylated-PITC-albumin serves as an opsonic ligand for the mannose receptor. We have previously shown that the phagocytosis of particles coated in this way is primarily directed through the mannose receptor (3) (see Note 10).
Particles are washed twice with quenching buffer to quench unreacted cyanamide and twice with coupling buffer to remove soluble amine groups.
The particles are resuspended in 1 ml of coupling buffer, and 10 μl of the 5 mg/ml stock of carboxyfluorescein-SE in DMSO is added (see Note 11). Incubation at room temperature with agitation for 1 hour allows the particle-bound albumin to be sufficiently labeled with the amine-reactive fluor.
The now fluorescent particles are washed three times with quenching buffer and finally resuspended in 1 ml PBS (see Note 12). 10 μl of 2 % solution of the preservative sodium azide can be added for storage at 4 °C.
3.3.2. Measurement of phagosomal excitation ratios
30 μl of stock carboxyfluorescein, mannosylated particles (CF-beads) are washed twice with 1 ml sterile PBS to remove traces of sodium azide.
The CF-beads are resuspended in an appropriate volume of binding buffer to achieve ~ 1 ×10⁷ beads/ml (see Note 13).
After 450∣520 nm and 490∣520 nm (excitation λ ∣ emission λ) background measurements are recorded for BMMØ monolayers alone, 85μl of the diluted CF-beads is laid onto the monolayers in the binding dish and incubated at room temperature for 3 minutes (as per section 3.2).
The monolayers are dipped in binding buffer to remove unbound CF-beads, and returned to the spectrofluorometer.
Emission at 520 nm is recorded with excitation alternating between 450 nm and 490 nm. Typically an integration time of 1 second per data point is optimal. Data is collected for at least 30 minutes to follow the complete acidification of the phagosomal lumenal space.
At the conclusion of the assay, the monolayers are examined via microscopy with trypan blue (as per section 3.2).
3.3.3. Conversion of excitation ratio to pH
50 μl of CF-bead stock is washed twice in ddH2O and resuspended in 1 ml ddH2O.
3 ml of each pH standard buffer from pH 4 to 7.5 is added to clean cuvettes and background values at 450∣520 nm and 490∣520 nm are determined on the buffers alone.
100 μl of the CF-bead suspension is added to each cuvette and emission at 520 nm is measured with excitation alternating between 450 nm and 490 nm (see Note 14).
The average CF-bead 490/450 excitation ratio for each pH standard (minus background if not already deducted by acquisition software) is calculated and plotted against pH. Confirm that the pKa of the bound carboxyfluorescein is close to the pH that is of most interest and that the curve generated is reasonably flat over the pH range required (see Note 15).
The polynomial equation that best describes the curve is calculated (Fig. 2a). Usually a third or fourth order polynomial is sufficient. This can be done with standard mathematical software such as Microsoft Excel® or MATLAB®.
This equation is used to convert the real time phagosomal 490/450 excitation ratios into pH units and these values are plotted against time (Fig 2b) (see Note 16).
Fig. 2.

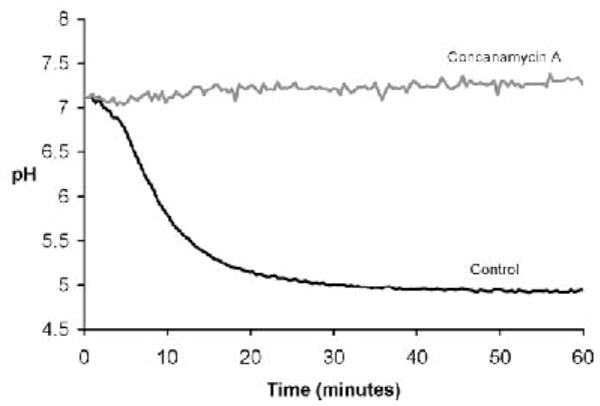
Determination of phagosomal pH. (A) Excitation ratio vs pH standard curve generated by CF-beads in buffers on known pH. The curve of best-fit can be described by the equation y = 0.4233x3 - 2.8693x2 + 7.3391x - 1.5901 (where x=490/450 excitation ratio and y=pH). (B) Phagosomal acidification profiles in BMMØ’s. Phagosomal acidification can be abolished by the V-ATPase inhibitor concanamycin A (100 nm).
3.4. Kinetic analysis of phagosomal proteolytic capacity
3.4.1. Preparation of proteolytic reporter particles
50 mg of carboxylate-modified silica particles is washed three times in 1 ml of PBS by brief vortexing and centrifugation in a tabletop microfuge at 2000 g for 60 seconds.
Particles are resuspended in PBS (pH 7.2) with 25 mg/ml of the heterobifunctional crosslinker cyanamide (freshly made) and incubated at room temperature with agitation for 15 minutes. Excess cyanamide is removed by washing the particles twice with coupling buffer.
Particles are resuspended in 500 μl of coupling buffer with 1mg of DQ green BSA® and 250 μg of α-D-mannosylated-PITC-albumin, and incubated with agitation for 12 hours. This step attaches the proteolytic reporter DQ green BSA® covalently to the particles through the cyanamide crosslinker. The α-D-mannosylated-PITC-albumin serves as an opsonic ligand for the mannose receptor. We have shown previously that the phagocytosis of particles coated in this way is primarily directed through the mannose receptor (3) (see Note 10).
Particles are washed twice with quenching buffer to quench unreacted cyanamide and twice with coupling buffer to remove soluble amine groups.
The particles are resuspended in 1 ml of coupling buffer, and 10 μl of the 5 mg/ml stock of the calibration fluor (Alexa Fluor 594®-SE) in DMSO is added (see Note 11). Incubation at room temperature with agitation for 1 hour allows the particle-bound albumin to be sufficiently labeled with the amine-reactive fluor.
The now fluorescent particles are washed three times with quenching buffer and finally resuspended in 1 ml PBS (see Note 12). 10 μl of 2 % solution of the preservative sodium azide can be added for storage at 4 °C.
3.4.2. Fluorometric measurement of phagosomal proteolysis
30 μl of proteolytic reporter particles (PR-beads) are washed twice with 1 ml sterile PBS to remove traces of sodium azide.
The PR-beads are resuspended in an appropriate volume of binding buffer to achieve ~ 1 × 10⁷ beads/ml (see Note 13).
After 594∣620 nm and 490∣515 nm (excitation λ ∣ emission λ) background measurements are recorded for BMMØ monolayers alone, 85 μl of the diluted PR-beads is laid onto the monolayers in the binding dish and incubated at room temperature for 3 minutes (as per section 3.2).
Unbound PR-beads are washed from the monolayers by dipping in binding buffer and returned to the spectrofluorometer.
Both calibration and reporter fluorescent intensities are measured. The fluorescence of the calibration fluor Alexa Fluor 594® (emission at 620 nm with excitation at 594 nm) should remain constant throughout the assay (see Note 17). The fluorescence of the reporter fluor FL bodipy® (emission at 515 nm with excitation at 490 nm) will increase with progressive proteolysis of the DQ bodipy BSA substrate. Typically an integration time of 1 second per data point is optimal. Data is collected for at least 90 minutes or until exhaustion of the substrate. At the conclusion of the assay, monolayers are examined via microscopy with trypan blue (as per section 3.2).
Data is exported into a standard spreadsheet application such as Microsoft Excel®.
The appropriate background values are deducted (if not already deducted by the acquisition software) and the ratio SRT/C (where SRT=substrate fluorescence in real time and C=calibration fluorescence) is plotted against time (Fig 3).
Gradients of portions of the profiles will give relative values of the generic proteolytic capacity of the phagosomal population over that period.
Fig. 3.
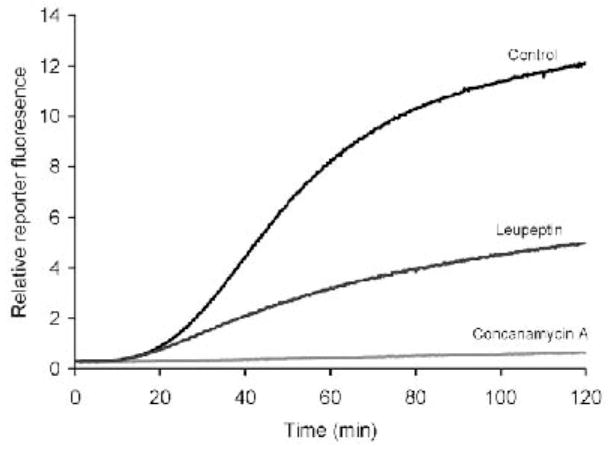
Phagosomal generic proteolytic profiles in BMMØ’s. Phagosomal proteolysis can be diminished with the serine-cysteine protease inhibitor leupeptin (100 μg/ml) and the V-ATPase inhibitor concanamycin A (100 nm).
3.5. Kinetic analysis of lysosomal contribution to the phagosome
3.5.1. Preparation of donor fluorescent particles
50 mg of carboxylate-modified silica particles is washed three times in 1 ml of PBS by brief vortexing and centrifugation in a tabletop microfuge at 2000 g for 60 seconds.
Particles are resuspended in PBS (pH 7.2) with 25 mg/ml of the heterobifunctional crosslinker cyanamide (freshly made) and incubated at room temperature with agitation for 15 minutes. Excess cyanamide is removed by washing the particles twice with coupling buffer.
The particles are resuspended in 1 ml of coupling buffer with 5 mg of defatted BSA and 1 mg of α-D-mannosylated-PITC-albumin, and incubated with agitation for 6 hours. This step covalently attaches the albumin to the particles through the cyanamide crosslinker. The BSA generally serves as a coupler itself for further derivation with Alex Fluor 488-SE® whilst also serving to coat the electrostatic surface of the particle with protein. The α-D-mannosylated-PITC-albumin serves as an opsonic ligand for the mannose receptor. We have shown previously that the phagocytosis of particles coated in this way is primarily directed through the mannose receptor (3) (see Note 10).
Particles are washed twice with quenching buffer to quench unreacted cyanamide and twice with coupling buffer to remove soluble amine groups.
The particles are resuspended in 1ml of coupling buffer, and 10 μl of the 5 mg/ml stock of Alex Fluor 488-SE® in DMSO is added (see Note 11). Incubation at room temperature with agitation for 1 hour allows the particle-bound albumin to be sufficiently labeled with the amine-reactive fluor.
The now fluorescent particles are washed three times with quenching buffer and finally resuspended in 1ml PBS (see Note 12). 10 μl of 2 % solution of the preservative sodium azide can be added for storage at 4 °C.
3.5.2. Lysosomal loading of acceptor fluor in macrophages
BMMØ monolayers on glass cover slips (prepared as per section 3.1) are transferred, using sterile forceps (see Note 8), to a Petri dish containing 100μg/ml of the acceptor fluor Alexa Fluor 594 hydrazide® (Alexa 594-HA) in 6 ml BMMØ growth media (see Note 18).
The monolayers are incubated at 37 °C for 3-5 hours to allow sufficient pinocytic uptake of the membrane impermeable acceptor fluor.
The pulsed BMMØ monolayers are removed by sterile forceps, dipped in BMMØ growth media to remove extracellular acceptor fluor and placed in a new Petri dish containing fresh, warm BMMØ growth media. The monolayers are then incubated at 37 °C for a further 4 to 24 hours to ensure the lysosomal location of the acceptor fluor (see Note 19).
3.5.3. Measurement of phagosomal acceptor fluor accumulation using FRET
30 μl of donor fluorescent particles (donor-beads) is washed twice with 1 ml sterile PBS to remove traces of sodium azide.
The donor-beads are resuspended in an appropriate volume of binding buffer to achieve ~ 1 × 10⁷ beads/ml (see Note 13).
Three fluorescent measurements from BMMØ monolayers are recorded before binding of the donor-beads. Firstly, the total acceptor fluor emission at 620 nm is measured with excitation at 594 nm. While this measurement is not used in any further calculation, it is a necessary control to ensure equivalent acceptor fluor loadings and BMMØ monolayer densities of the samples (see Note 20). Secondly, time should be taken to obtain accurate background values for both the donor and FRET wavelengths at 488∣520 nm and 488∣620 nm (excitation λ ∣ emission λ) respectively.
BMMØ monolayers are carefully removed from the spectrofluorometer, and 85 μl of the diluted donor-beads is laid onto the monolayers in the binding dish and incubated at room temperature for 3 minutes (as per section 3.2).
Unbound donor-beads are washed from the monolayers by dipping the coverslips in binding buffer and returning them to the spectrofluorometer (as per section 3.2).
Both donor and FRET-generated emissions at 520 nm and 620 nm respectively, are recorded during excitation at 488 nm. Typically an integration time of 1 second per data point is optimal. Data is collected for at least 3 hours to allow the phagosomal population to reach equilibrium with respect to accumulation of lysosomal constituents. At the conclusion of the assay, the monolayers are examined via microscopy with trypan blue (as per section 3.2).
The proportion of the “FRET” signal that is due to a bleed-though artifact contributed by the beads themselves is then determined. This is a constant used in later calculations. Background measurements at 488∣520 nm and 488∣620 nm are made with a clean cuvette containing PBS. 5 μl of stock donor-beads is added to the cuvette and stirred (see Note 14). Emissions at 520 nm and 620 nm are recorded during excitation at 488 nm.
All data is exported into a standard spreadsheet application such as Microsoft Excel®.
The appropriate background values are deducted (if not already deducted by the acquisition software) and relative FRET units (RFU) defined by the equation: RFU=FRT/DRT − FB/DB (where FRT=FRET generated fluorescent emission in real time, DRT=donor emission in real time, FB=“FRET” signal contribution of the beads alone, DB=donor emission of the beads alone) are calculated and plotted against time (Fig 4). The RFU at time zero should be close to zero.
Fig. 4.
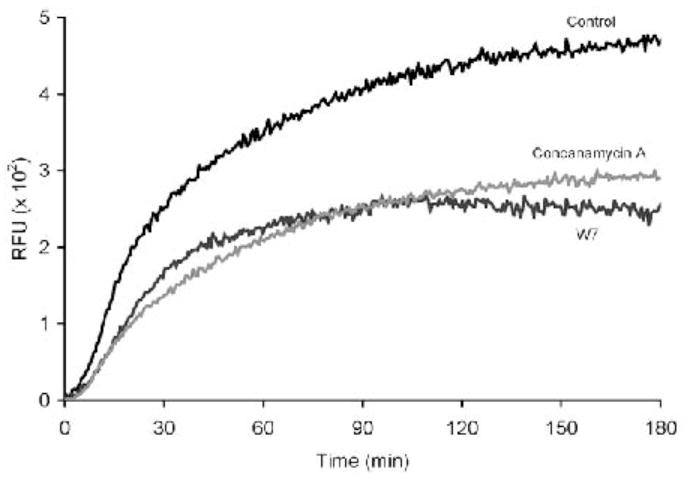
Profile of the lysosomal contribution to the phagosome in BMMØ’s. Rates and extents of lysosomal contribution to the phagosome can be manipulated by the calmodulin inhibitor W7 (15 μM) and the V-ATPase inhibitor concanamycin A (100 nm).
4. Notes
Primary BMMØ’s are generally preferred for their enhanced phagocytic proficiency and adhesion.
0.13 × 12.5 × 25 mm cover glass is not commercially available. Cover glass can be custom ordered from ProSciTech (Thuringowa, Qld, Australia). Alternatively, 25 × 25 mm cover glass is available from Fisher Scientific (Pittsburgh, PA, USA) and can be cut in half by diamond pencil in house.
FBS is substituted for gelatin for spectrofluometric assays as it has low autofluorescence with excitation wavelengths above 450 nm. If assays are expected to take greater than 6 hours, FBS is preferred for sustained macrophage viability.
The authors prefer the 3.0 μm −COOH-modified silica particles due to their ease of handling and low autofluorescence, however polystyrene particles and particles of smaller size can be used successfully. Generally, macrophage-like cell lines do not efficiently phagocytose particles with diameters over 2.0 μm. Therefore particles >2.0 μm are not advised for those cell types.
Arrange cover slips so as not to overlap, taking care not to overcrowd them in the Petri dish as cover slips can move after monolayers have been established and damage to BMMØ’s can occur. Alternatively, cover slips can be separated from each other using partitioned Petri dishes or 6 well plates.
Some general considerations are: the focusing of illumination on sample, the addition of long-pass and short-pass filters, and the adjustment of excitation and emission slit width to maximize signal to noise ratio and to minimize photobleaching.
Cuvette buffer should be of a similar temperature to the cuvettes at addition. This prevents bubble formation that can create unwanted scatter of light.
Cover slips should only be grasped by forceps at the uppermost edge to avoid damaging the area of the monolayer that is illuminated in the spectrofluorometer.
Binding time may need to be increased if smaller particles or polystyrene beads are used.
Particles can be directed though Fc receptors by substitution of the α-D-mannosylated-PITC- albumin with the equivalent amount of human IgG.
Ensure that the fluor/DMSO aliquot is fully thawed and at room temperature before opening to avoid wetting the DMSO.
Labeled particles should be microscopically examined to ensure adequate fluorescence and absence of clumping.
A suitable dilution of beads should be determined for each batch. This should be done by applying the bead suspension to a BMMØ monolayer on cover glass for the desired binding time, washing off unbound beads and assessing degree of bead adhesion under magnification. For most applications a target of 1-2 beads/macrophage is desired. Due to their low density, significantly higher concentrations of polystyrene beads are needed to achieve optimal binding to monolayers.
Ensure that beads are homogenously suspended in the cuvette. If the spectofluorometer is not equipped with magnetic stirrers, use a pipette to disperse CF-beads immediately before measurement.
The pKa of free carboxyfluorescein-SE is 6.4. We have found that when bound to BSA on our experimental particles as described in section 3.3.1., the pKa is shifted to ~5.5 making it particularly useful in the generation of phagosomal pH profiles. However, should the pKa of the CF-beads be inappropriately high thus rendering measurement of lower pH values inaccurate, then Oregon green-SE should be used in addition to carboxyfluorescein-SE.
Standard curves can also be generated using phagocytosed beads on BMMØ monolayers using the ionophore nigericin (10 μM) in K+-containing buffers of known pH. This eliminates the possibility of modification of the fluor’s pKa by the intracellular environment. For convenience we routinely generate standard curves using a suspension of beads as described in section 3.3.3. In each experimental setup however, it should be determined that these curves are equivalent to those generated with bead-containing monolayers treated with nigericin. Standard pH curves need to be generated at the conclusion of every phagosomal pH experiment. Subtle changes to components of the experiment such as degree of bead labeling, slit width and PMT voltage, can have profound effects on the relationship between excitation ratio and actual pH.
It is preferred, but not usually necessary, to record the calibration fluorescence throughout the entire assay. Recording a calibration fluorescence at the beginning and/or conclusion of the assay will increase time resolution of reporter fluor profiles and may allow the use of filter sets that improve signal to noise ratios.
Pulse media should be filter sterilized through a 0.22 μm filter after the Alexa 594-HA is added. If sterility is maintained, the pulse media can be reused up to 3 times.
A gradual loss of acceptor fluor will occur over time. This loss, however, is minimal for chase periods up to 12 hours and can be compensated by increasing pulse periods.
A large discrepancy in total acceptor fluorescence values indicates that there are inequities in either loading of acceptor fluor or BMMØ monolayer density. In either case a monolayer with altered acceptor fluorescence should be replaced with one with acceptor fluorescence commensurate with the other samples.
References
- 1.Lukacs GL, Rotstein OD, Grinstein S. Phagosomal acidification is mediated by a vacuolar-type H(+)-ATPase in murine macrophages. J Biol Chem. 1990;265:21099–21107. [PubMed] [Google Scholar]
- 2.Hackam DJ, Rotstein OD, Zhang WJ, Demaurex N, Woodside M, Tsai O, Grinstein S. Regulation of phagosomal acidification. Differential targeting of Na+/H+ exchangers, Na+/K+-ATPases, and vacuolar-type H+atpases. J Biol Chem. 1997;272:29810–29820. doi: 10.1074/jbc.272.47.29810. [DOI] [PubMed] [Google Scholar]
- 3.Yates RM, Russell DG. Phagosome maturation proceeds independently of stimulation of toll-like receptors 2 and 4. Immunity. 2005;23:409–417. doi: 10.1016/j.immuni.2005.09.007. [DOI] [PubMed] [Google Scholar]
- 4.Yates RM, Hermetter A, Russell DG. The kinetics of phagosome maturation as a function of phagosome/lysosome fusion and acquisition of hydrolytic activity. Traffic. 2005;6:413–420. doi: 10.1111/j.1600-0854.2005.00284.x. [DOI] [PubMed] [Google Scholar]
- 5.Schlesinger PH. Measuring the pH of pathogen-containing phagosomes. Methods Cell Biol. 1994;45:289–311. doi: 10.1016/s0091-679x(08)61858-0. [DOI] [PubMed] [Google Scholar]
- 6.Dunn KW, Mayor S, Myers JN, Maxfield FR. Applications of ratio fluorescence microscopy in the study of cell physiology. Faseb J. 1994;8:573–582. doi: 10.1096/fasebj.8.9.8005385. [DOI] [PubMed] [Google Scholar]
- 7.Garin J, Diez R, Kieffer S, Dermine JF, Duclos S, Gagnon E, Sadoul R, Rondeau C, Desjardins M. The phagosome proteome: insight into phagosome functions. J Cell Biol. 2001;152:165–180. doi: 10.1083/jcb.152.1.165. [DOI] [PMC free article] [PubMed] [Google Scholar]
- 8.Desjardins M. Biogenesis of phagolysosomes: the ‘kiss and run’ hypothesis. Trends Cell Biol. 1995;5:183–186. doi: 10.1016/s0962-8924(00)88989-8. [DOI] [PubMed] [Google Scholar]
- 9.Griffiths G. On phagosome individuality and membrane signalling networks. Trends Cell Biol. 2004;14:343–351. doi: 10.1016/j.tcb.2004.05.010. [DOI] [PubMed] [Google Scholar]
- 10.Henry RM, Hoppe AD, Joshi N, Swanson JA. The uniformity of phagosome maturation in macrophages. J Cell Biol. 2004;164:185–194. doi: 10.1083/jcb.200307080. [DOI] [PMC free article] [PubMed] [Google Scholar]