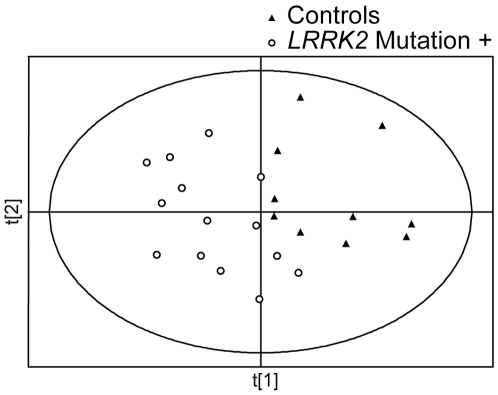
Figure 6. PLS-DA score plots of controls and subjects with G2019S LRRK2 gene mutation.
PLS-DA scores plot showing a significant separation between controls (n = 10) and asymptomatic subjects with G2019S LRRK2 gene mutation (n = 14) using preprocessed datasets. Five controls subjects and seven mutation carriers were randomly selected as the test set and were not used in PLS-DA model construction. Class membership of the subjects in the test set was predicted using this PLS-DA model shown in Figure 7.

