

Abstract
Purpose
To establish normal age-related changes in the magnetic resonance (MR) T2 relaxation time constants of brain using data collected as part of the National Institutes of Health (NIH) MRI Study of Normal Brain Development.
Material and Methods
This multi-centre study of normal brain and behavior development provides both longitudinal and cross-sectional data and has enabled us to investigate T2 evolution in several brain regions for healthy children within the age range of birth through 4-years, 5-months. Due to the multi-centre nature of the study and the extended period of data collection, periodically scanned inanimate and human phantoms were used to assess intra and inter-site variability.
Results
The main finding of this work, based on over 340 scans, is the identification and parameterization of the mono-exponential evolution of T2 from birth through 4-years, 5-months of age in various brain structures.
Conclusion
The exponentially decaying T2 behavior is believed to reflect the rapid changes in water content as well as myelination during brain development. The data will become publicly available as part of a normative pediatric MRI and clinical/behavioral database, thereby providing a basis for comparison in studies assessing normal brain development, and studies of deviations due to various neurological, neuropsychiatric and developmental disorders.
Keywords: T2 relaxometry, pediatric, brain development, myelination
INTRODUCTION
Quantitative MRI acquisition and analysis techniques allow investigations beyond conventional qualitative interpretation employed in routine clinical practice. Such approaches are aimed at quantifying specific tissue characteristics, providing reproducible indices mirroring the underlying biological system. Relaxometry, for instance, combines acquisition and analysis techniques to generate MR relaxation time constants that directly reflect the local environment of protons. In particular, given its sensitivity to alterations in tissue microstructure, T2 relaxation provides a quantitative monitoring tool in both health and disease conditions.
Past studies have examined brain development by assessing grey and white matter contrast variations observed in early childhood (1-4). These qualitative contrast assessments examined conventional T1- and T2-weighted images and are often acquired in the context of clinical examinations, from which only the subjects deemed to have no neurological pathology were retained (1). Some of these studies presented more quantitative grey/white matter contrast ratios which clearly captured the well-known qualitative contrast change associated with the stages of myelination (2,4).
The finding that grey and white matter contrast in infancy is reversed from that of adults is striking. This reversed contrast is observed during the first 4-6 months postnatal and the change to the adult pattern occurs at around the age of 9-12 months (5). The actual timing of the contrast reversal is dependent on the field strength, the imaging sequence, and the brain region studied (3). These qualitative contrast changes stem from the governing relaxation parameters, T1 and T2, as well as from proton density (PD), which all reflect microstructural changes associated with maturation of the underlying tissue. Ideally, a quantitative relaxometry approach to assessing maturation avoids imaging sequence dependence, and permits the detection of changes earlier and more consistently than with qualitative methods (6).
A consistent observation throughout quantitative relaxometry studies is prolonged relaxation times for neonates, followed by a steep decline in both T1 and T2 values, especially during the first year of life. Subsequently, a slower decrease extends into the third year, at which age the relaxation parameters approach adult values (5-9). Because the rate of T2 shortening is much faster than that observed for T1, it is assumed that T2 is more sensitive to tissue changes and is therefore often preferred as an index of early brain development (10).
In many previous studies, cohorts originated from clinical investigations, and data collection was limited to infants showing no apparent MR abnormalities. Thus, the study subjects were not necessarily samples of a strictly normal, healthy population. Recognizing this need for data encompassing populations of normal, healthy young children, the NIH sponsored a multi-centre study, entitled the MRI Study of Normal Brain Development (a.k.a. the NIH Pediatric MRI Data Repository, when referring to the database) (11), for which recruitment is demographically diverse and representative of the US population in terms of gender, race and ethnicity, and family income. This NIH study consists of examining approximately 500 children over a seven-year period, through two distinct objectives, partitioned by age groups: 4.5 to 18 years (Objective 1), and birth to 4-years, 5-months (Objective 2).
The data acquisition includes several domains, each aimed at monitoring different aspects of development such as gross morphological changes via anatomical MRI, biochemical characteristics using MR spectroscopy, tissue microstructure through diffusion tensor imaging, and relaxometry (Objective 2 only), as well as behavioral and cognitive development with the aid of a large battery of age-appropriate neurological and neuropsychological tests. The ultimate goal of this project is to provide a publicly available normative pediatric MRI brain and behavioral database, which can subsequently be used in studies assessing normal brain development and brain deviations associated with neurological, neuropsychiatric and developmental disorders (11). The objectives of the present work were to estimate T2 values in several brain regions in 344 brain scans of a representative group of healthy children aged birth through 4-years, 5-months of age and to subsequently model the evolution of the T2 relaxation time constant with age.
MATERIALS AND METHODS
Subject Cohort
As part of the Objective 2 age range (birth through 4-years, 5-months) of the NIH pediatric study, a sample size of 114 normal, healthy children has been recruited, across 11 age cohorts as described by Almli et al. (12). These cohorts are characterized by predetermined ages at which children begin the study, providing a cross-sectional component of the study, while the longitudinal component is achieved with at least two additional visits, i.e., a minimum of three scanning sessions for each child (excluding subject attrition). In addition, the demographically-balanced sampling plan is governed by three other factors, namely gender (approximately same number of males and females), family income and race/ethnicity based on data from the United States Census Bureau (13). For each of these subjects, MRI, neurological and behavioral data was collected as described in detail elsewhere (11).
Table 1 summarizes the MRI T2 relaxometry data collected for each of the two participating sites, SITE 1 (S1) and SITE 2 (S2). A total of 114 subjects (Total (Male/Female); S1: 45 (27/18); S2: 69 (40/29)) and 344 scans were completed. A shorter interval sampling plan is chosen for the younger subjects (238 brains scans between the age of 0 and 18 months [i.e., 3-month inter-scan intervals]) versus older subjects (106 scans between 18 months to 53 months [i.e., 6-month or 12-month inter-scan intervals]) in order to capture the rapid developmental changes expected during early infancy (14).
Table 1.
Age and gender distribution of subject scans at each data collection site (S1: SITE 1; S2: SITE 2)
| Age range(months) | S1 [Male/Female] | S2 [Male/Female] | Total [Male/Female] |
|---|---|---|---|
| 0 | 13 [6/7] | 10 [2/8] | 23 [8/15] |
| 3 | 7 [4/3] | 22 [13/9] | 29 [17/12] |
| 6 | 16 [10/6] | 25 [10/15] | 41 [20/21] |
| 9 | 15 [7/8] | 24 [11/13] | 39 [18/21] |
| 12 | 9 [5/4] | 25 [12/13] | 34 [17/17] |
| 15 | 7 [6/1] | 25 [11/14] | 32 [17/15] |
| 18 | 8 [5/3] | 32 [16/16] | 40 [21/19] |
| 24 | 5 [4/1] | 22 [14/8] | 27 [18/9] |
| 30 | 4 [2/2] | 27 [17/10] | 31 [19/12] |
| 36 | 4 [1/3] | 21 [10/11] | 25 [11/14] |
| 48 | 3 [1/2] | 20 [11/9] | 23 [12/11] |
| Total | 91 [51/40] | 253 [127/126] | 344 [178/166] |
Relaxometry Protocols and T2 Estimation
With the goal of estimating the T2 relaxation time, two dual-contrast TSE (turbo spin echo) acquisitions were carried out on 1.5 Tesla systems (GE Signa at SITE 1 and Siemens Sonata at SITE 2, respectively). The acquisition time of each set of dual-contrast images was about 3-5 minutes with a 1×1×3 mm resolution, using the following timing parameters (TR/TE1/TE2; TR/TE3/TE4) and fields of view (FOV): [GE: 3500/14/112 ms; 3500/83/165 ms, FOV: 256×256 mm] [Siemens: 3500/13/121 ms; 3500/83/165 ms, FOV: 256×256 mm]. The second dual-contrast acquisition, with longer TE values, provides stronger T2-weighting and increased sensitivity to the longer relaxation times expected in young infants. The T2 estimates generated from two to four effective echo times in standard turbo-spin echo sequences, utilizing 2D-FT multi-slice techniques with slice selective 90 and 180 pulses, suffer from systematic errors due to the introduction of signal from stimulated echoes and other echo pathways. More accurate T2 measurements can be sought using more rigorous pulse sequence strategies, as discussed by Poon and Henkelman (15). Such strategies have been employed in other studies, in single slice mode and with much longer scan times, to assess multi-exponential T2 signal decay curves which may reflect, for example, short T2 components from myelin associated water as well as longer T2 components from other intra- and extracellular water compartments (16). The long scan times and limited volume coverage associated with such truly accurate T2 characterizations preclude, in our view, their incorporation into this study of unsedated children under 5 years of age. Furthermore, the T2 values we report are sensitive to age related changes in tissue water content and distribution and are actually more relevant than `true' T2 values when considering and/or predicting brain tissue contrast observed clinically when using the most widely adopted T2-weighted imaging technique in the world.
Through the NIH pediatric study protocol, all children were scanned during natural sleep (i.e., without sedation) using anatomical T1-weighted (T1W), proton density and T2-weighted (PD/T2W), followed by T1 relaxometry acquisitions, then either diffusion tensor imaging or MR spectroscopy and finally the additional T2 relaxometry scans, for a total scan time of less than 1 hour. The neuroanatomical scans (T1W and PD/T2W) are the highest priority and a scanning session is only deemed successful if these acquisitions are completed (11). It is also evident from this prioritized list of acquisitions that the second set of T2-weighted images was acquired towards the end of the protocol, increasing the likelihood that the subject would be unable to complete the entire data collection. T2 maps were calculated using either two or four echo times, via the following linearized equation:
| [Eq 1] |
where S0 is the equilibrium signal and Si is the signal at the ith echo time (TEi). The linear regressions were carried out using MATLAB (The Mathworks, Inc., Natick, MA, USA). The effects of Rayleigh noise were not taken into account, considering the high signal-to-noise ratio (SNR) present in all images used for T2 estimation. More specifically, the minimum SNR in images from both sites (SNRS1~15: SNRS2~19) exceeds the threshold for approximate Gaussianity (SNR>3 (17) or SNR>8 (18)).
Quality Control
Data from both an ACR (American College of Radiology) (19) phantom and a human (a.k.a. Living phantom) were collected periodically in order to assess the repeatability within and across sites. As per the protocol of the overall study, the ACR phantom was nominally scanned with the full protocol at monthly intervals at both sites (total of 93 scans). The Living phantom is a healthy adult male, who was 53 years old at the beginning of the study and was scanned at approximately 1-year intervals, also at both sites (total of 11 scans). This phantom enables a comparison of derived tissue characteristics (i.e., relaxation times, tissue volumes, etc.) not possible with the ACR phantom. Figure 1 and Figure 2(a) illustrate the regions of interest (ROIs) where T2 was measured in the phantoms and provide the expected T2 relaxation time constants based on the literature and the known composition of the ACR phantom. In addition, for the ACR phantom, a 32-echo single slice CPMG sequence (following the guidelines of Poon et al. (15)) was used as a gold standard in assessing the accuracy of the estimates obtained with the relaxometry protocol used on the children.
Figure 1.
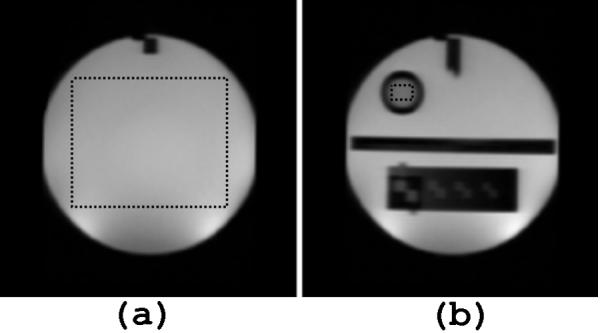
ROI selection for ACR Phantom indicated by dotted lines (a) (ROI 1) Main compartment: 10mmol NiCl, 75mmol NaCl, T2~125ms (b) (ROI 2) Contrast vial: 20mmol NiCl, 15mmol NaCl, T2~70ms
Figure 2.
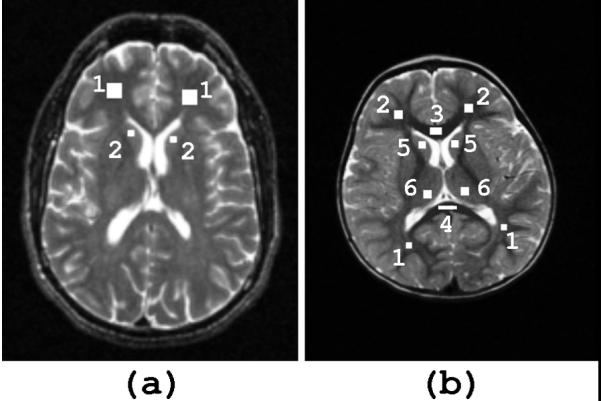
ROI selection for (a) living phantom [1] ROI 1: frontal white matter; T2 ~ 80-90 ms [2] ROI 2: head of caudate nucleus; T2 ~ 90-100 ms (b) subjects (shown here on a T2-weighted image of a 52 month old subject) in white matter: [1] major forceps [2] minor forceps [3] genu of corpus callosum [4] splenium of corpus callosum and grey matter: [5] head of caudate nucleus [6] thalamus
Subject Regions of Interest
Because the currently available stereotaxic brain models, such as the ICBM152 average (20), are based on adult brains, they are often not suitable as targets for registration of infant scans. The ability to create a standard model in which structures are distinctly and consistently defined for the entire infant population is hindered by relative contrast differences, due to a grey/white matter contrast reversal around the age of 6 months. At this stage of maturation, there is poor grey/white matter differentiation, adding further difficulty to reliable structural segmentation. Given these limitations, the relaxometry analysis in the subject cohort was restricted to manually selected ROIs with careful selection of areas free of partial volume effects. Since the aim is to include a single tissue type, the selection is carried out on the image providing the highest contrast for a specific age. This often corresponds to the image acquired at TE=112 ms and TE=121 ms for the GE and Siemens sequences, respectively. The specified ROIs in Figure 2(b) include four white matter (minor forceps, major forceps, genu and splenium of corpus callosum) and two deep grey matter (head of caudate nucleus, thalamus) regions, each relatively large and easily identifiable. Bilateral results were averaged.
Data analysis
Based on previous work in modeling T2 age dependence in young children (7,8), both mono- and bi-exponential fits were attempted. It is important to note that these models are applied to the T2 change over time, which should not be confused with the mono-exponential model used for T2 estimation. The single exponential model is given by:
| [Eq 2] |
The bi-exponential model is similar, with two added parameters in the extra term:
| [Eq 3] |
The parameters were estimated using non-linear Nelder-Mead minimization through the `fminsearch' function in MATLAB (The Mathworks, Inc., Natick, MA, USA). In addition, the adjusted coefficient of determination (), which gives an indication of the reliability of the fit, was used to decide whether the extra exponential term was justified (7,8).
| [Eq 4] |
where
Parameter standard deviations were used to quantify the reliability of the estimated parameters while the variance accounted for (VAF) was used to express the proportion of the variability in the observed data attributable to the dependence on the regression equation. The advantage of using the adjusted coefficient of determination () to determine whether added parameters are justified is that it takes into account the number of parameters and will only increase if these added parameters improve the fit. On the other hand, the VAF should be used in conjunction with an F-test as a measure of goodness of fit. An F-test was also performed to determine whether the 4-echo and 2-echo data could be combined. Directly computing the statistical difference between the 2-point and 4-point fits is difficult because not all age groups are well represented and only a limited number of scans were acquired at each site (S1: 2-echos:60 vs 4-echos:31; S2: 2-echos:196 vs 4-echos:57). Therefore, the analysis consisted of comparing the age regressions between the 2-point fits for all datasets and including the 4-point fits with the 2-point fits. Because it is desirable to retain the higher precision 4-echo data, a weighted fit was also investigated. This weighting, based on the standard deviation of estimated T2 values in each ROI, was combined with a weighting based on subjects per age group. The difference in age distribution is especially apparent for S1 (Table 1).
RESULTS
Quality Control
The variability across time within each site is quite low (<5% and <8% for the ACR and Living phantom, respectively), indicating good reproducibility. The estimates for the ACR phantom provided by the dual echo TSE sequences are similar to but relatively higher than the gold-standard 32-echo CPMG sequence (ROI1 T2(TSE)= 153.4±5.3 ms, T2(CPMG)~135 ms; ROI2 T2(TSE)= 74.0±2.7 ms, T2(CPMG)~70 ms). This discrepancy can be attributed to the expected lower accuracy of the 4-echo sequence as compared to the 32-echo gold standard. For the Living phantom, the estimated values are relatively close to the expected range for healthy adults in both white (T2(S1)= 78.9±2.2 ms; T2(S2)=91.1±3.4 ms; T2(adult)~87 ms (21)) and grey matter structures (T2(S1)=87.6±3.3 ms T2(S2)=104.9±7.6 ms; T2(adult)~92 ms (21)). However, for both the ACR and Living phantoms, the T2 estimates from SITE 1 are consistently lower than those of SITE 2 (p<0.01), probably due to systematic scanner differences.
Age Regression
The average T2 relaxation constants at birth of the combined site data are significantly prolonged as compared to adult values in both white (major and minor forceps: T2(birth) = 404.4±8.1 ms,corpus callosum: T2(birth) = 228.6±3.6 ms; T2(adult)~80-90 ms) and grey matter (T2(birth) = 215.9±3.2 ms, T2(adult)~90-100 ms). During the first few months, a rapid decline in T2 is observed followed by a slower decrease. Because the progression with age is of particular interest in this study and a deviation between the intercepts of any regression curves does not correspond to an actual difference in the evolution of the T2 parameter with age, the parameter C was used to compare the various regression lines. First of all, the combination of 4 and 2-echo data was investigated for each site. A two-tailed t-test revealed a significant difference for SITE 1 in the thalamus (t(87)=2.1, p<0.05) and SITE 2 in the caudate nucleus (t(249)=2.9, p<0.01) while the difference in all other ROIs were not significant (SITE1: t(87)<1.9, p>0.05; SITE2: t(249)<1.6, p>0.1). The general lack of significance is to be expected, considering that only a limited number of subjects could withstand the acquisition of the second set of dual-echo images. In order to retain and give greater importance to the more reliable 4-echo data, weighting based on ROI standard deviation was included. In addition, this helped to compensate for the reduced precision of the estimates of very high T2 values, which were measured with relatively short echo times. A weighting based on age was also included so that each age group is equally represented. This combined weighting was used for all further analysis.
In terms of results between the two sites, as in the case with the phantoms, the T2 estimates from SITE 1 were consistently lower as compared to those from SITE 2. Nonetheless, as mentioned above, the progression of T2 with age is of greatest importance, therefore parameter C was compared between the two sites. A two-tailed t-test revealed a significant difference in the minor forceps (t(336)=2.5, p<0.02) but failed to be significant in all other ROIs (t(336)<1.8, p>0.10). The discrepancy in the minor forceps is probably a result of the relatively low quality of fit for SITE 1 (=0.80). Nevertheless, because in general these results indicate a similar dependence on age for the two sites, the datasets were combined. The results from each of the sites and the parameter estimates of the combined dataset, all weighted according to ROI variance and age group sizes, are given in Table 2 for all ROIs.
Table 2.
Mono-exponential parameter estimates for separate and combined sites in selected ROIs
| Parameter | Site | Major forceps | Minor forceps | Genu of corpus callosum | Splenium of corpus callosum | Caudate nucleus | Thalamus |
|---|---|---|---|---|---|---|---|
| T2(0) (ms) | S1 | 101±1.0 | 100±1.4 | 80.4±0.85 | 85.1±0.75 | 110±0.67 | 104±0.61 |
| S2 | 114±0.88 | 112±1.4 | 87.8±0.76 | 93.9±0.65 | 122±0.50 | 117±0.39 | |
| C | 111±0.91 | 108±1.2 | 86.5±0.85 | 92.4±.73 | 119±0.62 | 114±0.55 | |
| T2(1) (ms) | S1 | 269±12 | 227±13 | 142±4.3 | 128±5.2 | 100±5.5 | 92.7±5.1 |
| S2 | 384±6.1 | 376±8.8 | 172±2.3 | 149±2.0 | 116±2.0 | 116±1.5 | |
| C | 301±6.6 | 281±7.4 | 147±2.7 | 132±2.9 | 103±2.7 | 95.7±2.6 | |
| C(1/months) | S1 | 0.30±0.017 | 0.21±0.016 | 0.16±0.008 | 0.22±0.014 | 0.35±0.028 | 0.34±0.026 |
| S2 | 0.32±0.008 | 0.26±0.009 | 0.17±0.004 | 0.22±0.007 | 0.34±0.011 | 0.34±0.010 | |
| C | 0.29±0.010 | 0.22±0.009 | 0.16±0.010 | 0.22±0.009 | 0.31±0.016 | 0.33±0.017 | |
| VAF (%) | S1 | 98.6 | 96.6 | 99.4 | 99.4 | 99.7 | 99.7 |
| S2 | 99.2 | 98.3 | 99.5 | 99.4 | 99.8 | 99.9 | |
| C | 98.3 | 97.1 | 98.9 | 98.9 | 99.5 | 99.6 | |
| (mono) | S1 | 0.93 | 0.80 | 0.94 | 0.94 | 0.93 | 0.93 |
| S2 | 0.95 | 0.91 | 0.95 | 0.93 | 0.94 | 0.95 | |
| C | 0.91 | 0.86 | 0.90 | 0.88 | 0.86 | 0.86 | |
| (bi) | S1 | 0.94 | 0.89 | dnc | dnc | 0.95 | 0.95 |
| S2 | 0.97 | 0.95 | dnc | dnc | 0.97 | 0.97 | |
| C | 0.92 | 0.87 | dnc | dnc | 0.86 | dnc |
- Fit parameter values are: parameter ± parameter standard deviation
- S1: SITE 1; S2: SITE 2; C: both sites combined
- VAF: variance accounted for
- : adjusted coefficient of determination
- mono: mono-exponential model; bi: bi-exponential model
- dnc: did not converge using `fminsearch' in MATLAB (The Mathworks, Inc., Natick, MA,USA)
From these results, the quality of fit of the combined data to the mono-exponential model are relatively high in all ROIs ( = 86-91% (VAF = 97.1-98.9%) in white matter; = 86% (VAF = 99.5%) in grey matter). Due to the variability between sites, the goodness of fit is in general slightly less for the combined dataset than when a single site is considered ( = 80-94%; = 91-95% in white matter; = 93%; = 94-95% in grey matter). To determine whether additional parameters were justified, a bi-exponential model was tested. The combined data often failed to converge to the bi-exponential model and as shown in Table 2, the coefficient of determination did not increase substantially (maximum increase in of 1%). Thus a mono-exponential is sufficient and best suited to the data. An F-test revealed no significant difference in the regression parameters with gender (p<0.01). The resulting plots are shown in Figure 3 for each anatomical ROI. The cross-over in T2 values between cerebral white and deep grey matter occurs at approximately 15 months of age. In terms of the significance of the estimated parameters, T2(0) corresponds to the relaxation time at ~4.5 years, at which point relaxation parameters are thought to be approaching their adult value. This is reflected in the results (white matter: T2(0) = 86.5-111 ms, T2(adult)~87 ms (21); grey matter: T2(0) = 114-119 ms, T2(adult)~92 ms (21)). The estimated values are a little higher than expected, possibly partly due to the sequence-specified effective echo times and because at 4.5 years, full maturation may not yet be reached. A faster progression in T2 values is observed in the major compared to the minor forceps (CMF~0.29 months-1, Cmf~0.22 months-1), and faster in the splenium compared to the genu of the corpus callosum (CsCC~0.22 months-1, CgCC~0.16 months-1. For deep grey matter, the rates of change are Ccn~0.31 months-1 and Cthal~0.33 months-1 for the caudate nucleus and the thalamus respectively.
Figure 3.

Mono-exponential regression of T2 with age in selected regions of interest
DISCUSSION
Based on the results for both ACR and Living phantom studies, the relaxation parameter estimates show good reproducibility over time (standard deviation<8%) and are within 12% (ROI1) and 5% (ROI2) of the values obtained by gold-standard methods (applied on the ACR phantom). The fact that the estimates for the shorter T2 (74±2.7 ms) in ROI2 are in better agreement with the gold-standard data (~70 ms) is probably due to the choice of echo times in the protocol. In addition to the expected loss in estimate accuracy from a 4-echo versus a 32-echo sequence, the shorter maximum echo time of the TSE sequence (TEmax(TSE) = 165 ms vs TEmax(CPMG) = 259 ms) might account for the increased discrepancy in estimating the longer T2 values in ROI1 (T2(TSE) = 153.4±5.3 ms, T2(CPMG)~135 ms). There is also a consistent T2 estimate bias between the two sites, by which values from SITE 2 are higher than those from SITE 1. This is probably a result of systematic differences between the GE and Siemens scanners. More specifically, the multiple slice selective refocusing pulses, characteristic of 2D-FT multi-slice imaging techniques, have transition zones in which the flip angles vary from nominally 180 to 0 degrees. With these non-ideal pulses, resulting from either B1-field nonuniformity or slice-profile imperfections, stimulated echoes with T1 rather than T2 decay constants will contribute to the measured signal intensities at the different echo times in a manner which depends on the precise slice profiles. These effects will undoubtedly vary from manufacturer to manufacturer. Nonetheless, the expected range of relaxation time constants during infancy far exceeds the variability in the phantom studies over time, so that the overall observations should be quite robust. In addition, despite the difference in T2 estimates, the progression with age is in general consistent in all ROIs and it is thus reasonable to combine the data from the two sites for this particular analysis. Although this provides support for system independence, it does not guarantee it and careful consideration is required when combining multi-site data.
There is inevitably a trade-off between accuracy and speed in terms of relaxometry acquisition sequences. For example, to achieve a similar resolution, a single slice 32-echo acquisition would require close to 6 minutes of scan time whereas a full-brain 4-echo acquisition requires at most 10 minutes. In the context of this study, precision and brain coverage were deemed more important than accuracy, such that results should be reproducible and robustly capture changes with time but need not necessarily capture the exact time constant value. Moreover, scanning a population of unsedated children in the birth to less than 5-year age range necessitates very short scan times. The time limitations also preclude the use of multi-component T2 analysis, which would require at least 32 echo times and sufficient signal to noise ratio to reliably differentiate relaxation components.
The average T2 relaxation parameters at birth in the current study for the minor (S1: T2(mf) = 372±66 ms; S2: T2(mf) = 476±64 ms) and major (S1: T2(MF) = 352±44 ms; S2: T2(MF) = 464±33 ms) forceps are comparable with the values reported by Ding et al. (8) at 1.5 T for white matter (~400 ms). Similarly for grey matter, the current results in the caudate nucleus (S1: T2(cn) =197±9.5 ms; S2: T2(cn) = 233±10 ms) and the thalamus (S1: T2(thal) = 183±9.0 ms; S2: T2(thal) = 214±8.5 ms) are consistent with those reported by Ding et al. (8) (~200 ms). Because an unexpected decrease in the T2 relaxation parameter has been observed with increasing field strength (22,23), our results are also qualitatively comparable to those obtained at a higher field strength. For example, T2 values reported by Ferrie et al. (6) at 2.35 T for healthy preterm newborns are shorter, but in the same relative order as those for the current study (T2(mf) = 266±35 ms; T2(MF) = 213±28 ms; T2(cn) = 172±10 ms; T2(thal) = 120±6 ms). The relatively lower standard deviations reported in that study can be explained by the very restricted cohort investigated (7 subjects at a post-conceptional age of 37 weeks). In the present study, the gestational age was not provided and thus a greater variability between subjects is expected. A similar argument applies to the results shown by Thornton et al. (10) at 2.4 T (T2(mf) = 228±32ms; T2(occipital WM) = 217±33 ms; T2(thal) = 136±13 ms), where the subject cohort was limited to an age range of 37-42 weeks, post-conception. A consistent result in these studies and the present study is that the T2 value of white matter at birth significantly exceeds that of grey matter. While earlier relaxometry studies failed to detect this difference (5,9,24), it was argued by Ding et al. (8) that the results were affected by relatively short repetition times on the order of 2000-2500 ms as opposed to the 3000-4500 ms repetition times used in later studies. This refers to the potential left-over T1 signal component, which is relatively long-lived in neonates (T1(max)~2.5 s). However, we expect the effect of this residual magnetization to be minimal in our study. A more likely explanation is that the short echo times in these early reports (TEmax = 56 ms (5); 80 ms(9); 90 ms (24)), used to measure the relatively long T2's expected for this age range, might be inadequate. Using longer echo times (2-echo: TEmax = 121 ms; 4-echo: TEmax = 165 ms for the present protocol) effectively allows sufficient magnetization decay and thus more accurately captures infant T2 relaxation times, which are on the order of 400 ms.
For the age range of the present study, a significant decrease in the T2 relaxation parameter is characterized by a steep decline within the first year, followed by a less pronounced decline thereafter. Thus, as per a previous study (7), mono-exponential regressions with age were applied, providing high quality fits. In general, the mono-exponential fit was well suited to T2 (mean ~88%) and fits were slightly better in white (=86-91%) than grey matter (= 86%). A bi-exponential model, as proposed by Ding et al. (8), was also tested, but failed to be justified for our dataset which had a more restricted age range (<5-years) than the older study (<40-years) (8). Thus, insufficient data from older subjects may impede the detection of a second exponential term, which is thought to reflect the subtle changes extending into adult age (25,26).
The expected result was obtained for relaxation parameters for subjects approaching 4-years, 5-months (the upper age limit in the cohort) in that they begin to approach the adult range and the T2 value of grey matter exceeds that of white matter (as expressed through the T2(0) parameter). The relaxation parameters are shown to exhibit a rapid decline until approximately 1 year of age, at which point the values reach the range expected for adults. This result is qualitatively comparable with the 10-month rapid decrease reported in the Ding et al. (8) study, but shorter than the 2-3 year period observed by Ono et al. (24), which were both carried out at 1.5 T. The discrepancy with the latter results is probably due to the relatively short echo times (TE = 40, 80 ms) used in the Ono et al. study (24) and the difference in the definition of the point at which values “approach” the adult range. Other reports have shown that the significant lengthening in relaxation times as compared to adults extends to of 3-4 years at 0.15 T (9) and 0.35 T (5). The difference in sequence, field strength and echo times could be the source of the discrepancies.
Our data also shows a first cross-over between relaxation parameters of white and grey matter (splenium of corpus callosum and caudate nucleus) at approximately 6 months, followed by one at approximately 13 months (between the major forceps and the caudate nucleus). These results approach the cross-over at ~7 months found by Ding et al. (8), between similar structures (frontal lobe white matter and caudate nucleus). The difference could be due to the fact that these estimates were derived from a mono-exponential model in our case and a bi-exponential model in the case of Ding et al. (8). Also, as is the case in all the comparisons made thus far, the choice of the regions of interest is an additional source of discrepancies among studies. Since there is no available standard model for pediatric brains, regions are selected manually and are therefore subject to inter-rater variability and partial volume effects.
Throughout the literature, the generalized rapid decrease in relaxation parameters for white and grey matter is thought to be primarily indicative of water content and distribution changes. Several studies have confirmed that the steep decline in water content during early childhood is paralleled by pronounced decreases in T2 values within the first year postnatal with more subtle but continual decreases extending into adulthood (5,27,28). Concurrent with water content decline, white matter myelination occurring during early development affects the relaxation parameters through alterations of brain water distribution. The increase in concentration of myelin precursors such as myelin basic proteins, cholesterol and glycolipids (29), as well as the proliferation and differentiation of glial cells and the development of axons and dendrites (24,30), increase the binding potential for protons of free water molecules to the surrounding macromolecules and effectively reduce the observed relaxation times (31,32). From postmortem studies, and paralleled by qualitative and quantitative MRI studies, it has been shown that myelination progresses most rapidly until 2 years of age, followed by a slower and less dramatic change extending well into the second decade of life (28,33). This temporal progression is reflected in the results of this study, where T2 relaxation times exhibit a rapid decline until about 1 year of age in all regions of interest, at which point the values are within approximately 10% of the estimate at the age of 4-years, 5-months. The average decay rate in each type of tissue as a whole is 0.19±0.01 months-1 in the corpus callosum, 0.26±0.01 months-1 in white matter and 0.32±0.02 months-1 in grey matter. In terms of the general spatial progression, the rate of decline for T2 values with age is faster in the major forceps as compared to the minor forceps (CMF = 0.29±0.010 months-1 > Cmf = 0.22±0.009 months-1) and similarly more rapid in the splenium than in the genu of the corpus callosum (CCCs = 0.22±0.009 months-1 > CCCg = 0.16±0.010 months-1). These relative rates are consistent with the results by Ding et al. (8) and with the expected posterior-to-anterior pattern of myelination. This is evidenced through perinatal histochemical studies (33) and paralleled through qualitative analysis (2-4), and measures of quantitative relaxometry (7,8), magnetization transfer experiments (34), and estimates of full brain cholesterol (28). In fact, during early brain development, myelination is initiated caudally, in the spinal cord, and spreads rostrally through the brain. Another interesting observation is the apparent slower rate of decline in the corpus callosum as compared to more peripheral white matter structures (CCC~0.19 months-1 < CperipheralWM~0.26 months-1). This may reflect a more advanced degree of myelination in the deeper white matter structures (35), such as a relatively high concentration of early myelinating fibers. Thus, at birth the process is already nearing maturation and exhibits a slower evolution with time (34).
The average rate of decline in deep grey matter is considerably faster than that in peripheral and deep white matter structures (Ccn~0.31 months-1, Cthal~0.33 months-1 versus CpWM~0.26 months-1 and CCC~0.19 months-1). This contradicts the rate constants of the first exponential term in the model proposed by Ding et al. (8) for the same structures (C1cn~0.40 months-1, C1thal~0.31 months-1 versus CpWM~0.48 months-1). It appears that this difference is related to the choice of model and weighting. For example, for the unweighted data that did converge to the bi-exponential model (major/minor forceps and caudate nucleus), the decay constants from the first exponential term for white matter (CpWM~0.53 months-1) is greater than that for grey matter (Ccn~0.45 months-1). However, the data in general did not converge to the bi-exponential model and no significant increase in the adjusted coefficient of determination was observed.
The main cause of the decay in grey matter is attributed to decreases in water content, concurrent with the rapid proliferation and formation of oligodendroglial cells, synapses and dendrites, which further reduces the free water in grey matter (36,37). Another possible factor contributing to T2 reductions in deep grey matter structures that has been suggested is the accumulation of paramagnetic metals such as iron (38,39), as well as the presence of myelinated white matter projections in regions such as the thalamus.
In conclusion, as per the objective of the NIH MRI Study of Normal Brain Development, normal age-related changes in T2 relaxometry were investigated and shown to provide a sensitive index for the assessment of normal brain maturation, through relaxation time constants that reflect the alterations in water content and distribution. Of special interest is the progression of myelination in white matter, which is the dominant developmental process occurring in synchrony with the observed relaxation parameter decline. During the neonatal period, the changes are especially dramatic, as demonstrated through the rapid shortening of this parameter and modeled through a rapid mono-exponential decay with age. The culmination of the results to date represents a subset of a normative database, a portion of which is currently available through www.NIH-PediatricMRI.org and the remainder of which will become publicly available in the future. This will provide a comparison standard for other studies investigating normal brain development, as well as studies of relaxation parameter deviations associated with disease. Neural-Behavioral data, collected concurrently with the MR data, will also allow for the investigation of potential relationship between brain T2 and behavioral functions.
ACKNOWLEDGMENTS
This work was supported in part by the National Institute of Child Health and Human Development (Contract N01-HD02-3343), the National Institute on Drug Abuse, the National Institute of Mental Health (Contract N01-MH9-0002), the National Institute of Neurological Disorders and Stroke (Contracts N01-NS-9-2314, -2315, -2316, -2317, -2319 and -2320) and the NIH Neuroscience Blueprint. Special thanks to the NIH contracting officers for their support.
We also acknowledge the important contribution and remarkable spirit of John Haselgrove, Ph.D. (deceased).
Footnotes
This work was not written as part of Ilana Leppert's official duties as a Government employee. The views expressed in this article do not necessarily represent the views of the NIMH, NIH, HHS, or the United States Government.
REFERENCES
- 1.Paus T, Collins DL, Evans AC, Leonard G, Pike B, Zijdenbos A. Maturation of white matter in the human birth: A review of magnetic resonance studies. Brain Research Bulletin. 2001;54:255–266. doi: 10.1016/s0361-9230(00)00434-2. [DOI] [PubMed] [Google Scholar]
- 2.Takeda K, Nomura Y, Sakuma H, Tagami T, Okuda Y, Nakagawa T. MR assessment of normal brain development in neonates and infants: comparative study of T1- and diffusion-weighted images. J Comput Assist Tomogr. 1997;21:1–7. doi: 10.1097/00004728-199701000-00001. [DOI] [PubMed] [Google Scholar]
- 3.Van der Knaap MS, Valk J. MR imaging of the various stages of normal myelination during the first year of life. Neuroradiology. 1990;31:459–470. doi: 10.1007/BF00340123. [DOI] [PubMed] [Google Scholar]
- 4.Ashikaga R, Araki Y, Ono Y, Nishimura Y, Ishida O. Appearance of normal brain maturation on fluid-attenuated inversion-recovery (FLAIR) MR images. Am J Neuroradiol. 1999;20:427–431. [PMC free article] [PubMed] [Google Scholar]
- 5.Holland B, Haas D, Norman D, Brant-Zawadski M, Newton TH. MRI of normal brain maturation. AJNR. 1986;7:201–208. [PMC free article] [PubMed] [Google Scholar]
- 6.Ferrie J, Baratin L, Saliba E, et al. MR assessment of the brain maturation during the perinatal period: quantitative T2 MR study in premature newborns. Magn Reson Imaging. 1999;17:1275–1288. doi: 10.1016/s0730-725x(99)00080-6. [DOI] [PubMed] [Google Scholar]
- 7.Engelbrecht V, Rassek M, Preiss S, Wald C, Mödder U. Age-dependent changes in magnetization transfer contrast of white matter in the pediatric brain. Am J Neuroradiol. 1998;19:1923–1929. [PMC free article] [PubMed] [Google Scholar]
- 8.Ding X, Kucinski T, Wittkugel O, et al. Normal brain maturation characterized with age-related T2 relaxation times: an attempt to develop a quantitative imaging measure for clinical use. Investigative Radiology. 2004;39:740–746. doi: 10.1097/00004424-200412000-00005. [DOI] [PubMed] [Google Scholar]
- 9.Masumura M. Proton relaxation time of immature brain: II. In vivo measurement of proton relaxation time (T1 and T2) in pediatric brain by MRI. Child's Nervous System. 1987;3:6–11. doi: 10.1007/BF00707186. [DOI] [PubMed] [Google Scholar]
- 10.Thornton JS, Amess PN, Penrice J, Chong WK, Wyatt JS. Cerebral tissue water spin-spin relaxation times in human neonates at 2.4 Tesla: Methodology and the effects of maturation. Magn Reson Imaging. 1999;17:1289–1295. doi: 10.1016/s0730-725x(99)00063-6. [DOI] [PubMed] [Google Scholar]
- 11.National Institute of Health The MRI Study of Normal Brain Development. Protocol: October 2004, www.NIH-PediatricMRI.org.
- 12.Almli CR, Rivkin MJ, McKinstry RC. Brain Development Cooperative Group. The NIH MRI study of normal brain development (Objective-2): Newborns, infants, toddlers, and preschoolers. NeuroImage. 2007;35:308–325. doi: 10.1016/j.neuroimage.2006.08.058. [DOI] [PubMed] [Google Scholar]
- 13.United States Census Bureau 2000 Basic counts: Population, Retrieved from: http://factfinder.census.gov.servlet/SAFFPeople?_sse=on.
- 14.Evans AC. Brain Development Cooperative Group. The NIH MRI study of normal brain development. NeuroImage. 2006;30:184. doi: 10.1016/j.neuroimage.2005.09.068. [DOI] [PubMed] [Google Scholar]
- 15.Poon C, Henkelman RM. T2 quantification for clinical applications. J Magn Reson Imaging. 1992:541–553. doi: 10.1002/jmri.1880020512. [DOI] [PubMed] [Google Scholar]
- 16.Mackay A, Whittall K, Adler J, Li D, Paty D, Graeb D. In vivo visualization of myelin water in brain by magnetic resonance imaging. Magn Reson Med. 1994;31:673–677. doi: 10.1002/mrm.1910310614. [DOI] [PubMed] [Google Scholar]
- 17.Nowak RD. Wavelet-based Ricien noise removal for magnetic resonance imaging. IEEE Trans Image Process. 1999;8:1408–1419. doi: 10.1109/83.791966. [DOI] [PubMed] [Google Scholar]
- 18.Henkelman R. Measurement of signal intensities in the presence of noise in MR images. Med Phys. 1985;12:232–233. doi: 10.1118/1.595711. [DOI] [PubMed] [Google Scholar]
- 19.Clarke GD. Phantom Test Guidance for the ACR MRI Accreditation Program and Phantom Site Scanning Instruction Guide. American College of Radiology; Virginia: 2000. p. 22. [Google Scholar]
- 20.Mazziotta JCTA, Evans A, Fox P, Lancaster JA. probabilistic atlas of the human brain: theory and rationale for its development. The International Consortium for Brain Mapping (ICBM) Neuroimage. 1995;2:89–101. doi: 10.1006/nimg.1995.1012. [DOI] [PubMed] [Google Scholar]
- 21.Zhou JGX, van Zijl PC, Silvennoinen MJ, Kauppinen R, Pekar J, Kraut M. Inverse T(2) contrast at 1.5 Tesla between gray matter and white matter in the occipital lobe of normal adult human brain. Magn Reson Med. 2001;46:401–406. doi: 10.1002/mrm.1204. [DOI] [PubMed] [Google Scholar]
- 22.Cremillieux Y, Ding S, Dunn JF. High-resolution in vivo measurements of transverse relaxation times in rats at 7 Tesla. Magn Reson Med. 1988;39:285–290. doi: 10.1002/mrm.1910390216. [DOI] [PubMed] [Google Scholar]
- 23.Brooks DJ, Luthert P, Gadian D, Marsden CD. Does signal-attenuation on high-field T2-weighted MRI of the brain reflect regional cerebral iron deposition? Observations on the relationship between regional cerebral water proton T2 values and iron levels. J Neurol Neurosurg Psychiatry. 1989;52:108–111. doi: 10.1136/jnnp.52.1.108. [DOI] [PMC free article] [PubMed] [Google Scholar]
- 24.Ono J, Kodaka R, Imai K, et al. Evaluation of myelination by means of the T2 value on magnetic resonance imaging. Brain and Development. 1993;15:433–438. doi: 10.1016/0387-7604(93)90083-k. [DOI] [PubMed] [Google Scholar]
- 25.Pfefferbaum A, Mathalon DH, Sullivan EV, Rawles JM, Zipursky RB, Lim KO. A quantitative magnetic resonance imaging study of changes in brain morphology from infancy to late adulthood. Arch Neurol. 1994;51:874–887. doi: 10.1001/archneur.1994.00540210046012. [DOI] [PubMed] [Google Scholar]
- 26.Hayakawa K, Konishi Y, Kuriyama M, Konishi K, Matsuda T. Normal brain maturation in MRI. Eur J Radiol. 1991;12:208–215. doi: 10.1016/0720-048x(91)90074-6. [DOI] [PubMed] [Google Scholar]
- 27.Miot-Noirault E, Barantin L, Akoka S, Le Pape A. T2 relaxation time as a marker of brain myelination: experimental MR study in two neonatal animal models. J Neurosci Methods. 1997;72:5–14. doi: 10.1016/s0165-0270(96)00148-3. [DOI] [PubMed] [Google Scholar]
- 28.Dobbing J, Sands J. Quantitative growth and development of human brain. Arch Dis Child. 1973;48:757–767. doi: 10.1136/adc.48.10.757. [DOI] [PMC free article] [PubMed] [Google Scholar]
- 29.Tower DB, Bourke RS. Fluid compartmentation and electrolytes of cat cerebral cortex in vitro. 3. Ontogenetic and comparative aspects. J Neurochem. 1966;13:1119–1137. doi: 10.1111/j.1471-4159.1966.tb04269.x. [DOI] [PubMed] [Google Scholar]
- 30.Marthur-de Vré R. Biomedical implications of the relaxation behavior of water related to NMR imaging. Br J Radiol. 1984;57:955–976. doi: 10.1259/0007-1285-57-683-955. [DOI] [PubMed] [Google Scholar]
- 31.Barkovich AJ, Kjos BO, Jackson DE, Norman D. Normal maturation of the neonatal infant brain: MR imaging at 1.5T. Radiology. 1988;166:173–180. doi: 10.1148/radiology.166.1.3336675. [DOI] [PubMed] [Google Scholar]
- 32.Dietrich RB, Bradley WG, Zagaroza EJ, et al. MR evaluation of early myelination patterns in normal and developmentally delayed infants. Am J Roentgenol. 1988;150:889–896. doi: 10.2214/ajr.150.4.889. [DOI] [PubMed] [Google Scholar]
- 33.Yakolev PI, Lecours AR. The myelogenic cycles of regional maturation of the brain. In: Minkowski A, editor. Regional development of the brain in early life. Blackwell; Oxford: 1967. pp. 3–69. [Google Scholar]
- 34.Rademacher J, Engelbrecht V, Bürgel U, Freund HJ, Zilles K. Measuring in vivo myelination of human white matter fiber tracts with magnetization transfer MR. NeuroImage. 1999;9:393–406. doi: 10.1006/nimg.1998.0416. [DOI] [PubMed] [Google Scholar]
- 35.Van der Knaap MS, Valk J. Myelin and white matter. In: Van der Knaap MS, Valk J, editors. Magnetic resonance of myelin, myelination and myelin disorders. 2 Springer-Verlag; Berlin: 1995. pp. 1–17. [Google Scholar]
- 36.Korogi Y, Takahashi M, Sumi M, et al. MR signal intensity of he perirolandic cortex in the neonate and infant. Neuroradiology. 1996;38:578–584. doi: 10.1007/BF00626104. [DOI] [PubMed] [Google Scholar]
- 37.Pouwels PJ, Brockmann K, Kruse B, et al. Regional age dependence of human brain metabolites from infancy to adulthood as detected by quantitative localized proton MRS. Pediatr Res. 1999;46:474–485. doi: 10.1203/00006450-199910000-00019. [DOI] [PubMed] [Google Scholar]
- 38.Hallgren B, Sourander P. The effect of age on the non-haemin iron in the human brain. J Neurochem. 1958;3:41–51. doi: 10.1111/j.1471-4159.1958.tb12607.x. [DOI] [PubMed] [Google Scholar]
- 39.Aoki S, Okada Y, Nishimura K, et al. Normal deposition of brain iron in childhood and adolescence: MR imaging at 1.5 T. Radiology. 1989;172:381–385. doi: 10.1148/radiology.172.2.2748819. [DOI] [PubMed] [Google Scholar]