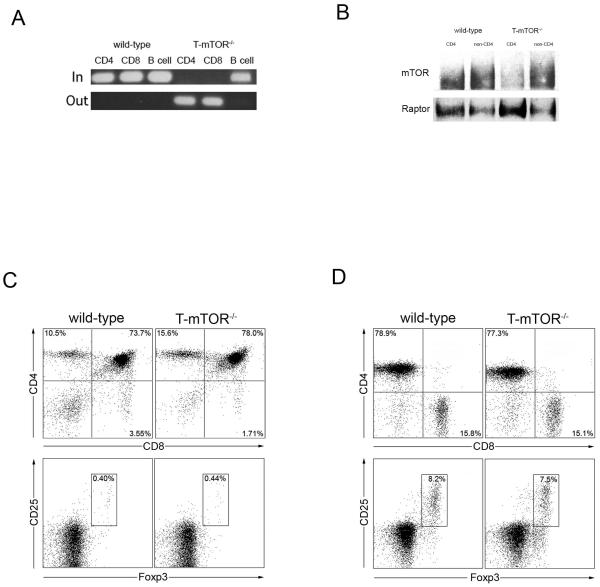
Figure 1.
Phenotypic analysis of conditional mTOR knockout mice. (A) PCR excision assay of cells from wt or T-mTOR-/- mice. “In” refers to amplification of primers confirming the presence of the gene. “Out” refers to amplification of primers confirming excision of the gene. (B) Immunoblot (IB) of mTOR in sorted populations. Raptor is included as a loading control. (C) FACS analysis of thymocytes harvested from mice. Foxp3 vs. CD25 is gated on CD4+ cells. (D) FACS analysis of splenocytes. Foxp3 vs. CD25 is gated on CD4+ cells. All data are representative of at least three independent experiments.

