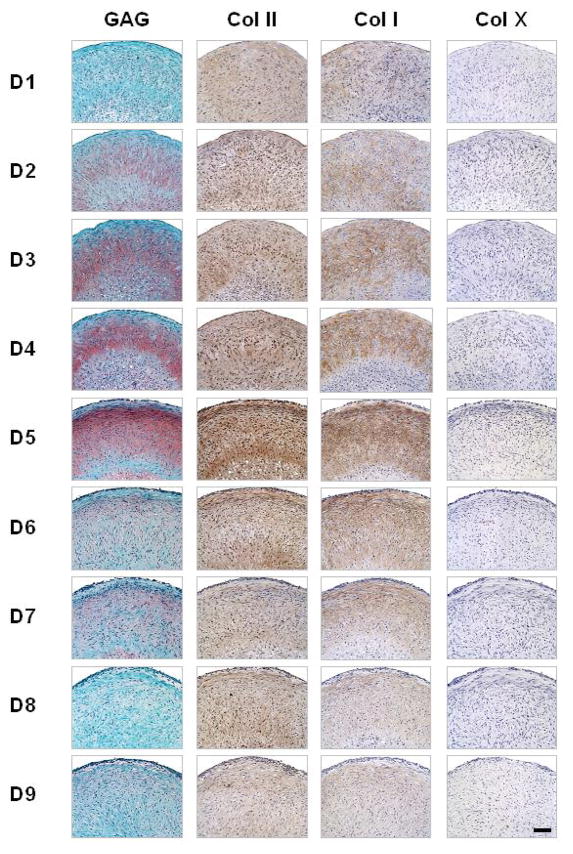
Figure 6. Effects of differentiation growth factor cocktails: histological data.
Distributions of sulfated GAG (Safranin O), type II collagen (antibody), type I collagen (antibody) and type X collagen (antibody) for the nine experimental groups (nine treatments) shown in Fig. 4. All scale bars are 100 μm.

