
Figure 5. Surface Phenotype of CD8+ T Cells Proliferating in Various Hosts.
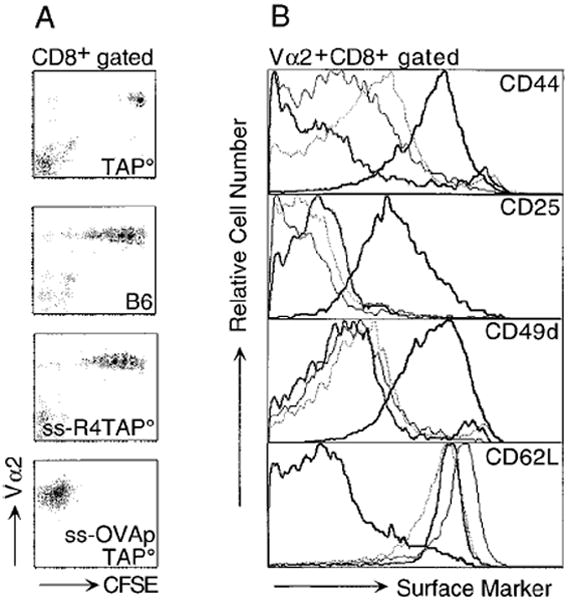
CD8+Vα2+ cells (2 × 10⁶) from OT-1 RAG° mice were CFSE labeled, injected into irradiated hosts, and splenocytes were analyzed 6 days post transfer.
(A) This panel shows Vα2 versus CFSE levels for CD8+ cells transferred into irradiated TAP°, B6, ss-R4TAP°, and ss-OVApTAP° hosts.
(B) This panel compares levels of activation markers on the transferred OT-1 CD8+ T cells. Donor cells were gated on CD8+Vα2+ from TAP° (bold gray line), B6 (thin black line), ss-R4TAP° (dotted line), and ss-OVApTAP° (bold black line). Similar results were obtained 4 and 7 days post transfer.