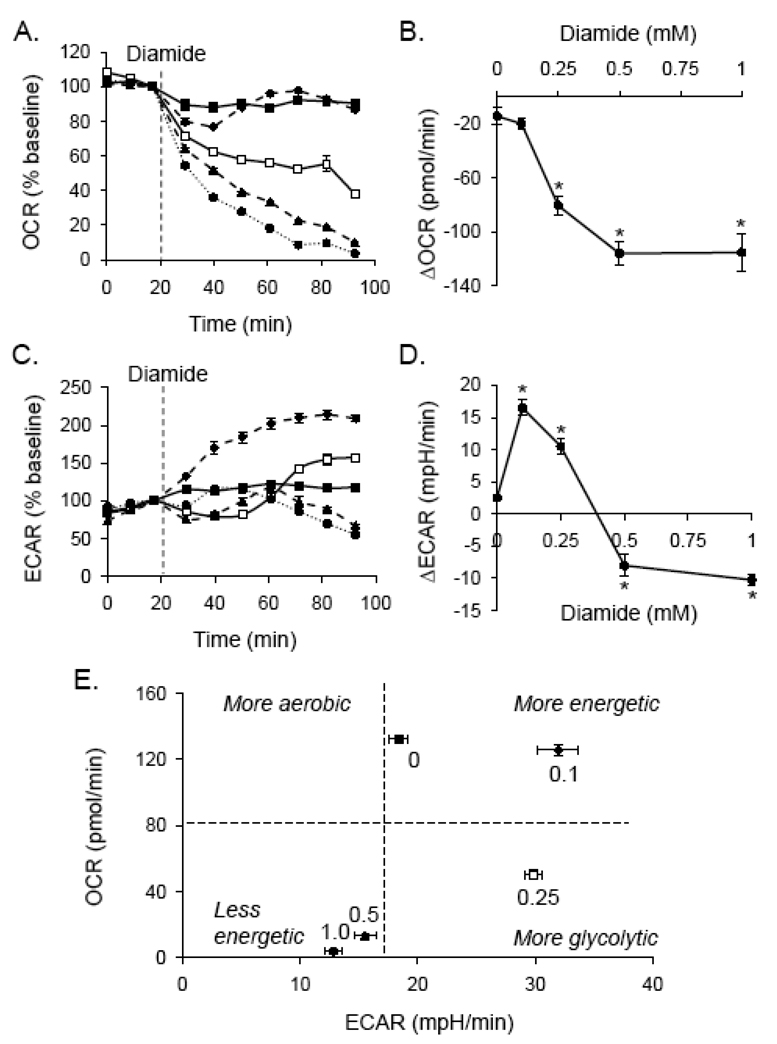
Fig. 2. Bioenergetic changes induced by protein thiolation.
Extracellular flux analyses of diamide treated cells: Baseline measurements of oxygen consumption rate (OCR; panel A) and extracellular acidification rate (ECAR; panel C) were measured. Diamide was then injected where indicated to 0 (closed squares), 0.1 (diamonds; dashed line), 0.25 (open squares), 0.5 (triangles; dashed line), or 1.0 (circles; dotted line) mM final concentrations. Shown in panels A and C are the OCR and ECAR expressed as a percentage of baseline. (B and D) The changes in OCR (panel B) and ECAR (panel D) at the last time point measured are shown as a function of diamide concentration. N = 4 per group, *p < 0.05 vs. cells not treated with diamide. (E) Metabolic profile of diamide-treated cells: The last time point of OCR and ECAR measurements in panels A and C, respectively, were used to construct a 2D plot of bioenergetic function. The numbers above each point indicate the concentration of diamide (in mM).

