

Abstract
Transgenic (Tg) mouse models of Parkinson’s disease (PD) generated to date have primarily been designed to overexpress human alpha-synuclein (α–syn) to recapitulate PD-like motor impairments as well as PD-like nigro-striatal degeneration and α–syn pathology. However, cognitive impairments and cortical α–syn pathology also are common in PD patients. To model these features of PD, we created forebrain-specific conditional Tg mice that overexpress human wild type (WT) or A53T mutant α–syn. Here we show that both WT and A53T mutant α–syn lead to massive degeneration of postmitotic neurons in the hippocampal dentate gyrus (DG) during postnatal development, with hippocampal synapse loss as evidenced by reduced levels of pre- and postsynaptic markers. However, when mutant and WT α–syn expression was repressed until the Tg mice were mature postnatally and then induced for several months, no hippocampal neuron loss was observed. These data imply that developing neurons are more vulnerable to degenerate than mature neurons as a consequence of forebrain WT and mutant α–syn overexpression.
Keywords: α -synuclein, Parkinson’s disease, conditional transgenic mouse, hippocampus, dentate gyrus, postnatal development
Introduction
Parkinson’s disease (PD) is the most common neurodegenerative movement disorder and it is characterized clinically by tremor, rigidity and postural instability. However, cognitive impairments also occur in PD and this may lead to dementia as the disease progresses (Aarsland et al., 2008;Mayeux et al., 1981;Starkstein et al., 1989;Stern et al., 1993). PD patients frequently develop cognitive impairments after the onset of motor symptoms, but in some PD patients, cognitive impairments and dementia may precede movement abnormalities. Depending on the timing of the motor or cognitive impairments, patients may be assigned with a clinical diagnosis of Parkinson’s disease with dementia (PDD), or dementia with Lewy bodies (DLB) (Goldmann et al., 2008;Lippa et al., 2007). Despite clinical differences between PDD and DLB, growing evidence supports the view that they may represent a spectrum of the same disease, which is linked to pathological accumulations of alpha-synuclein (α–syn) primarily in neurons as Lewy bodies (LBs) or in their processes as Lewy neurites (LNs) (Aarsland et al., 2009;Goldmann et al., 2008;Lippa et al., 2007).
Normally, α–syn is localized mainly in synapses where it is thought to function in the regulation of synaptic transmission, neuronal plasticity, synaptic vesicle release, and folding/refolding of other proteins (Abeliovich et al., 2000;Cabin et al., 2002;Chandra et al., 2005;George et al., 1995;Murphy et al., 2000). However, α–syn knockout mice do not show major central nervous system (CNS) abnormalities, although subtle synaptic deficits have been reported (Abeliovich et al., 2000). On the other hand, abnormal accumulations of α–syn as LBs and LNs are pathological hallmarks of sporadic PD and other related disorders (reviewed in Lee and Trojanowski, 2006). Moreover, point mutations (A53T, A30P, and E46K) or duplications/triplications of the α–syn gene cause autosomal dominantly inherited familial PD with α–syn neuropathology indistinguishable from sporadic cases (Farrer et al., 2004;Kruger et al., 1998;Polymeropoulos et al., 1997;Singleton et al., 2003;Zarranz et al., 2004). Biochemical studies have shown that some of these mutant forms of α–syn accelerate α–syn fibrillization, and α–syn amyloid fibrils are the major constituents of LBs and LNs (Conway et al., 1998;Giasson et al., 1999;Narhi et al., 1999). However, the mechanisms whereby the accumulation of α–syn fibrils or oligomers in LBs and LNs leads to neurodegeneration in PD is not completely understood and the underlying neuropathology that accounts for dementia in PD is controversial (Forman et al., 2005;Goedert, 2001;Goldberg and Lansbury, 2000;Kostka et al., 2008;Kramer and Schulz-Schaeffer, 2007;Spillantini et al., 1997;Volles et al., 2001;Zakharov et al., 2007).
To elucidate mechanisms of α–syn mediated neurodegeneration in PD, a number of different α–syn transgenic (Tg) mice have been generated to model the clinical and pathological features of this disorder (Fernagut and Chesselet, 2004;Giasson et al., 2002;Kahle, 2008;Lee et al., 2002). Studies of these α–syn Tg mouse models have revealed that overexpression of α–syn (especially the A53T α–syn mutant) recapitulates several key aspects of PD including a progressive motor deficit, accumulations of LB-like and LN-like α–syn inclusions or aggregates as well as neuron loss, although for reasons that remain enigmatic, the substantia nigra is largely spared in nearly all Tg mice reported to date (Fernagut and Chesselet, 2004;Kahle, 2008). Moreover, most of the α–syn transgenic mice reported so far did not model cognitive impairment of PDD or DLB.
For these reasons, we generated conditional Tg mice that overexpress human wild type (WT) or A53T mutant α–syn in forebrain neurons under the control of CaMKIIα–tTA. Here we report that overexpression of both human WT and A53T α–syn in forebrain leads to severe neuron loss in the hippocampal dentate gyrus (DG) during postnatal development, although A53T α–syn caused more severe neurodegeneration. Interestingly, this cell loss was observed mainly in postmitotic neurons, but not in progenitor cells of the postnatal hippocampus. We also detected hippocampal synapse loss in our Tg mice as evidenced by changed levels of several synaptic proteins. However, little or no neuron loss occurred in the DG when α–syn expression was repressed during development and then induced in the mature mice for six months. Thus, these WT and mutant human α–syn Tg mouse models allow us to separately investigate mechanisms of aging-related versus developmental consequences of α–syn expression in the murine forebrain.
Materials and Methods
Generation of Tet-off Mutant and WT α–syn Tg Mice
We generated α–syn Tg responder lines (tetP-WTα–syn and tetP-A53Tα–syn) by cloning human WT and A53T mutant α–syn cDNA into XhoI site of 9.3kb PrPtetP vector that contains the tetracycline promoter and two exons, one intron and original 3’UTR of the moPrP.XbaI vector (Jankowsky et al., 2005). Not I digested linear fragment containing α–syn cDNA, was used as a transgene to generate Tg mice on C57Bl/C3H background by Transgenic and Chimeric Mouse Facility of the University of Pennsylvania. Founder mice were identified by Southern blot analysis using standard procedures. Stable Tg lines carrying the WT- (lines 3, 7) or A53T α–syn (lines 9, 33) were established and offsprings were genotyped by PCR analysis of tail DNAs.
The Tg activator line expressing tetracycline-controlled transactivator (tTA) under the control of CAMKIIα promoter (CaMKIIα–tTA) has been described previously (Mayford et al., 1996). The α–syn Tg responder lines (tetP-WTα–syn and tetP-A53Tα–syn) were crossed to Tg activator line (CaMKIIα–tTA), and F1 offsprings were used for experimental analysis. Four genotyping nomenclature of these F1 offspring are abbreviated as following in this paper for simplicity: nTg (CaMKIIα–tTA−/−; tetP-α–syn−/−), α–syn (CaMKIIα–tTA−/−; tetP-α–syn+/−), tTA (CaMKIIα–tTA+/−; tetP-α–syn−/−), and tTA/α–syn (CaMKIIα–tTA+/−; tetP-α–syn+/−), and α–syn can indicate either WTα–syn or A53Tα–syn if it is not specifically indicated.
All housing and breeding of the animals were performed in accordance with the NIH Guide for the Care and Use of Experimental Animals and approved by the University of Pensylvania Institutional Animal Care and Use Committee.
Doxycycline Treatment
To suppress the Tg expression (tet-off system), mice were fed with chow containing 200 mg/kg of doxycyline to the selected cohorts of Tg mice from the observed date of insemination for pre-determined lengths of time.
SDS-PAGE and Immunoblot Analysis
Mice were first lethally anesthetized with an intraperitoneal injection of Ketamine (0.1 mg/g body weight) and Xylazine (0.01 mg/g body weight), and perfused with PBS. For comparison of α–syn protein expression levels between different Tg lines, total forebrain tissue containing cerebral cortex and subcortical areas was dissected out, homogenized in 2% SDS/50 mM Tris (pH 6.8) by sonication, heated to 100°C for 10 min and centrifuged at 100,000 × g for 20 min (n=2 for nTg and single Tg, n=3 for bigenic mice of each line). For Tg α–syn expression level analysis in different brain regions, the brain was dissected to separate out the olfactory bulb, cerebral cortex, hippocampus, subcortical areas (including the basal ganglia, diencephalon and related structures), cerebellum, and brain stem (n=2). For verification of Tg α–syn repression by doxycycline, P21 total brain lysates from mice treated or untreated with doxycycline (200mg/kg) were used (n=2). For comparative analysis of phosphorylated histone 3 (p-H3) and cleaved caspase-3 level (n=2) as well as for synaptic marker expression level analysis (n=2, duplicate~quadruplicate blots), hippocampal lysates were separately prepared by homogenizing in 2% SDS, 50 mM Tris HCl (pH 6.8).
Protein concentrations of each sample were determined by BCA assay (Pierce, Rockford, IL) so that 10–20 µg of protein/sample were subjected to 12% SDS PAGE and then transferred onto nitrocellulose membranes for immunoblot analysis after incubating the membranes with primary antibodies at 4° C overnight. The previously described mouse monoclonal antibody (Mab), LB509 (1:1000), and rabbit polyclonal antibody, SNL-1 (1:2000), were used to detect α–syn, while antibodies specific for p-H3 (1:300, Millipore) and cleaved caspase-3 (1:200, cell signaling) were used to detect proliferating cells and apoptotic cells respectively, and an alpha-tubulin (α–Tub) Mab (1:2000~5000) (SantaCruz, CA) was used to detect tubulin as a loading control. For synaptic markers, monoclonal antibodies against PSD95 (1:500, Affinity Bioreagent), drebrin (1:500, Novus Biologicals), synaptophysin (1:5,000, Abcam), syntaxin (1:5,000, Millipore), SNAP25 (1:10,000, Santacruz) and synaptobrevin 2 (1:10,000, Synaptic Systems), and rabbit polyclonal antibody against synapsin I (1:10,000, Invitrogen) were used. Appropriate secondary antibodies conjugated with HRP (horse radish peroxidase) (Jackson Immuno Research, West Grove, PA) were used to detect each primary antibody. The nitrocellulose membranes were developed with Renaissance Enhanced Lumino Reagents (PerkinElmer Life Sciences). Digital images were acquired using a Fuji Film Intelligent Darkbox II (Fuji Systems, Stemford, CT). Quantification of band intensity was performed using Image Quant software (Molecular Dynamics).
Immunohistochemstry and Histological Staining
Mice were lethally anesthetized as described above and perfused with PBS to wash out blood after which the brains were removed from the skull and fixed overnight in 10% neutralized buffered formalin (NBF, Fisher Scientific) or 70% ethanol/150 mM NaCl. After washing with 0.1 M Tris (pH 7.6) /150 mM NaCl, fixed brains were cut into 2 mm-coronal sections and placed into plastic tissue cassettes for paraffin embedding. Briefly, tissue samples were dehydrated through a series of graded ethanol solutions (70%, 80%, 95%, 100%) to xylene at room temperature, infiltrated with paraffin at 60°C using Shandon automatic processing machine and then the paraffin tissue blocks were cut into near serial sections ~7 um thick.
Immunohistochemistry was conducted with paraffin embedded brain sections (coronal) (n=3~4 bigenic mice, n=1~2 control litter mate for each experiment). Briefly, after deparaffinization and hydration (100%, 95%, 80%, 70% ethanol), the sections were incubated with 5%H2O2/Methanol for 30 min, blocked with 2%FBS/0.1 M TrisHCl (pH 7.6) or 2%FBS/0.1M TrisHCl (pH 7.6) /0.1%Triton X-100, incubated with primary antibodies at 4°C overnight followed by incubation with secondary antibody conjugated with biotin (Vector Lab) at room temperature for 1 hr, and incubated with preformed reagent A (avidin DH) and reagent B (biotinylated horse radish peroxidase H) complex (Vector Lab) at room temperature for 1 hr. The signal was detected with commercially available HRP substrate 3, 3’- diaminobenzidine (DAB) (Vector Lab). The primary antibodies used in this study are anti–syn Mab Syn303 (1:10,000), human specific anti-α–syn Mab LB509 (1:2000), anti-phosphorylated histone3 (p-H3) (1:1,000, millipore), anti-cleaved caspase-3 (1:400, Cell Signaling), anti-GFAP (1:10,000, DAKO North America), anti-synapsin I (1:200, Invitrogen), anti-synaptophysin (1:300, Abcam) and anti-syntaxin (1:2,000, Millipore). For NBF fixed tissues, antigen retrieval was performed before the blocking step by heating the sections at 99°C in 0.01 M citric acid for 10 min as previously described (Lim and Golden, 2002). For hematoxylin/eosin staining and thioflavin S staining, standard protocol was used (n=3). Images of stained sections were captured with Olympus DP software using Olympus DP71 camera attached to an Olympus BX51 microscroscope.
Immunoflourescence Staining
NBF fixed and paraffin embedded brain sections (coronal) (n=2~3) were used for double-label immunofluorescence staining as previously described. Primary antibody against Prox1 (prospero-related homeobox protein 1) (1:2000, Millipore) was used to label cells in the DG. For double staining, anti-nestin antiserum 130 (1:1,000) (Dahlstrand et al., 1992) and anti-neuN antibody (1:1000, Millipore) were used to label progenitor cells and postmitotic neurons, respectively. Appropriate secondary antibodies conjugated with Alexa-488 or Alexa-594 were used for detecting primary antibodies as described (Lim et al., 2005).
Thioflavin S staining
Results
Generation of Conditional Tg Mice Overexpressing Human WT and A53T α–syn
To create conditional mouse models of α–syn inclusion and other neuropathological features of PDD and DLB, we generated responder Tg lines (tetP-WTα-syn or tetP-A53Tα-syn) that contain human WT or mutant (A53T) α–Syn cDNAs under the control of tetracycline responsive promoter (tetP) (Fig 1A). Next, Tg α–syn expression was activated by crossing these responder lines with an activator line (CaMKIIα-tTA) that expresses tTA under the control of CaMKIIα promoter (Fig 1A). Here, we designate those F1 progeny of this cross as nTg (non-Tg), α-syn (α-syn single Tg, WTα-syn or A53Tα-syn), tTA (tTA single transgenic), and tTA/α-syn (bigenic, tTA/WTα-syn or tTA/A53Tα-syn). tTA is a transcriptional activator that can bind to tetP (Gossen and Bujard, 1992;Jankowsky et al., 2005). Thus, only bigenic mice that contain both CaMKIIα-tTA and tetP-α–syn are expected to express the α-syn transgene in the forebrain, since CaMKIIα promoter is active mainly in the forebrain, albeit not exclusively. This tTA driven α-syn expression could be effectively turned off by treating mice with doxycyline which prevents tTA from binding to tetP promoter (Mayford et al., 1996) (Fig 1A).
Figure 1. Expression of WT- or A53Tα–syn in conditional Tg mice.

A, To generate conditional Tg mice (tTA/WTα–syn, or tTA/A53Tα–syn), Tg activator line (CaMKIIα–tTA) was crossed with responder line (tetP-WTα–syn, or tetP-A53Tα–syn). Doxycycline (dox) prevents tTA from binding to tetP thus repressing Tg expression (tet-off). B, Immunoblot analyses of α–syn expression in four different Tg lines (lines 3 and 7 for WTα–syn, lines 9 and 33 for A535α–syn) (n=3). 20 µg of total forebrain lysates prepared from cortical and subcortical tissues (6 week-old), were used to detect α–syn with LB509 (specific for human α–syn) and SNL-1 (specific for human and mouse α–syn) antibodies. α-tubulin (α–Tub) was used for an internal loading control. PrP-α–syn mice (line M83) (Giasson et al., 2002) were used as positive controls. C, Immunoblot analyses of α–syn expression in different brain regions. Six different brain regions were dissected out from nTg, tTA/WTα–syn and tTA/A53Tα–syn mice (postnatal day 21, P21), and their lysates (20 µg per lane) were compared for α–syn expression using LB509 and SNL-1 antibodies. OB, olfactory bulb; CTX, cerebral cortex; HP, hippocampus; SubCtx, subcortical regions (basal ganglia, thalamus, hypothalamus etc); CBL, cerebellum; BS, brain stem.
Out of multiple tetP-WTα-syn and tetP-A53Tα-syn founder lines, we selected two independent lines for each tetP-WTα-syn and tetP-A53Tα-syn based on the highest levels of transgene products when crossed with CaMKIIα-tTA (Fig 1B). Lines 3 and 7 were selected among WTα–syn expressing lines, while lines 9 and 33 were chosen among A53Tα–syn lines. Based on immunoblot analyses of the total forebrain lysates probed with SNL-1, which detects both mouse and human α-syn, tTA/WTα-syn lines (line 3, 7) express approximately two to three fold above the level of endogenous mouse α-syn, whereas tTA/A53Tα-syn lines (line 9, 12) express two to five fold (Fig 1B). Moreover, immunoblot results of total forebrain lysates detected with LB509 (total forebrain lysates), which only recognizes human α-syn, showed that tTA/WTα-syn lines express three to four fold more Tg α-syn compared to that of previously generated Tg mouse expressing A53Tα-syn (line M83) under PrP promoter (Giasson et al., 2002), whereas tTA/A53Tα-syn lines express three to five fold more. α-syn single Tg mice (WTα-syn or A53Tα-syn) lacking the activator transgene showed very weak α-syn expression suggesting that there is low level of “leakiness” with a basal level of tetP activity even without tTA (Fig 1B, Fig 3I). For further analyses, we used line 7 and line 33 for tTA/WTα-syn and tTA/A53Tα-syn, respectively.
Figure 3. α–syn overexpression leads to massive reduction in number of neuronal cells in the hippocampal dentate gyrus (DG).
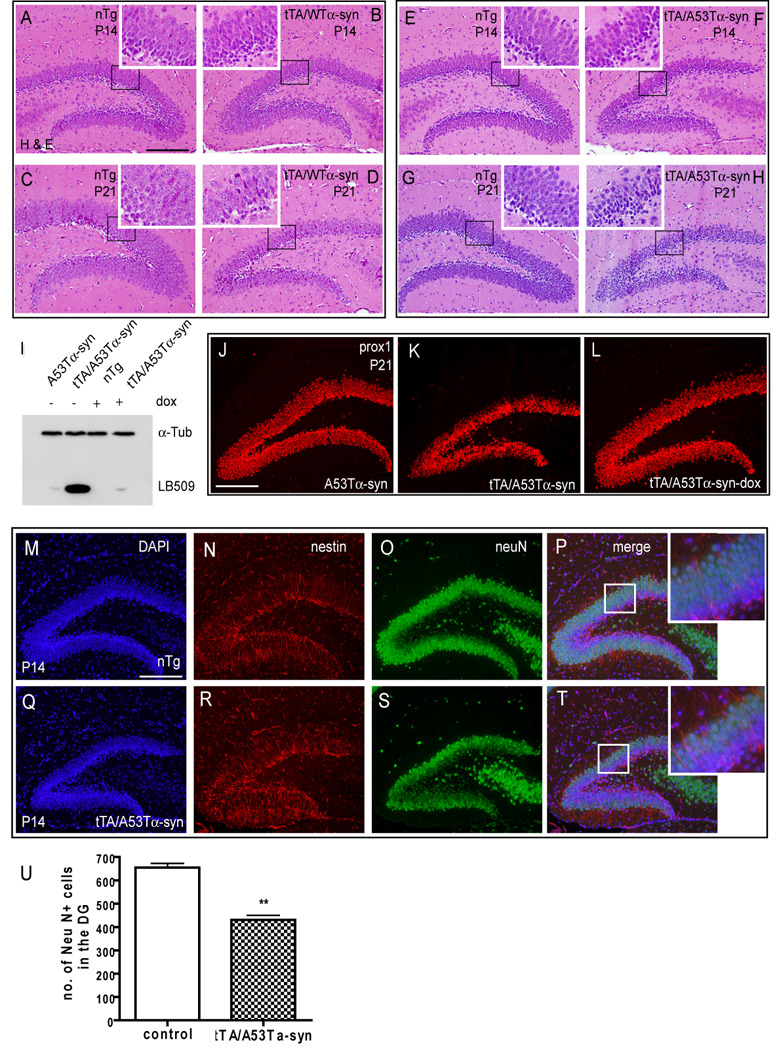
A–H, Hematoxylin and eosin (H & E) staining of coronal sections of the hippocampal DG at P14 (A,B,E,F) and P21 (C,D,G,H). At P14, tTA/A53Tα–syn (F) mice show mild atrophy in the DG compared to nTg littermates (E). At P21, severe atrophy in the DG was observed in both tTA/WTα–syn (D) and tTA/A53Tα–syn (H) mice compared to nTg littermates (C,G). Each inset is a magnified image of black boxed area. I, Immunoblot showing α–syn expression in tTA/A535α–syn mice at P21 (total brain lysates) with or without doxycycline (dox) treatment (E0.5~P21) compared to littermate control. J–L, Prox1 immunostaining of the DG (P21) in A53Tα–syn (J), tTA/A53Tα–syn (K), and tTA/A53Tα–syn-dox (dox treated from E0.5~P21) (L) mice. M–T, Double immunofluorescent staining of nTg (M–P) and tTA/A535α–syn (Q–T) DG sections (P14) with nestin (N,R) and neuN (O,S) antibodies. Insets in merged images (P,T) are magnified images of boxed areas. DAPI staining was used for nuclear counter staining (M,Q). U, Quantification of NeuN staining (P14) in the DG as shown in O, S (n=2~3, **p < 0.01 two tail t test). Scale bars in A, J, M = 100 µm.
Analysis of Tg α–syn Expression in Conditional tTA/α-syn Mice
To characterize regional expression of α–syn protein in these Tg mouse lines, brains of tTA/WTα-syn (line7) and tTA/A53Tα-syn (line33) mice (P21) were dissected into olfactory bulb, cerebral cortex, hippocampus, subcortical areas (including basal ganglia, diencephalon and related structures), cerebellum, and brain stem. Total protein was extracted from these brain tissue samples and subsequently examined by immunoblots to detect α–syn, using antibodies, LB509 and SNL-1. As expected from the known forebrain enriched tTA expression pattern driven by CaMKIIα promoter, Tg α–syn expression was mainly detected in the forebrain including olfactory bulb, cerebral cortex, hippocampus, subcortical areas, although smaller amounts of Tg human α–syn also were detected in the cerebellum, brain stem, and spinal cord (Fig 1C and data not shown for the spinal cord) (for CaMKIIα expression pattern, refer to the Allen Brain Atlas (http://www.brain-map.org/).
We next performed immunohistochemical analysis of human α–syn expression in different regions of the brain over a range of ages (i.e. P1, P7 and P14). Compared to littermate controls, tTA/A53Tα–syn Tg mice show strong α–syn immunoreactivity detected with syn303 and LB509 in the olfactory bulb, cortex, striatum, hippocampus, dentate gyrus, thalamus, substantia nigra, and ventral tegmental area at P14 (Fig 2A–2I). Similar pattern of Tg α–syn expression was detected in tTA/A53Tα–syn mice when examined at P1 (Fig 2L, 2N) and P7 (Fig 2P, 2R), whereas no or little expression was detected in littermate controls, either nTg (Fig 2K, 2M) or A53Tα–syn single Tg (Fig 2O, 2Q) mice. Consistent with our immunoblot data, very little human α–syn was detected in the cerebellum and brain stem of these bigenic mice (Fig 2B, 2J). Human α–syn immunoreactivity in the DG was detected in all cell layers including inner most cell layers, the subgranular zone (SGZ), where progenitor cells reside in, and outer cell layers where differentiated neurons are located (Fig. 2P). tTA/WTα–syn mice showed similar Tg α–syn expression pattern to that of tTA/A53Tα–syn mice (data not shown).
Figure 2. Immunohistochemical characterization of α–syn expression in conditional Tg mice (tTA/A53Tα–syn).

A, B, Representative coronal sections at five different levels of nTg (A) and tTA/A53Tα–syn (B) brains (postnatal day 14, P14) were stained with Syn303 antibody (brown) to detect α–syn. From left to right is anterior to posterior order, and the three sections in the top row are anterior to the bottom sections. Each letter in B indicates the area of image taken in C–J, roughly, but some of the images in C–J were not taken directly from the sections shown in B, but from sections at similar levels. Hematoxylin staining (blue) was used for nuclear counterstaining hereafter unless mentioned otherwise. C–J, α–syn expression in olfactory bulb (C), cortex (D), striatum (E), CA1 of the hippocampus (F), thalamus (G), ventral tegmentum area (H), substantia nigra (I) and cerebellum (J) of P14 tTA/A53Tα–syn mice. K–N, α–syn expression in the coronal sections of the hippocampal area of P1 mice using MAbs Syn303 (K, L) and LB509 (M,N). α–syn expression is prominent in tTA/A53Tα–syn mice (L, M) compared to nTg mice (K,M). O–R, α–syn expression in the coronal sections of hippocampal dentate gyrus (O,P) and CA1 (Q,R) of A53Tα–syn (O,Q) and tTA/A53Tα–syn (P,R) P7 mice. White arrows in P indicate α-syn positive cells in the inner cell layer (SGZ, subgranular zone), whereas black arrows indicate α-syn positive cells in the outer layer of the DG. OB, olfactory bulb; VTA, ventral tegmentum area; SN, substantia nigra; DG, dentate gyrus; CA1, Cornu Ammonis 1; CA3, Cornu Ammonis 3; SGZ, subgranular zone. Scale bar in B = 500µm, C~R= 20 µm
Human α–syn Overexpression Causes Postmitotic Hippocampal DG Neuron Degeneration but Proliferating Cells are spared
To investigate the effect of human α–syn overexpression in the forebrain, we first analyzed histology using hematoxylin and eosin (H&E) staining. Early postnatal brains (P1, P7) did not show any morphological differences when the four genotypes (nTg, α–syn, tTA and tTA/α–syn) were compared (data not shown), despite the fact that human α–syn is expressed at this stage in tTA/α-syn mice (Fig 2L, N, P, R). Consistent with H&E staining results, Prox1 (prospero-related homeobox domain transcription factor, which labels DG neurons but not other hippocampal neurons) staining at early postnatal stages (P1~P7) did not show any differences between control and bigenic mice (data not shown). However, by postnatal day 21 (P21), striking atrophy was observed in the DG neurons of both tTA/WTα–syn (Fig 3C, 3D) and tTA/A53Tα–syn mice (Fig 3G, 3H and see Fig 3J, 3K for Prox1 staining). In addition, mild atrophy was also detected at P14 in tTA/A53Tα-syn mice (Fig 3E, F). These results show that the DG development is normal until P7 (in tTA/A53Tα–syn) or P14 (in tTA/WTα–syn), but is disturbed at later time point in the bigenic mice. Considering that the DG development begins at late embryonic stages and completes around P21(Altman and Das, 1965), our data suggest that Tg α–syn expression does not disturb the initial formation of the DG but does affect the maturation step.
To confirm that DG atrophy is due to human α–syn expression rather than to some unknown or non-specific effects in the bigenic mice, we suppressed human α–syn Tg expression by treating selected Tg mice with doxycycline chow (200mg/kg food, E0.5~P21). First, we verified with immunoblot analysis that doxycycline successfully repressed human α-syn expression in the brain (Fig 3I). When the DG was examined at P21 with an antibody against Prox1 the DG atrophy was not detected in tTA/A53Tα-syn mice treated with doxycycline (compare Fig 3J, 3K, 3L).
Next we examined whether α–syn-mediated neuron loss occurred in a specific subpopulation of DG cells. Both proliferating progenitor cells and postmitotic neurons are present in the developing DG and are labeled by the specific markers i.e. nestin and neuN, respectively. Nestin immunostaining on DG cells of tTA/A53Tα-syn mice was comparable to that of the non-Tg controls at P14, indicating that the number of progenitor cells is not changed (Fig 3N, 3R). However, the number of neuN positive cells in tTA/A53Tα–syn mice was significantly reduced thereby implying that the survival of postmitotic neurons was compromised (Fig 3O, 3S, 3U). This loss of postmitotic neurons was abrogated when bigenic mice were treated with doxycycline to suppress expression of human α-syn (data not shown).
DG Neuron Loss in tTA/A53Tα-syn Mice is Due to Cell Death, not Decreased Cell Proliferation
Since DG neuron loss in conditional Tg mice could be attributed to either decreased generation of progenitor cell pools, or increased cell death, we investigated the level of cell proliferation and cell death with antibodies against phosphorylated histone 3 (p-H3) and cleaved-caspase 3 (cleaved-cas 3), respectively. During embryonic and early postnatal stages (E17.5, P1, P7), p-H3 immunoreactivity in the DG of the tTA/A53Tα–syn mice did not show any decrease compared to that of the nTg littermate, suggesting that proliferation in bigenic mice was comparable to control animals (Fig 4A, B and data not shown). This result was persistent even in DG from P14 (Fig 4C, 4D) and immunoblot with P21 hippocampal lysates also showed no reduction in p-H3 level in the tTA/WTα-syn or tTA/A53Tα-syn mice (Fig 4H). Taken together, these data indicate that cell proliferation is not defective in tTA/A53Tα-syn mice even when reduction in cell number was detected.
Figure 4. Increased DG neuron death, not decreased proliferation, is responsible for reduced number of neuronal cells in tTA/A53Tα–syn mice.

A–D, Immunostaining of hippocampal sections using an antibody against phosphorylated-histone 3 (p-H3), mitosis marker. Both at E17.5 (A,B) and P14 (C,D), the number of p-H3 positive cells is not decreased in tTA/A535α–syn (B,D) compared to littermate control (A,C). E–F, Immunostaining of DG sections (P14) with antibody against cleaved-caspase 3, apoptotic marker. The number of cleaved-cas 3 positive cells is increased in tTA/A53Tα–syn (F) compared to littermate control (E). Note the distribution of cleaved-cas 3 positive cells in tTA/A53Tα–syn (arrows in the inset in F) is not limited to the subgranular zone where normal apoptotic cells (arrows in the inset in E) are observed in littermate control. At P7, no differences in cleaved-cas 3 staining were detected between tTA/A53Tα–syn and littermate control (data not shown). G, Quantification of cleaved-cas3 positive cells in the same level of the DG sections from bigenic mice and littermate controls (two representative sections from three animals each). H, Immunoblot analyses using hippocampal lysates (P21) probed with p-H3 and cleaved-cas3 antibodies. α–Tub was used for loading control.
Scale bars in A, C = 100 µm; E=20 µm.
In contrast to p-H3, cleaved-cas 3 positive cells were increased in tTA/A53Tα-syn mice compared to nTg littermates when examined at P14, indicating there is increased cell death (Fig. 4E, 4F and 4G for quantification). Consistent with this result, immunoblot with hippocampal lysates (P21) both from tTA/WTα-syn and tTA/A53Tα-syn showed increased cleaved cas-3 level compared to the control mice (Fig 4H). During development, normal apoptotic cell death is usually detected in cells localized in the inner layer of the DG, where progenitor cells are located (arrows in Fig 4E). However, in tTA/A53Tα-syn mice, cleaved-cas 3 staining was also detected in the cells residing in the outer layer of the DG (arrows in Fig 4F), where postmitotic neurons are present, suggesting that postmitotic cells are undergoing cell death. At earlier stage (P7), we did not detect any differences in cleaved-cas 3 staining between bigenic and control mice (data not shown).
Since neuron death is associated with gliosis, we examined sections of hippocampus to determine if there is any gliosis in the DG using antibodies to GFAP, a marker of astrocytes and gliosis. GFAP staining of the tTA/A53Tα–syn mice showed increased gliosis near the DG thereby supporting the observation of massive DG neuron death (data not shown).
Pre- and Post-synaptic Proteins are Reduced in tTA/ A53T α–syn Mice
Our finding that α–syn-mediated neuron loss is limited to postmitotic neurons in the DG of the hippocampus indicates that postmitotic neurons are more vulnerable to α–syn-mediated toxicity compared to proliferating progenitors in the same region. This suggests that α–syn overexpression impairs survival of immature postmitotic neurons, but not of proliferating cells. Since synapse formation/maintenance is critical to neuronal survival, we examined if synaptic protein levels are affected in tTA/ A53Tα-syn mice. We monitor the levels of seven known synaptic proteins including postsynaptic proteins-PSD95 and drebrin-, presynaptic proteins-synapsin, synaptophysin-, and three SNARE proteins-syntaxin, synaptobrevin, SNAP25 (Fig 5). Immunoblot analysis of hippocampal lysates showed significant reductions in these markers at P21, except SNAP 25 and synaptobrevin (Fig 5A, B). At P14, the levels of PSD95, drebrin and synapsin were reduced. However, at P7, no significant changes were detected in most of these proteins. Quantification revealed that postsynaptic proteins (PSD95 and drebrin) were reduced more dramatically than presynaptic proteins (synapsin and synaptophysin), whereas SNARE proteins (syntaxin and SNAP25), except synaptobrevin, were hardly affected. The results from two different tTA/αSyn mice of each time point were normalized to those from controls, and two to four immunoblots were used for quantification of each protein. The timing of synaptic protein reduction correlates with DG cell loss, since we started to detect cell death at P14 (Fig 4).
Figure 5. Synaptic proteins are reduced in the tTA/A53Tα–syn hippocampus.

A, Representative immunoblot results comparing synaptic protein levels between tTA/A535α–syn mice and littermate controls, at P7, P14 and P21. α–Tub was used for internal loading control. B, Quantification of synaptic protein levels from the immunoblots. Duplicate~quadruplicate immunoblots were used for quantification and band intensity of each protein was corrected relative to that of α–Tub in the same blot. Data are shown as Mean ± SEM (nTg, n=2~4; tTA/A53Ta-syn, n=4~8; *p < 0.05, **p < 0.01, ***p < 0.005 two tail t test)
Reductions in synaptic proteins were also observed in our immunostaining studies in the mossy fibers (Fig. 6). Mossy fibers are enriched axonal terminals of granule cells in the DG projecting to cells in CA3. We detected reduced immunoreactivity of synapsin, synaptophysin, and syntaxin in tTA/α–syn mice compared to littermate controls at P14 (data not shown), and these changes were more prominent at P21 (Fig 6A – H). These results are consistent with immunoblot data, except syntaxin which do not show significant level changes in immunoblot. Interestingly, we also detected slight decreases in the immunostaining of synapsin, synaptophysin and syntaxin at P7 (data not shown), when no significant reductions in their overall protein level were observed in immunoblots (Fig 5A, 5B). Taken together, these findings suggest that α–syn overexpression reduces the levels of PSD95, drebrin, synapsin, synaptophysin and syntaxin in the hippocampus, and may perturb the normal distribution of these proteins in synaptic terminals.
Figure 6. Axonal terminals of the DG cells are disrupted in the tTA/A53Tα–syn mice.

A–H, Immunostaining of hippocampal sections with antibodies against synapsin (A–D), synaptophysin (E,F) and syntaxin (G,H) at P21 A, B, Low magnification images showing hippocamal CA1, CA2, CA3 areas and the DG. Mossy fibers are axonal terminals of the DG granule cells projecting to CA3. White boxes indicate areas where images in C–H were taken (lower magnification images of E–H are not shown). C–H, High magnification images showing mossy fibers in the striatum-lucidum area stained with synapsin (C,D), synaptophysin (E,F), and syntaxin (G,H) antibodies. tTA/A535α–syn sections (D,F,H) show reduced level of mossy fiber staining compared to littermate controls (C,E,G). Scale bars in A= 100 µm, C=20 µm.
Human α–Syn Mediated Massive DG Neuron Loss is Restricted to the Developmental Period
In order to test if massive cell loss in DG continues in the adult, or stops after completion of development, we treated tTA/α-syn mice with doxycycline from E0.5 until P21, and then allowed them to survive until 6 months without doxycyline. This experiment was designed to allow expression of α-syn once DG development was completed, so we could examine the histology of the mature DG (Fig 7). Interestingly, we did not detect massive cell loss in the DG of these tTA/α-syn mice compared to litter mate controls (Fig 7E, 7F). This result is different from that of age-matched bigenic mice without doxycycline treatment that expressed α–syn throughout their lifespan and exhibit neuron loss (Fig 7D). In those tTA/α-syn mice without doxycycline treatment, severe cell loss in the DG was observed compared to littermate controls (Fig 7A–D). Together these data suggest that cell death caused by human α–syn overexpression in our model is closely related with timing of overexpression during critical period of hippocampal development.
Figure 7. Massive cell loss in the DG caused by α–syn overexpression is detected only during developmental period.

A–D, H & E staining from mice of four different genotypes, nTg (A), A53Tα–syn (B), tTA (C), and tTA/A535α–syn (D). These mice (7-month-old) were not treated with dox, allowing Tg α–syn expression throughout lifetime. E–F, H & E staining from mice that were treated with dox during developmental period (E0.5-P21), and released from dox, thus repressing Tg α–syn only during development and reactivating it after development was completed. No difference was detected between nTg (E) and tTA/A53Tα–syn mice (F) mice. Scale bars in A, E = 50 µm.
DISCUSSION
How altered α–syn metabolism leads to neurodegeneration in PD and related disorders is currently not clear. For example, it has been proposed that α–syn fibrillar inclusions or deposits in LBs and LNs compromise or impair normal cellular functions such as intracellular transport, protein degradation, or other metabolic pathways, thereby leading to neuronal and glial cell dysfunction and death (reviewed in Giasson and Lee, 2003). Alternatively, but not mutually exclusive, α–syn protofibrils or oligomeric species may be the neurotoxic species rather than fibrillar α–syn inclusions (reviewed in (Goldberg and Lansbury, 2000). Moreover, it could be that multiple different pathological species of α–syn act in concert to compromise neuronal function and viability. On the other hand, there is very little information on how the conversion of normal α–syn to pathological species could lead to losses of normal α–syn functions. This loss of function could have more deleterious consequences than a gain of toxic function by pathological α–syn. However, so little is known about the physiological functions of α–syn that it is challenging to assess this possibility, although α–syn knockout mice do show mild impairments in synaptic function (Abeliovich, et al., 2000; Cabin et al, 2002). In this study, we attempted to address these issues and our findings demonstrate that both WT and A53T human α–syn induced massive cell loss in the developing hippocampal DG, without forming fibrillar inclusions (see thioflavin S staining in Supplemental Fig. 2), thereby suggesting that increased levels of α–syn expression itself is neurotoxic in developing forebrain despite the absence of insoluble fibrillar aggregates of α–syn.
Our results imply that α–syn might induce toxicity through more than one mechanism, depending on the cellular context, its levels of expression and pathological state as well as other factors (reviewed in Lee and Trojanowski, 2006;Soper et al., 2007). For instance, during development, elevated levels of α–syn expression without inclusion formation might be toxic to some vulnerable cell populations such as DG neurons. Notably, our study and a previous Tg mouse study with truncated α–syn (1~130) under the control of the tyrosine hydroxylase promoter support this speculation (Wakamatsu et al., 2008). In that mouse model, cell loss in the substantia nigra was detected during embryogenesis and the severity was proportional to the level of α–syn expression (Wakamatsu et al., 2008). In this regard, it is interesting to note that duplications and triplications of the α–syn gene leading to increased expression levels of α–syn are known to cause PD, but the onset of disease occurs in the 5th or 6th decade of the lifespan (Singleton et al., 2003). However, it is not known if α–syn pathology begins to accumulate about the time of symptom onset or much earlier in the lifespan prior to symptom onset, or even during development. Conversely, in other contexts, such as in the adult mouse, simple α–syn overexpression might not be enough to cause neurodegeneration in the absence of α–syn oligomerization or fibrillization. Instead, slow accumulation of α–syn into insoluble aggregates may be necessary to activate pathological pathways that lead to neurodegeneration as suggested by many studies (Lee and Trojanowski, 2006;Soper et al., 2007). In our study, turning on α–syn expression upto 6 months after suppressing its expression during the critical period in development, did not lead to massive cell death (Fig. 7). This result indicates that in the adult brain, simple elevation of α–syn level might not be enough to cause massive cell death. A different mechanism such as insoluble aggregates-mediated toxicity may be responsible for adult onset neurodegeneration.
Interestingly, in our conditional α–syn Tg mice, cell loss was observed only in the postmitotic DG neurons, but not in the progenitor cells actively undergoing cell proliferation in the DG. Given that α–syn is expressed both in progenitors and postmitotic cells in this region, our findings suggest that α–syn is not toxic to the cells until they complete the cell cycle and start to undergo differentiation as well as progressive maturation. For these reasons, we speculate that α–syn overexpression might disrupt cellular function(s) essential for the survival of newly differentiating neurons but not for proliferating cells. For example, synapse formation and maintenance are active processes at this stage in DG neuron maturation, and it is known that during development, correct synapse formation and maintenance are critical for neuronal survival (Clarke, 1985). Our data showing reduced synaptic protein levels in the hippocampus of Tg mice (Fig 5) support our speculation that α–syn overexpression may disrupt synapse formation/maintenance. The possible deleterious effect of α–syn overexpression on synaptic proteins also has been shown in a recent study of a rat model of α–syn pathology (Chung et al., 2009). Briefly, adeno-associated virus mediated α–syn expression in the substantia nigra of adult rats resulted in significant changes in the levels of proteins involved in synaptic transmission and axonal transport, and this occurred before neuronal loss in the substantia nigra was detected. It is possible, however, that the changes in synaptic proteins observed in our model might be the consequences, not the causes of cell death.
Another possible mechanism of cell death induced by α–syn in the DG was suggested by a recent study with mouse embryonic stem cells and 5 month-old adult Tg mice expressing α–syn (Crews et al., 2008). This study showed that α–syn accumulation impaired survival of neural precursor cells (newly differentiating neurons) in adult mice using TUNNEL staining. Interestingly, increased DG cell death was also observed in the developing postnatal tTA/α-syn mice in our study. Crews et al. suggest that α–syn might have deleterious effects by repressing Notch-1 expression. Notch-1 has been shown to play a role in survival of neural precursor cells, although it’s well known function is regulating glial differentiation (Louvi and Artavanis-Tsakonas, 2006). Similar to the results from their adult mice, postnatal hippocampus of our developing bigenic mice also showed reduced Notch-1 level (data not shown). However, our results on proliferation of the progenitor cells are different from Crews et al since we did not observe any reduction in proliferation of progenitor cells in either mutant or wild type α-syn bigenic mice, using pH3 staining. Together with these results, our data suggest that during postnatal development, α–syn might impair the survival of newly generated neurons through interfering Notch-1 signaling. It is also interesting to note that Notch-1 regulates dendritic morphology of newly generated neurons (Breunig et al., 2007), thus providing a possible link between α–syn expression and reduced level of dendritic markers such as PSD95 and drebrin observed in our α–syn Tg mice (Fig 5).
In the present study, we focused on cell loss in the DG because the extent of cell loss here can be assessed more reliably than in cortex or other brain regions. In other areas of the brain, massive cell loss was not detected by comparing hematoxylin and eosin staining results between the Tg mice and litter mate controls. Cleaved caspase-3 staining in other brain regions did not show significant changes, either. However, we do not rule out the possibility of subtle changes in neuron numbers that might have occurred in other areas of the brains. In human PDD or DLB patients, most cases do not show extensive cortical or hippocampal atrophy and neuron loss compared to what is seen in substantia nigra (Burton et al., 2002;Uchikado et al., 2002). Therefore, massive DG cell loss observed in our Tg mouse model during development, may or may not recapitulate mechanisms of neurodegeneration in human diseases related to α–syn, but our data open up new opportunities for exploring mechanisms of α–syn toxicity using our new α–syn Tg mouse model. Furthermore, since we can bypass this developmental cell loss by repressing α–syn during developmental period through doxycycline treatment, our tet-off α–syn Tg mouse model can be used to study aging related effect of α–syn in pathogenesis of PDD and DLB.
In conclusion, we demonstrated that overexpression of WT and mutant human α–syn in the novel Tg mouse models we report here leads to synapse loss and DG neuron degeneration during the postnatal development period. Postmitotic neurons, but not proliferating progenitor cells were susceptible to α–syn mediated neuron death, and we speculate that this may be due to disruption in synapse formation or impaired synapse maintenance as evidenced by the reduced levels of synaptic proteins demonstrated here. Our findings suggest that α–syn might cause toxicity to cells without forming insoluble aggregates, but they do not exclude other potential mechanisms such as α–syn mediated neurodegeneration in adult or aged mice that might be linked to α–syn misfolding, oligomer formation or aggregation into fibrillar α–syn inclusions. However, the availability of the α–syn Tg mouse model systems described here will enable us and others to investigate these issues further to gain insights into the role of aging-related α–syn pathologies in the pathogenesis of PD, PDD, DLB and related synucleinopathies.
Supplementary Material
Acknowledgments
We would like to thank Dr. Lendahl for providing us with anti-nestin antiserum 130. We are grateful to Kelvin Luk and James Soper for helpful comments on this manuscript. This work was supported by AG 09215 and NS 053488.
Footnotes
Publisher's Disclaimer: This is a PDF file of an unedited manuscript that has been accepted for publication. As a service to our customers we are providing this early version of the manuscript. The manuscript will undergo copyediting, typesetting, and review of the resulting proof before it is published in its final citable form. Please note that during the production process errors may be discovered which could affect the content, and all legal disclaimers that apply to the journal pertain.
References
- 1.Aarsland D, Beyer MK, Kurz MW. Dementia in Parkinson's disease. Current Opinion in Neurology. 2008;21:676–682. doi: 10.1097/WCO.0b013e3283168df0. [DOI] [PubMed] [Google Scholar]
- 2.Aarsland D, Londos E, Ballard C. Parkinson's disease dementia and dementia with Lewy bodies: different aspects of one entity. Int.Psychogeriatr. 2009;21:216–219. doi: 10.1017/S1041610208008612. [DOI] [PubMed] [Google Scholar]
- 3.Abeliovich A, Schmitz Y, Farinas I, Choi-Lundberg D, Ho WH, Castillo PE, Shinsky N, Verdugo JM, Armanini M, Ryan A, Hynes M, Phillips H, Sulzer D, Rosenthal A. Mice lacking alpha-synuclein display functional deficits in the nigrostriatal dopamine system. Neuron. 2000;25:239–252. doi: 10.1016/s0896-6273(00)80886-7. [DOI] [PubMed] [Google Scholar]
- 4.Altman J, Das GD. Autoradiographic and Histological Evidence of Postnatal Hippocampal Neurogenesis in Rats. Journal of Comparative Neurology. 1965;124:319–335. doi: 10.1002/cne.901240303. [DOI] [PubMed] [Google Scholar]
- 5.Breunig JJ, Silbereis J, Vaccarino FM, Sestan N, Rakic P. Notch regulates cell fate and dendrite morphology of newborn neurons in the postnatal dentate gyrus. Proceedings of the National Academy of Sciences of the United States of America. 2007;104:20558–20563. doi: 10.1073/pnas.0710156104. [DOI] [PMC free article] [PubMed] [Google Scholar]
- 6.Burton EJ, Karas G, Paling SM, Barber R, Williams ED, Ballard CG, McKeith IG, Scheltens P, Barkhof F, O'Brien JT. Patterns of cerebral atrophy in dementia with Lewy bodies using voxel-based morphometry. Neuroimage. 2002;17:618–630. [PubMed] [Google Scholar]
- 7.Cabin DE, Shimazu K, Murphy D, Cole NB, Gottschalk W, McIlwain KL, Orrison B, Chen A, Ellis CE, Paylor R, Lu B, Nussbaum RL. Synaptic vesicle depletion correlates with attenuated synaptic responses to prolonged repetitive stimulation in mice lacking alpha-synuclein. Journal of Neuroscience. 2002;22:8797–8807. doi: 10.1523/JNEUROSCI.22-20-08797.2002. [DOI] [PMC free article] [PubMed] [Google Scholar]
- 8.Chandra S, Gallardo G, Fernandez-Chacon R, Schluter OM, Sudhof TC. alpha-synuclein cooperates with CSP alpha in preventing neurodegeneration. Cell. 2005;123:383–396. doi: 10.1016/j.cell.2005.09.028. [DOI] [PubMed] [Google Scholar]
- 9.Chung CY, Koprich JB, Siddiqi H, Isacson O. Dynamic Changes in Presynaptic and Axonal Transport Proteins Combined with Striatal Neuroinflammation Precede Dopaminergic Neuronal Loss in a Rat Model of AAV alpha-Synucleinopathy. Journal of Neuroscience. 2009;29:3365–3373. doi: 10.1523/JNEUROSCI.5427-08.2009. [DOI] [PMC free article] [PubMed] [Google Scholar]
- 10.Clarke PGH. Neuronal Death in the Development of the Vertebrate Nervous-System. Trends in Neurosciences. 1985;8:345–349. [Google Scholar]
- 11.Conway KA, Harper JD, Lansbury PT. Accelerated in vitro fibril formation by a mutant alpha-synuclein linked to early-onset Parkinson disease. Nature Medicine. 1998;4:1318–1320. doi: 10.1038/3311. [DOI] [PubMed] [Google Scholar]
- 12.Crews L, Mizuno H, Desplats P, Rockenstein E, Adame A, Patrick C, Winner B, Winkler J, Masliah E. alpha-synuclein alters notch-1 expression and neurogenesis in mouse embryonic stem cells and in the hippocampus of transgenic mice. Journal of Neuroscience. 2008;28:4250–4260. doi: 10.1523/JNEUROSCI.0066-08.2008. [DOI] [PMC free article] [PubMed] [Google Scholar]
- 13.Dahlstrand J, Collins VP, Lendahl U. Expression of the Class-Vi Intermediate Filament Nestin in Human Central-Nervous-System Tumors. Cancer Research. 1992;52:5334–5341. [PubMed] [Google Scholar]
- 14.Farrer M, Kachergus J, Forno L, Lincoln S, Wang DS, Hulihan M, Maraganore D, Gwinn-Hardy K, Wszolek Z, Dickson D, Langston JW. Comparison of kindreds with parkinsonism and alpha-synuclein genomic multiplications. Annals of Neurology. 2004;55:174–179. doi: 10.1002/ana.10846. [DOI] [PubMed] [Google Scholar]
- 15.Fernagut PO, Chesselet MF. Alpha-synuclein and transgenic mouse models. Neurobiology of Disease. 2004;17:123–130. doi: 10.1016/j.nbd.2004.07.001. [DOI] [PubMed] [Google Scholar]
- 16.Forman MS, Lee VMY, Trojanowski JQ. Nosology of Parkinson's disease: Looking for the way out of a quackmire. Neuron. 2005;47:479–482. doi: 10.1016/j.neuron.2005.07.021. [DOI] [PubMed] [Google Scholar]
- 17.George JM, Jin H, Woods WS, Clayton DF. Characterization of A Novel Protein Regulated During the Critical Period for Song Learning in the Zebra Finch. Neuron. 1995;15:361–372. doi: 10.1016/0896-6273(95)90040-3. [DOI] [PubMed] [Google Scholar]
- 18.Giasson BI, Duda JE, Quinn SM, Zhang B, Trojanowski JQ, Lee VMY. Neuronal alpha-synucleinopathy with severe movement disorder in mice expressing A53T human alpha-synuclein. Neuron. 2002;34:521–533. doi: 10.1016/s0896-6273(02)00682-7. [DOI] [PubMed] [Google Scholar]
- 19.Giasson BI, Lee VMY. Are ubiquitination pathways central to Parkinson's disease? Cell. 2003;114:1–8. doi: 10.1016/s0092-8674(03)00509-9. [DOI] [PubMed] [Google Scholar]
- 20.Giasson BI, Uryu K, Trojanowski JQ, Lee VMY. Mutant and wild type human alpha-synucleins assemble into elongated filaments with distinct morphologies in vitro. Journal of Biological Chemistry. 1999;274:7619–7622. doi: 10.1074/jbc.274.12.7619. [DOI] [PubMed] [Google Scholar]
- 21.Goedert M. Alpha-synuclein and neurodegenerative diseases. Nature Reviews Neuroscience. 2001;2:492–501. doi: 10.1038/35081564. [DOI] [PubMed] [Google Scholar]
- 22.Goldberg MS, Lansbury PT. Is there a cause-and-effect relationship between alpha-synuclein fibrillization and Parkinson's disease? Nature Cell Biology. 2000;2:E115–E119. doi: 10.1038/35017124. [DOI] [PubMed] [Google Scholar]
- 23.Goldmann GR, Siderowf A, Hurtig HI. Cognitive impairment in Parkinson's disease and dementia with lewy bodies: a spectrum of disease. Neurosignals. 2008;16:24–34. doi: 10.1159/000109756. [DOI] [PubMed] [Google Scholar]
- 24.Gossen M, Bujard H. Tight Control of Gene-Expression in Mammalian-Cells by Tetracycline-Responsive Promoters. Proceedings of the National Academy of Sciences of the United States of America. 1992;89:5547–5551. doi: 10.1073/pnas.89.12.5547. [DOI] [PMC free article] [PubMed] [Google Scholar]
- 25.Jankowsky JL, Slunt HH, Gonzales V, Savonenko AV, Wen JC, Jenkins NA, Copeland NG, Younkin LH, Lester HA, Younkin SG, Borchelt DR. Persistent amyloidosis following suppression of A beta production in a transgenic model of Alzheimer disease. Plos Medicine. 2005;2:1318–1333. doi: 10.1371/journal.pmed.0020355. [DOI] [PMC free article] [PubMed] [Google Scholar]
- 26.Kahle PJ. alpha-Synucleinopathy models and human neuropathology: similarities and differences. Acta Neuropathol. 2008;115:87–95. doi: 10.1007/s00401-007-0302-x. [DOI] [PubMed] [Google Scholar]
- 27.Kostka M, Hogen T, Danzer KM, Levin J, Habeck M, Wirth A, Wagner R, Glabe CG, Finger S, Heinzelmann U, Garidel P, Duan W, Ross CA, Kretzschmar H, Giese A. Single particle characterization of iron-induced pore-forming alpha-synuclein oligomers. Journal of Biological Chemistry. 2008;283:10992–11003. doi: 10.1074/jbc.M709634200. [DOI] [PubMed] [Google Scholar]
- 28.Kramer ML, Schulz-Schaeffer WJ. Presynaptic alpha-synuclein aggregates, not Lewy bodies, cause neurodegeneration in dementia with Lewy bodies. Journal of Neuroscience. 2007;27:1405–1410. doi: 10.1523/JNEUROSCI.4564-06.2007. [DOI] [PMC free article] [PubMed] [Google Scholar]
- 29.Kruger R, Kuhn W, Muller T, Woitalla D, Graeber M, Kosel S, Przuntek H, Epplen JT, Schols L, Riess O. Ala30Pro mutation in the gene encoding alpha-synuclein in Parkinson's disease. Nature Genetics. 1998;18:106–108. doi: 10.1038/ng0298-106. [DOI] [PubMed] [Google Scholar]
- 30.Lee MK, Stirling W, Xu YQ, Xu XY, Qui D, Mandir AS, Dawson TM, Copeland NG, Jenkins NA, Price DL. Human alpha-synuclein-harboring familial Parkinson's disease-linked Ala-53 -> Thr mutation causes neurodegenerative disease with alpha-synuclein aggregation in transgenic mice; Proceedings of the National Academy of Sciences of the United States of America; 2002. pp. 8968–8973. [DOI] [PMC free article] [PubMed] [Google Scholar]
- 31.Lee VMY, Trojanowski JQ. Mechanisms of Parkinson's disease linked to pathological alpha-synuclein: New targets for drug discovery. Neuron. 2006;52:33–38. doi: 10.1016/j.neuron.2006.09.026. [DOI] [PubMed] [Google Scholar]
- 32.Lim Y, Cho G, Minarcik J, Golden J. Altered BMP signaling disrupts chick diencephalic development. Mechanisms of Development. 2005;122:603–620. doi: 10.1016/j.mod.2004.12.001. [DOI] [PubMed] [Google Scholar]
- 33.Lim Y, Golden JA. Expression pattern of cLhx2b, cZic1 and cZic3 in the developing chick diencephalon. Mechanisms of Development. 2002;115:147–150. doi: 10.1016/s0925-4773(02)00091-6. [DOI] [PubMed] [Google Scholar]
- 34.Lippa CF, Duda JE, Grossman M, Hurtig HI, Aarsland D, Boeve BF, Brooks DJ, Dickson DW, Dubois B, Emre M, Fahn S, Farmer JM, Galasko D, Galvin JE, Goetz CG, Growdon JH, Gwinn-Hardy KA, Hardy J, Heutink P, Iwatsubo T, Kosaka K, Lee VM, Leverenz JB, Masliah E, McKeith IG, Nussbaum RL, Olanow CW, Ravina BM, Singleton AB, Tanner CM, Trojanowski JQ, Wszolek ZK. DLB and PDD boundary issues: diagnosis, treatment, molecular pathology, and biomarkers. Neurology. 2007;68:812–819. doi: 10.1212/01.wnl.0000256715.13907.d3. [DOI] [PubMed] [Google Scholar]
- 35.Louvi A, Artavanis-Tsakonas S. Notch signalling in vertebrate neural development. Nature Reviews Neuroscience. 2006;7:93–102. doi: 10.1038/nrn1847. [DOI] [PubMed] [Google Scholar]
- 36.Mayeux R, Stern Y, Rosen J, Leventhal J. Depression, intellectual impairment, and Parkinson disease. Neurology. 1981;31:645–650. doi: 10.1212/wnl.31.6.645. [DOI] [PubMed] [Google Scholar]
- 37.Mayford M, Bach ME, Huang YY, Wang L, Hawkins RD, Kandel ER. Control of memory formation through regulated expression of a CaMKII transgene. Science. 1996;274:1678–1683. doi: 10.1126/science.274.5293.1678. [DOI] [PubMed] [Google Scholar]
- 38.Murphy DD, Rueter SM, Trojanowski JQ, Lee VMY. Synucleins are developmentally expressed, and alpha-synuclein regulates the size of the presynaptic vesicular pool in primary hippocampal neurons. Journal of Neuroscience. 2000;20:3214–3220. doi: 10.1523/JNEUROSCI.20-09-03214.2000. [DOI] [PMC free article] [PubMed] [Google Scholar]
- 39.Narhi L, Wood SJ, Steavenson S, Jiang YJ, Wu GM, Anafi D, Kaufman SA, Martin F, Sitney K, Denis P, Louis JC, Wypych J, Biere AL, Citron M. Both familial Parkinson's disease mutations accelerate alpha-synuclein aggregation. Journal of Biological Chemistry. 1999;274:9843–9846. doi: 10.1074/jbc.274.14.9843. [DOI] [PubMed] [Google Scholar]
- 40.Polymeropoulos MH, Lavedan C, Leroy E, Ide SE, Dehejia A, Dutra A, Pike B, Root H, Rubenstein J, Boyer R, Stenroos ES, Chandrasekharappa S, Athanassiadou A, Papapetropoulos T, Johnson WG, Lazzarini AM, Duvoisin RC, DiIorio G, Golbe LI, Nussbaum RL. Mutation in the alpha-synuclein gene identified in families with Parkinson's disease. Science. 1997;276:2045–2047. doi: 10.1126/science.276.5321.2045. [DOI] [PubMed] [Google Scholar]
- 41.Singleton AB, Farrer M, Johnson J, Singleton A, Hague S, Kachergus J, Hulihan M, Peuralinna T, Dutra A, Nussbaum R, Lincoln S, Crawley A, Hanson M, Maraganore D, Adler C, Cookson MR, Muenter M, Baptista M, Miller D, Blancato J, Hardy J, Gwinn-Hardy K. alpha-synuclein locus triplication causes Parkinson's disease. Science. 2003;302:841. doi: 10.1126/science.1090278. [DOI] [PubMed] [Google Scholar]
- 42.Soper J, Trojanowski JQ, Lee VMY. Alpha-synuclein in Parkinson's disease. In: Dawson T, editor. Parkinson's Disease: Genetics And Pathogenesis. New York, NY: Informa Healthcare; 2007. pp. 167–186. [Google Scholar]
- 43.Spillantini MG, Schmidt ML, Lee VMY, Trojanowski JQ, Jakes R, Goedert M. alpha-synuclein in Lewy bodies. Nature. 1997;388:839–840. doi: 10.1038/42166. [DOI] [PubMed] [Google Scholar]
- 44.Starkstein SE, Bolduc PL, Preziosi TJ, Robinson RG. Cognitive impairments in different stages of Parkinson's disease. J.Neuropsychiatry Clin.Neurosci. 1989;1:243–248. doi: 10.1176/jnp.1.3.243. [DOI] [PubMed] [Google Scholar]
- 45.Stern Y, Marder K, Tang MX, Mayeux R. Antecedent clinical features associated with dementia in Parkinson's disease. Neurology. 1993;43:1690–1692. doi: 10.1212/wnl.43.9.1690. [DOI] [PubMed] [Google Scholar]
- 46.Uchikado H, Iseki E, Tsuchiya K, Togo T, Katsuse O, Ueda K, Kato M, Kosaka K. Dementia with Lewy bodies showing advanced Lewy pathology but minimal Alzheimer pathology - Lewy pathology causes neuronal loss inducing progressive dementia. Clinical Neuropathology. 2002;21:269–277. [PubMed] [Google Scholar]
- 47.Volles MJ, Lee SJ, Rochet JC, Shtilerman MD, Ding TT, Kessler JC, Lansbury PT. Vesicle permeabilization by protofibrillar alpha-synuclein: Implications for the pathogenesis and treatment of Parkinson's disease. Biochemistry. 2001;40:7812–7819. doi: 10.1021/bi0102398. [DOI] [PubMed] [Google Scholar]
- 48.Wakamatsu M, Ishii A, Iwata S, Sakagami J, Ukai Y, Ono M, Kanbe D, Muramatsu SI, Kobayashi K, Iwatsubo T, Yoshimotoa M. Selective loss of nigral dopamine neurons induced by overexpression of truncated human alpha-synuclein in mice. Neurobiology of Aging. 2008;29:574–585. doi: 10.1016/j.neurobiolaging.2006.11.017. [DOI] [PubMed] [Google Scholar]
- 49.Zakharov SD, Hulleman JD, Dutseva EA, Antonenko YN, Rochet JC, Cramer WA. Helical alpha-synuclein forms highly conductive ion channels. Biochemistry. 2007;46:14369–14379. doi: 10.1021/bi701275p. [DOI] [PubMed] [Google Scholar]
- 50.Zarranz JJ, Alegre J, Gomez-Esteban JC, Lezcano E, Ros R, Ampuero I, Vidal L, Hoenicka J, Rodriguez O, Atares B, Llorens V, Tortosa EG, del Ser T, Munoz DG, de Yebenes JG. The new mutation, E46K, of alpha-synuclein causes Parkinson and Lewy body dementia. Annals of Neurology. 2004;55:164–173. doi: 10.1002/ana.10795. [DOI] [PubMed] [Google Scholar]
Associated Data
This section collects any data citations, data availability statements, or supplementary materials included in this article.