
Figure 3.
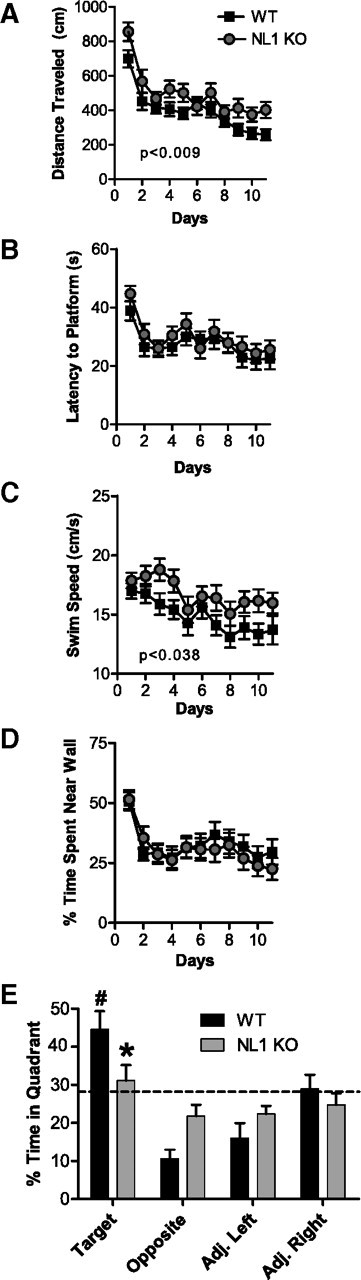
NL1 KO mice exhibit impaired spatial memory in the Morris water maze. A–D, Training trials for the Morris water maze task. For each day of training, data were averaged across the four daily trials, and, in all three-way mixed ANOVAs, “day” was treated as the repeated measure. NL1 KO mice displayed an abnormal learning curve as measured by distance to reach the submerged platform compared with WT (A) [three-way mixed ANOVA, genotype (between-subjects factor), p < 0.0089; sex (between-subjects factor), p = 0.61; day (within-subjects factor), p < 0.000001; genotype × sex interaction, p = 0.92; genotype × day interaction, p = 0.65; sex × day interaction, p = 0.50; genotype × sex × day interaction, p = 0.89]. The latency to reach the platform (B) was normal in the NL1 KO mice [three-way mixed ANOVA, genotype (between-subjects factor), p = 0.47; sex (between-subjects factor), p = 0.65; day (within-subjects factor), p < 0.000001; genotype × sex interaction, p = 0.74; genotype × day interaction, p = 0.93; sex × day interaction, p = 0.11; genotype × sex × day interaction, p = 0.50]. NL1 KO mice exhibited faster average swim speeds (C) than controls [three-way mixed ANOVA, genotype (between-subjects factor), F(1,42) = 4.59, p < 0.038; sex (between-subjects factor), p = 0.14; day (within-subjects factor), p < 0.000001; genotype × sex interaction, p = 0.94; genotype × day interaction, p = 0.88; sex × day interaction, p = 0.89; genotype × sex × day interaction, p = 0.82]. Percentage time spent near the wall of the maze (D, percentage thigmotaxis) was not different across groups [three-way mixed ANOVA, genotype (between-subjects factor), p = 0.95; sex (between-subjects factor), p = 0.82; day (within-subjects factor), p < 0.000001; genotype × sex interaction, p = 0.99; genotype × day interaction, p = 0.60; sex × day interaction, p = 0.78; genotype × sex × day interaction, p = 0.96]. There were no differences between groups in the visible platform task (supplemental Fig. 2, available at www.jneurosci.org as supplemental material). n = 23 littermate pairs. Legend in A also applies to B–D. E, Percentage of time that mice spent swimming in each quadrant of the pool during the probe trial (i.e., spatial memory test) on day 12 of the Morris water maze [three-way mixed ANOVA, sex (between-subjects factor), p = 0.22; genotype (between-subjects factor), p = 0.84; quadrant (within-subjects factor), p < 0.000001; sex × genotype interaction, p = 0.84; sex × quadrant interaction, p = 0.53; genotype × quadrant interaction, p < 0.02; sex × genotype × quadrant interaction, p = 0.96]. NL1 KO mice spent less time in the target quadrant than controls (*p < 0.037 for NL1 KO target vs WT target, planned comparisons) and, unlike control mice (#p < 0.05 compared with all other quadrants, planned comparisons) showed no preference for the target quadrant, indicating a deficit in spatial memory. n = 23 littermate pairs. Data represent means ± SEM.