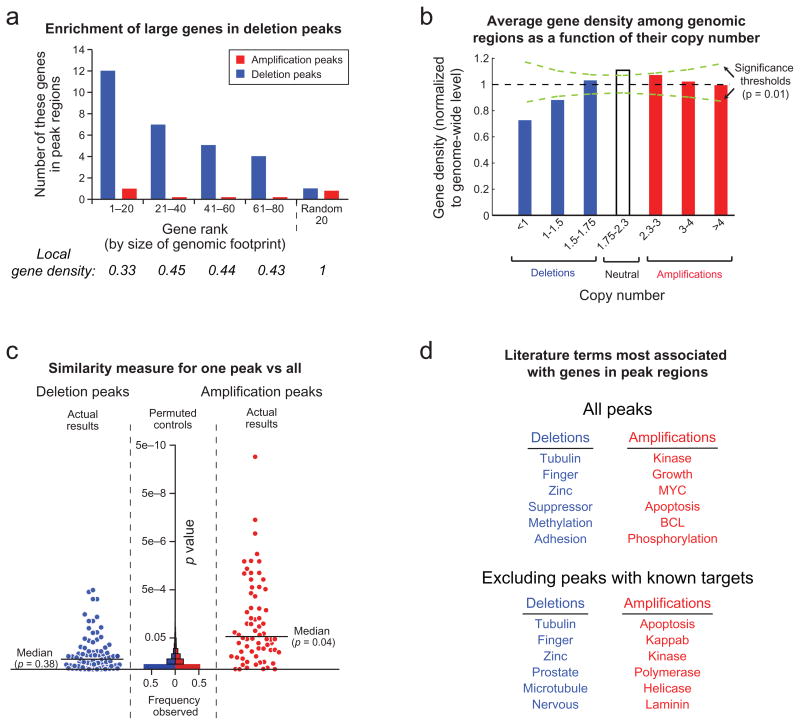
Figure 2.
Characteristics of significant focal SCNAs. a) Genes are ranked by the amount of genome occupied. Local gene density is normalized against the genome-wide average. b) Average gene density as a function of copy number. c) GRAIL analysis20 p-values, plotted for each peak region, reflect the similarity between genes in that region compared to genes in all other regions. Increasing significance is plotted towards the top and reflects greater similarity. Histograms of p-values are displayed for randomly placed regions (“Permuted controls”). d) The literature terms most associated with genes in either deletion or amplification peaks, but not both.

