

Abstract
High-throughput fluorescent intercalator displacement (HT-FID) was adapted to the semi-automated screening of a commercial compound library containing 60,000 molecules resulting in the discovery of cytotoxic DNA-targeted agents. Although commercial libraries are routinely screened in drug discovery efforts, the DNA binding potential of the compounds they contain has largely been overlooked. HT-FID led to the rapid identification of a number of compounds for which DNA binding properties were validated through demonstration of concentration-dependent DNA binding and increased thermal melting of A/T- or G/C-rich DNA sequences. Selected compounds were assayed further for cell proliferation inhibition in glioblastoma cells. Seven distinct compounds emerged from this screening procedure that represent structures unknown previously to be capable of targeting DNA leading to cell death. These agents may represent structures worthy of further modification to optimally explore their potential as cytotoxic anti-cancer agents. In addition, the general screening strategy described may find broader impact toward the rapid discovery of DNA targeted agents with biological activity.
Keywords: DNA binding, fluorescent intercalator displacement (FID), high-throughput screening, cytotoxicity
B-form DNA continues to be an important and viable target in the discovery and development of novel anti-cancer1-6 and anti-microbial/anti-parasitic7-9 agents. Indeed, it has been noted2 that among new agents in clinical use against cancer (as of 2002), many continue to target DNA as a locus for their activities.10 In general, biologically active DNA-targeted compounds, either wholly synthetic or derived from natural product sources, bind DNA reversibly or modify this biopolymer covalently leading to the inhibition of transcription and/or DNA replication; while reversible DNA binding agents can interfere competitively with the proteins necessary for transcriptional control or processing, covalent lesions can lead to intra- or inter-strand cross links within genomic DNA, often halting the progression of replication forks. Additionally, in the case of DNA-targeted anti-parasitic compounds, e.g., anti-trypanosomals, active agents often target A/T-rich regions of DNA including intrinsically bent kinetoplast minicircles.4,8 Thus, given the clinical potential of DNA targeted agents–from the generation of novel anti-cancer treatments to unique strategies in the fight against microbial infections and neglected tropical diseases–the search for new DNA binding agents continues unabated.
Expediting the above search, high-throughput screening (HTS) strategies coupled to focused compound library approaches are being employed with increasing frequency.3,5,11,12 To date, most efforts in this area have aimed for the discovery of increasingly selective compounds targeted to key DNA sequences within genes, usually the binding sites of critical regulatory proteins.3,5 These efforts have been facilitated by the development of strategies to rapidly identify site-selective DNA binding agents and to assess their DNA binding properties. Among the methods employed, fluorescence intercalator displacement (FID)13-15 and cognate site identifier (CSI) arrays16 have been used successfully. Noteworthy, the FID and CSI strategies have been combined recently into a single platform for discovery.17
While highly selective DNA binding agents discovered through the above efforts generally are pursued to enable the “knock out” of key DNA-protein interactions to ultimately alter some well-defined biological response, it is worth underscoring that virtually all DNA-targeted agents in active clinical use exhibit very limited site-selectivities, usually 2-4 base pairs only.18,19 Thus, while efforts aimed at developing agents with increasing DNA specificity are of keen interest, the continued quest for unique biologically active agents with limited DNA site-selectivities may similarly lead to interesting and useful compounds.
With the above in mind, we have developed a strategy for the rapid discovery of DNA targeted compounds that couples fluorescent intercalator displacement (FID) to semi-automated high-throughput screening technologies (Scheme 1). We demonstrate that a robust HT screen can be developed to analyze large compound libraries, as demonstrated through our analysis of a 60,000 member commercially-available library, and that validated DNA-targeted hits discovered in this fashion can lead to agents that are cytotoxic to glioblastoma cancer cells. While the primary goal of the work described herein was to develop a strategy to expedite the identification of DNA targeted agents from large libraries, as a side benefit our assay also provides a rapid means to pre-screen for DNA binding library members that may lead to false-positive results in assays devoted to the discovery of agents targeted to proteins in the presence of a DNA substrate, e.g. enzymes involved in repair processes.
Scheme 1.
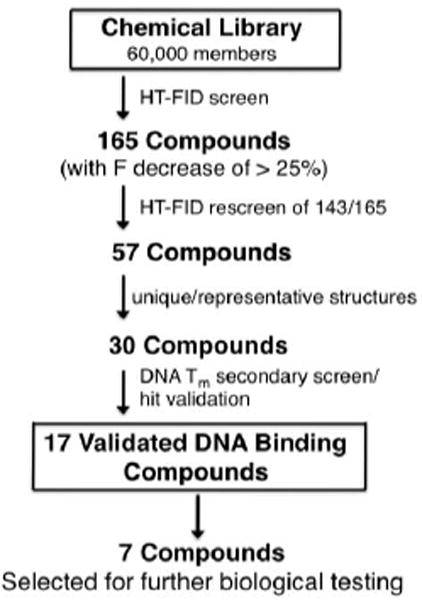
Semi-automated high-throughput screening strategy leading to the selection of DNA binding components from a compound library.
HTS assay development and validation
Our HTS strategy was developed from a standard FID approach using calf thymus DNA as a binding substrate and ethidium bromide as a reporting fluorophore.20 Calf thymus DNA has the advantage of being a cost-effective HTS substrate approximating all possible combinations of base pairs. Briefly, in an FID assay, DNA-bound ethidium bromide fluoresces brightly and when challenged with a competing DNA binding agent, the original level of ethidium bromide fluorescence is decreased due to its displacement from binding sites.
Initially, we sought to assess the validity of our proposed assay. Using ethidium-bound calf thymus DNA in conjunction with two well-characterized DNA binding agents, actinomycin D and netropsin (as G/C-selective intercalating and A/T-selective groove-binding positive controls, respectively), or a buffer blank (as a negative control), Z′ score21 analyses were conducted. Z′ analyses provide a statistical assessment of the reproducibility achievable in an HT assay: the negative control provides a maximum percent F to be expected in the assay while positive controls provide a maximum decrease in F to be expected from strong DNA binding agents–these aspects determine the dynamic range of the assay.
Using the above controls, 20 μL aliquots containing 25 μM compound (or water blanks) were dispensed into 384 well plates (black Nunc) using a robotic liquid handler (Tecan Freedom EVO 150). Subsequently, 30 μL aliquots of a solution containing calf thymus DNA, ethidium bromide, and Tris buffer (pH 7.4) were dispensed into these same plate wells to provide final concentrations of each well component (21 μM DNA base pair, 6.5 μM ethidium bromide, 100 mM NaCl, 10 mM Tris (pH 7.4), 0.8% DMSO and 10 μM binding agent. The fluorescence output of each sample well was measured via a Perkin-Elmer Envision 2102 multilabel plate reader (λex 530 nm, λem 615 nm) and compared to negative controls (no added compound) to determine percent F decreases. These data (~384 wells, one plate, per positive or negative agent) revealed that the average percent decrease in F observed for actinomycin D was 63% while that observed for netropsin was 32%. Using these data a Z′ score of 0.74 was determined for actinomycin D, well within the acceptable range for Z′ scores (>0.5 to be deemed a viable assay21) and indicating the viability of our screen. In comparison, a Z′ score of 0.41 was determined for netropsin; actinomycin D thus was chosen as the exclusive positive parallel control for all subsequent FID screening.
Application to a compound library
The assay was applied to a commercially available ChemDiv library containing 60,000 compounds with an overall average MW of 300. ChemDiv libraries are widely used in HTS and contain a cross-section of pharmacophore-rich, drug-like compounds that possess good ADME profiles. Noteworthy, the DNA binding potential of this library has not been assessed. Thus, identifying the DNA binding components contained therein may be of broader interest.
Applying our screen to the above library (~10 μM compound/well22) in the presence of both positive (actinomycin D) and negative (buffer blank) controls revealed that from among the 60,000 compounds examined, 165 produced an F decrease of 25% or greater (Scheme 1) with the best agents decreasing F between 46% and 30%. Next, from among the 165 compounds initially identified, 143 available compounds were rescreened twice in independent experiments using the same FID assay. The re-screens led to the identification of 57 compounds for which consistent results were obtained and from which 30 compounds were selected for validation using a non-fluorescence based method.
Validation of hits: non-fluorescent based secondary screening via thermal melting
The DNA binding activities of the 30 hits identified above were verified using a standard, non-fluorescence based method: DNA thermal melting.20 ΔTm values were determined through an examination of DNA hyperchromicity at 260 nm as a function of increased temperature in the presence of each compound. Upon examination of the 30 hits (in parallel with actinomycin and netropsin controls) using poly(dA-dT) and a G/C-rich oligonucleotide (to evaluate A/T- vs. G/C-selectivity, respectively), we confirmed the DNA binding activity of 17 of the original 30 compounds. From these 17 verified DNA binding agents, seven compounds where selected (1-7, see Fig 1 and Table 1) based on their consistent, strong FID assay responses and high Tm values, quite similar to actinomycin and netropsin, and similar in Tm behavior to some synthetic groove binding ligands reported previously by others using this DNA.23
Figure 1.

Structures of select validated DNA binding hits 1-7 discovered as described in Scheme 1.
Table 1.
Activities of control agents and 1-7 in primary FID screens, thermal melting assays, relative DNA binding assays, and cytotoxicity assays.
| Compounds | % F Decreasea | Δ Tmb (°C) | FD50c (μM) (Range)d | LC50 (μM) | |
|---|---|---|---|---|---|
| A/T | G/C | ||||
| actinomycin | 63 | > 45 | 10 | 4.3 (93) | nd |
| netropsin | 32 | ~ 45 | 0 | 5.1 (78) | nd |
| 1 | 46 | > 45 | 0 | 7.7 (36) | >50 |
| 2 | 40 | 10 | 0 | 7.7 (48) | 2.6 |
| 3 | 36 | > 45 | 0 | 9.4 (29) | 35 |
| 4 | 34 | > 45 | 0 | 13.5 (27) | 13 |
| 5 | 32 | > 45 | 0 | 4.4 (34) | 10 |
| 6 | 32 | > 45 | 0 | 5.5 (35) | 26 |
| 7 | 22 | 0 | 10 | 7.7 (34) | >25 |
Values obtained from HT-FID rescreen using ~10 μM compound.
Tm values were determined in 1 cm quartz cuvettes containing 50 μM (base pair) solutions of A/T DNA (poly dA-dT, Tm = 47 °C), or G/C DNA (a G/C-rich oligonucleotide, Tm = 56 °C), 10 mM MES, pH 6.3, and 10 mM EDTA in the presence of 1-7 (15-20 μM) in 3% DMSO; A260 values were measured at intervals of 5 °C from 25-90 °C relative to DNA alone.
Concentration of agent required to attain 50% F decrease in ethidium-bound DNA fluorescence within the total ranged of decrease.
Maximum %F decrease determined experimentally; these values differ from those found in column two due to expected experimental variability and the use of gravimetrically-prepared24 stocks of 1-7.
As shown in Table 1, 1-7 all displayed appreciable %F changes in the HT-FID screen relative to actinomycin and netropsin. The top compounds selected also exhibited high ΔTm values quite similar to the values observed for the control DNA binding agents. While not definitive, the differential responses of these agents towards the thermal melting substrates suggested that 1-6 may be A/T-selective while 7 may be relatively more selective for G/C sites: like the A/T-selective agent netropsin, 1-6 exhibited no impact on the thermal melting of the G/C oligonucleotide while increasing the Tm of the A/T substrate; whereas, 7 behaved in a fashion similar to actinomycin with the G/C oligonucleotide but did not impact the melting of the A/T substrate. A precise determination of the DNA binding site-selectivities of these agents will require more rigorous testing.
Determination of relative DNA binding affinities
The relative DNA binding affinities of 1-7 were determined using plate conditions (DNA, buffer, etc.) similar to those used in the FID screening.24 Thus, the concentrations of each compound 1-7 required to decrease sample fluorescence to half its original value (FD50) within the range achievable by each compound were determined (Table 1). Realizing that at this point in our characterization we do not know: (1) the DNA-binding site sizes associated with these compounds nor (2) their selectivities beyond tentatively establishing A/T vs. G/C preferences, two factors that influence the extent of ethidium bromide displacement, it appears that compounds 1-7 as a group are reasonably strong DNA-binding agents relative to the control agents studied in parallel. Obviously, a detailed DNA binding characterization through established techniques is beyond the scope and intention of this report focused on strategies for rapid discovery.
Assessments of cell growth inhibition and cytotoxicity
Along with their in vitro DNA binding, the relative cell growth inhibition/cytotoxicities of 1-7 against SF767 glioblastoma cells were also evaluated. Cell growth and survival assays were determined in triplicate using a standard MTT (3-(4,5-dimethylthiazol-2-yl)-2,5-diphenyltetrazolium) assay25: cells (2000) grown for 24 h were treated with increasing concentrations of 1-7; cell survival after 72 h of treatment was determined by addition of the MTT reagent and standard protocols to assess the remaining number of viable cells. A media-only blank was included in each treatment group to serve as a background control. Fig 2 illustrates the % surviving cells after 72 h of treatment at a given compound concentration; plots were used to graphically determine LC50 values (Table 1). Compounds 2-6 inhibited cell growth while 1 and 7 showed no significant effect at the concentrations tested. Compound 2 produced the lowest LC50 value of 2.6 μM, while 4 and 5, the latter resembling a benzimidazole-based DNA groove binder, exhibited the next lowest LC50 values. In comparison to the above, 3 and 6 produced intermediate results.
Figure 2.
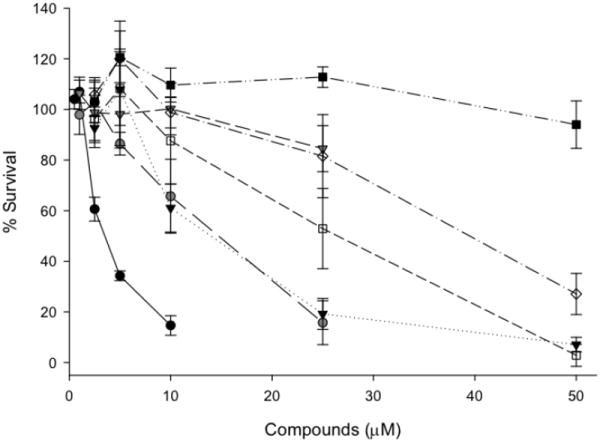
Results from MTT assays that examined the % survival of SF767 glioblastoma cells treated for 72 hours with increasing concentrations of 1-7 (1: black squares; 2: black circles; 3: white diamonds; 4: grey circles; 5: black triangles; 6: white squares; 7: grey triangles). These data were used to determine LC50 values (Table 1).
Conclusions
We have described a semi-automated FID-based HT screen for the rapid discovery of DNA binding components from compound libraries. This screen has the potential to be widely applicable in the discovery of new DNA binding agents as well as to permit the pre-screening of libraries when knowledge of the presence of DNA binding components would be useful. It is evident that this screen can select diverse and unique DNA binding structures, as in our discovery of 1-7. Indeed, a perusal of the literature indicates that DNA binding properties and cytotoxicities have not been reported for the compounds selected. Currently, structure-activity relationships for these compounds are being assessed as well as more detailed analyses of their DNA binding characteristics.
Acknowledgments
We gratefully acknowledge support from an IUPUI Research Support Funds Grant (to E.C.L.) and the NIH (M.R.K: CA94025, CA106298 and CA121168). Screening was carried out at the Chemical Genomics Core Facility within the IU School of Medicine at IUPUI.
Footnotes
Publisher's Disclaimer: This is a PDF file of an unedited manuscript that has been accepted for publication. As a service to our customers we are providing this early version of the manuscript. The manuscript will undergo copyediting, typesetting, and review of the resulting proof before it is published in its final citable form. Please note that during the production process errors may be discovered which could affect the content, and all legal disclaimers that apply to the journal pertain.
References and notes
- 1.Thurston DE. Br J Cancer. 1999;80(Suppl 1):65. [PubMed] [Google Scholar]
- 2.Tse WC, Boger DL. Chem Biol. 2004;11:1607. doi: 10.1016/j.chembiol.2003.08.012. [DOI] [PubMed] [Google Scholar]
- 3.Dickinson LA, Burnett BS, Melander C, Edelson BS, Arora PS, Dervan PB, Gottesfeld JM. Chem Biol. 2004;11:1583. doi: 10.1016/j.chembiol.2004.09.004. [DOI] [PubMed] [Google Scholar]
- 4.Wilson WD, Nguyen B, Tanious FA, Mathis A, Hall JE, Stephens CE, Boykin DW. Curr Med Chem: Anti-Cancer Agents. 2005;5:389. doi: 10.2174/1568011054222319. [DOI] [PubMed] [Google Scholar]
- 5.Stover JS, Shi J, Jin W, Vogt PK, Boger DL. J Am Chem Soc. 2009;131:3342. doi: 10.1021/ja809083d. [DOI] [PMC free article] [PubMed] [Google Scholar]
- 6.Rahman KM, Thompson AS, James CH, Narayanaswamy M, Thurston DE. J Am Chem Soc. 2009;131 doi: 10.1021/ja902986x. asap article. [DOI] [PubMed] [Google Scholar]
- 7.Tidwell RR, Boykin DW. In: Small Molecule DNA and RNA Binders. Demeunynck M, Bailly C, Wilson WD, editors. Vol. 2. Wiley-VCH; Weinheim: 2003. pp. 414–460. [Google Scholar]
- 8.Wilson WD, Tanious FA, Mathis A, Tevis D, Hall JE, Boykin DW. Biochimie. 2008;90:999. doi: 10.1016/j.biochi.2008.02.017. [DOI] [PMC free article] [PubMed] [Google Scholar]
- 9.Glass LS, Nguyen B, Goodwin KD, Dardonville C, Wilson WD, Long EC, Georgiadis MM. Biochemistry. 2009;48:5943. doi: 10.1021/bi900204w. [DOI] [PMC free article] [PubMed] [Google Scholar]
- 10.Newman DJ, Cragg GM, Snader KM. J Nat Prod. 2003;66:1022. doi: 10.1021/np030096l. [DOI] [PubMed] [Google Scholar]
- 11.Boger DL, Fink BE, Hedrick MP. J Am Chem Soc. 2000;122:6382. [Google Scholar]
- 12.Boger DL, Dechantsreiter MA, Ishii T, Fink BE, Hedrick MP. Bioorg Med Chem. 2000;8:2049. doi: 10.1016/s0968-0896(00)00137-1. [DOI] [PubMed] [Google Scholar]
- 13.Tse WC, Boger DL. Acc Chem Res. 2004;37:61. doi: 10.1021/ar030113y. [DOI] [PubMed] [Google Scholar]
- 14.Chaltin P, Borgions F, Van Aerschot A, Herdewijn P. Bioorg Med Chem Lett. 2003;13:47. doi: 10.1016/s0960-894x(02)00836-3. [DOI] [PubMed] [Google Scholar]
- 15.Lewis MA, Long EC. Bioorg Med Chem. 2006;14:3481. doi: 10.1016/j.bmc.2006.01.006. [DOI] [PubMed] [Google Scholar]
- 16.Warren CL, Kratochvil NC, Hauschild KE, Foister S, Brezinski ML, Dervan PB, Phillips GN, Jr, Ansari AZ. Proc Natl Acad Sci U S A. 2006;103:867. doi: 10.1073/pnas.0509843102. [DOI] [PMC free article] [PubMed] [Google Scholar]
- 17.Hauschild KE, Stover JS, Boger DL, Ansari AZ. Bioorg Med Chem Lett. 2009;19:3779. doi: 10.1016/j.bmcl.2009.04.097. [DOI] [PMC free article] [PubMed] [Google Scholar]
- 18.Reddy PBS, Sondhi SM, Lown JW. Pharmacol Ther. 1999;84:1. doi: 10.1016/s0163-7258(99)00021-2. [DOI] [PubMed] [Google Scholar]
- 19.Yang X-L, Wang AH-J. Pharmacol Ther. 1999;83:181. doi: 10.1016/s0163-7258(99)00020-0. [DOI] [PubMed] [Google Scholar]
- 20.Fox KR. Drug-DNA Interaction Protocols: Methods in Molecular Biology. Vol. 90 Humana; Totowa, NJ, USA: 1997. [Google Scholar]
- 21.Zhang JH, Chung TD, Oldenburg KR. J Biomol Screen. 1999;4:67. doi: 10.1177/108705719900400206. [DOI] [PubMed] [Google Scholar]
- 22.The commercial plated stocks used for HTS contain approximately 25 μM solutions of each library member based on an overall average MW of 300.
- 23.Ismail MA, Batista-Parra A, Miao Y, Wilson WD, Wenzler T, Brun R, Boykin DW. Bioorg Med Chem. 2005;13:6718. doi: 10.1016/j.bmc.2005.07.024. [DOI] [PubMed] [Google Scholar]
- 24.Stock solutions for this aspect of the work were prepared gravimetrically from solid compound sources–the results shown in Table 1 for FD50 and Range %F can thus be viewed as a more accurate representation of the relative binding abilities of these compounds. Sample wells were prepared as in the original screen; however, aliquots of compound 1-7 were added to a series of wells to achieve final concentrations within the range of 0.1 - 50 μM.
- 25.Mosmann T. J Immunol Methods. 1983;65:55. doi: 10.1016/0022-1759(83)90303-4. [DOI] [PubMed] [Google Scholar]