

Abstract
Structural magnetic resonance imaging (MRI) data have provided much evidence in support of our current view that schizophrenia is a brain disorder with altered brain structure, and consequently involving more than a simple disturbance in neurotransmission. This review surveys 118 peer–reviewed studies with control group from 1987 to May 1998. Most studies (81%) do not find abnormalities of whole brain/intracranial contents, while lateral ventricle enlargement is reported in 77%, and third ventricle enlargement in 67%. The temporal lobe was the brain parenchymal region with the most consistently documented abnormalities. Volume decreases were found in 62% of 37 studies of whole temporal lobe, and in 81% of 16 studies of the superior temporal gyrus (and in 100% with gray matter separately evaluated). Fully 77% of the 30 studies of the medial temporal lobe reported volume reduction in one or more of its constituent structures (hippocampus, amygdala, parahippocampal gyrus).
Despite evidence for frontal lobe functional abnormalities, structural MRI investigations less consistently found abnormalities, with 55% describing volume reduction. It may be that frontal lobe volume changes are small, and near the threshold for MRI detection. The parietal and occipital lobes were much less studied; about half of the studies showed positive findings. Most studies of cortical gray matter (86%) found volume reductions were not diffuse, but more pronounced in certain areas. About two thirds of the studies of subcortical structures of thalamus, corpus callosum and basal ganglia (which tend to increase volume with typical neuroleptics), show positive findings, as do almost all (91%) studies of cavum septi pellucidi (CSP). Most data were consistent with a developmental model, but growing evidence was compatible also with progressive, neurodegenerative features, suggesting a “two– hit” model of schizophrenia, for which a cellular hypothesis is discussed. The relationship of clinical symptoms to MRI findings is reviewed, as is the growing evidence suggesting structural abnormalities differ in affective (bipolar) psychosis and schizophrenia.
Keywords: Schizophrenia, magnetic resonance imaging, reviews, psychosis
Introduction
“… We thus come to the conclusion that, in dementia praecox, partial damage to, or destruction of, cells of the cerebral cortex must probably occur, which may be compensated for in some cases, but which mostly brings in its wake a singular, permanent impairment of the inner life (Kraepelin, 1919/1971, page 154)”.
The window on the brain provided by structural imaging has transformed our view of schizophrenia to one which views the very structure of the brain as altered, a view echoing Kraepelin’s prescient statement. Beginning with Johnstone’s (1989) computed tomography (CT) findings of enlarged ventricles (which actually confirmed earlier, more anecdotal pneumoencephalographic studies), subsequent reports using magnetic resonance imaging (MRI) have provided key information detailing volume reductions in particular brain regions of interest (ROI). These data have provided the major evidence in support of our current view that schizophrenia is a brain disorder with altered brain structure, and consequently involving more than a simple disturbance in neurotransmission.
Scope of This Review
This review provides an overview of structural MRI findings in schizophrenia over the past decade, beginning in 1988, when major improvements in technology occurred, and ending in May 1998. It builds on, and updates our earlier review (Shenton et al 1997). Because of the large number of studies cited, more than 170, we use a table to present, for each ROI, the number of studies with positive and negative findings. The text itself summarizes the findings and their implications for each ROI, but space constraints do not allow us to describe each individual study. To qualify for inclusion in the review, studies must have: 1) appeared in peer–reviewed journals; 2) had 10 or more subjects; 3) have included a control group; 4) had quantitative measurements; and 5) have included schizophrenic patients as a major focus. This review counts the same group of subjects only once for each ROI in those cases where the same subjects appear in more than one paper, such as, for example, where schizophrenics in one paper are contrasted with controls and with another pathological group in a separate publication.
Some discussion of the scope of this review may be useful. First, while we believe our conclusion about quality of studies improving after 1987 is generally true, this neglects the pioneering study of Andreasen et al (1986), the first quantitative controlled study of adequate sample size, which may be regarded as ushering in the “next generation” of MRI studies. Other quality studies may also have been omitted, but a rule setting the starting point in a technologically rapidly changing field is needed, although we acknowledge any date so selected is somewhat arbitrary.
Second, we need to comment on the tabular presentation of the studies in Table 1. One broad approach for reviews is to survey the literature, and then to provide an informed opinion as to the summary trends and findings, with specific citations to drive home the points. Most reviews, in fact, adopt this approach; however, we note that using such an approach leads to much of the review’s summarizing process remaining opaque to the reader, who, without reading the literature, cannot formulate a judgment of the accuracy of the review’s conclusions based on the data presented. We thus decided to present a summary of the studies in tabular form, to assist the reader in forming an independent conclusion. We further decided to summarize the results of studies in terms of whether each study did or did not report an abnormality for a particular ROI.
Table 1.
Summary of MRI Studies Reporting Positive and Negative Findings in Schizophrenia, 1987–May 1998
Each study is cited by first author and year. “asym” following the year indicates finding was one of asymmetry difference only. Planum Temporale citations are mainly of asymmetry differences and do not use the “asym” qualifier.
A possible alternative to the comprehensive survey of studies in our review is meta–analysis, which essentially involves weighting each individual study by a function of its N and effect size, and then using this information to produce an estimate of the combined effect size (see Glass et al 1981; Hunter and Schmidt 1990; Petitti 1994; Rosenthal 1987). While we are quite sympathetic to the desire to use all of the information in studies, we note that the combination of all of the studies surveyed here in a region–by–region meta–analysis would be premature, potentially misleading, and, at worst, invalid, since: 1) MR scanner technology in the past decade has been changing rapidly, and studies are therefore not quantitatively comparable; 2) the extent of detailed (anatomically based ROI) information used in measurement of images varies; 3) there is a wide difference in moderator variables of subject gender, chronicity (age of onset), medication, parental SES, etc.; and finally, 4) meta–analysis, especially of MRI studies, is beset with the difficulty of estimating the number of studies with negative findings that did not get published [Rosenthal’s “file drawer” problem (1987)].
We concluded that, for a review of this broad a scope, covering more than a decade and all published studies, meta–analysis was not the most appropriate approach, as it would yield a false sense of numerical exactness. We suggest that one cannot simultaneously do a comprehensive review of a decade of studies, the goal of this review, and also perform a valid meta–analysis, unless the variables 1 to 3 above have remained constant, a constancy for which there is little evidence.
We, nonetheless, are sympathetic to readers who would like some more quantitative information and for this reason we have provided a table of subject N for each study in a summary table. It will be clear that the statistical power of negative studies with small subject N is less, and that their results consequently are less convincing than those negative studies with a larger N. We also, following a suggestion of Rosenthal (1987), computed the probability of the observed positive and negative statistical findings, using a two–tailed probability, and the alpha level of p <.05 of the studies. The reader will note that this procedure, like the more standard meta–analyses, assumes comparability of the studies with respect to measurements and subjects, although it does not assume normality of the distributions. We use this probability statistic with caution, since, in our opinion, it is hazardous to assume that the studies are comparable in methodology and subject characteristics; however, it may be of interest to the reader that, if one does assume comparability, the binomial theorem computation (using p <.05 for a positive study) shows that all ROI surveyed in Table I show a two–tailed p <.05 for the number of positive studies, except for the fourth ventricle and cerebellum, and all ROI are less than or equal to .002 except for the occipital lobe (.004). Again, we urge caution on use of this probability estimate because comparability is not strict and an (unknown) percentage of studies with negative results may not get published.
This review begins with a description of what structural MRI can tell us about schizophrenia, followed by a description of what we consider to be important design features of an MRI study, and then by a review of the MRI findings to date in schizophrenia.
Structural MRI – What Can It Tell Us About Schizophrenia?
Structural MRI provides information about gray and white matter parenchyma of the brain, and cerebrospinal fluid (CSF)–filled spaces. This capability is new with MRI studies (the first MRI study of schizophrenia was done by Smith et al 1984), and represents an important advance over CT studies which poorly visualize parenchyma and cannot differentiate gray and white matter. This gray–white differentiation is important for schizophrenia studies, since abnormal tissue classes (tumors, infarcted areas, etc.), which may be detected by CT, have not been found to characterize schizophrenia. The term “Structural MRI” is used to differentiate it from “functional MRI” (fMRI), where indices of short–duration change, such as blood oxygenation, are used.
Our use of the term schizophrenia is in the sense of a syndrome and not a single disease entity. The current major questions about this syndrome include:
What are the brain changes in this disorder? Which areas of the brain are affected?
-
At what life stage do brain abnormalities occur and are they static or progressive?
Are they developmental (pre– and peri–natal) and/or progressive?
What is the cause of the brain changes?
How are brain abnormalities related to clinical symptom abnormalities?
Are brain findings in schizophrenia distinct from those in affective psychosis?
What are the most effective treatments? Is treatment neuroprotective?
Structural MRI studies of schizophrenia have the potential of addressing all of these questions, although the space available for this review allows a detailed answer only to the first question, with but briefer discussions of the other questions. We also note that the long duration that would be required to document the possible effects of treatment on MRI structural brain changes has made it more difficult for the field to address this question, and we will not cover it in this review, although the evidence for progressive changes raises the important issue of whether pharmacologic and other treatments might diminish neurodegenerative processes.
What are the Desirable Features of a Structural MRI Study?
Our tabular presentation of positive or negative findings does not comment on the desirable technical features and quality of the studies. The summary statements and conclusions in the text, however, do take the these features into account as a factor in our conclusions. Since we think this issue of benchmarks for quality is important, we here briefly summarize the features that we used to evaluate the studies reviewed, and which the reader may also find useful:
Thinner is Better
Smaller units of volume analysis (called voxels, for volume element) allow for more precise determination of the irregular contours of brain regions, by reducing the voxel mixing of the desired region with neighboring structures in the voxel. A group of voxels with this mixing is termed a “partial volume.” Many earlier studies used MRI acquisitions with “gaps” in between slices, with interpolation used to estimate the volume in the “gap”; this obviously limits precision of measurement. Thus studies with thinner slices, and no gaps between slices, will likely lead to more precise MR morphometric volume measures.
Quantitative Versus Qualitative Analysis
Early studies relied on subjective, visual ratings of abnormalities. There is now general agreement that computation of volumes of the ROI examined is essential. When raters are used, as is generally the case, inter–rater reliability is important, and should be r ≥ .85. Moreover, the ROI should be objectively and clearly defined, so that others can measure the same entity. Such objectively defined criteria should include detailed specification of the internal landmarks used to define each ROI.
Segmentation involves sorting the tissue classes into gray matter, white matter, or CSF. It seems to us that all studies of cortical gyri should, whenever possible, separate gray and white matter in the analysis, as this is a fundamental distinction in brain tissue; however, not all studies distinguish between gray and white matter, often rendering comparison between studies problematic [e.g., as discussed below, it is difficult to compare measures of superior temporal gyrus (STG) assessed using gray matter volume versus STG assessed using both gray and white matter volume]. Finally, segmentation is often automated or semi–automated, but, unfortunately, there is no agreed upon gold standard for the quality of segmentation, since “phantoms” with known composition do not reflect the complexity of the outlines of brain gray or white matter, and post–mortem estimates of tissue and fluid volumes may not exactly parallel those in vivo. (For a more complete discussion see Kikinis et al 1990, 1992; Gerig et al 1992).
Quality of Imager and Post–Acquisition Processing
The quality of the MR scanner is also important and should include technical assessments such as the homogeneity of the magnetic field, which greatly influences the post–processing segmentation of tissue into different tissue components. Day to day assessment of inhomogeneities in the magnetic field are thus a critical quality assurance feature for the quality of the MR scans, and, consequently, also the quality of the post–processing of MR images. Most modern imagers have magnetic fields of 1.5 Tesla or greater, important for signal–to–noise ratio. Additionally, post–acquisition filtering may improve signal to noise ratio (Gerig et al 1990).
What are the Structural MRI Brain Abnormalities in Schizophrenia?
Table 1 provides a summary of the post 1987 literature, and Table 2 provides a list of the subject N by diagnostic category for the studies presented in Table 1. It must be emphasized that there are substantial methodological variations between studies, some using a few thick slices for estimation of volumes, and others using thin–slice, small-voxel measurements. As noted above, our text evaluation of the findings for each ROI takes into account the quality of the studies as well as the “majority vote” outlined in Table 1, which should be referred to for each of the sections below. Figure 1 illustrates some of the ROI that have been most intensively studied in schizophrenia.
Table 2.
Study Subject N and Characteristics
Tot Subjs, Total N of Subjects; NL Ctrls, Normal Controls; SZ, Schizophrenic; SZAFF, Schizoaffective.
Subjects with temporal lobe epilepsy.
Subjects with Alzheimer’s disease.
Subjects with SZ or SZAFF.
Subjects with Schizotypal personality disorder.
NL twin in SZ discordant twin pair.
Eight SZs scanned on standard neuroleptics (NLs), re-scanned after change to clozapine versus 7 SZs scanned on std. NLs, re-scanned still on std. NLs.
Subjects with Bipolar and SZAFF disorder
Sixty-two first-episode SZs; 19 chronic SZs.
Thirty SZ first episode; 15 SZ chronic.
Fifty Schizophreniform; 28 of these at 2 year follow-up.
First episode psychosis: 50 schizophreniform, 13 SZAFF, 19 SZs, 2 Psychosis NOS, 1 SPD.
Subjects with SZ, SZAFF or Schizophreniform disorder.
Unipolar depression (all subjects in Hirayasu et al 1998a were first episode and also had psychotic features).
Subjects with schizophreniform disorder.
Six subjects with SZ; 5 with other psychoses.
Twelve subjects with major affective disorder, depressed (including SZAFF); 14 with unspec. mental & axis II disorders; 2 with organic brain syndrome.
Sixteen SZs with tardive dyskinesia (TD); 16 SZs without TD.
Forty-four SZs with no large Cavum Septi Pellucidi (CSP), 10 SZs with large CSP.
Thirteen psychiatric controls and 18 normal controls.
Non-schizophrenic inpatients.
Detoxified Chronic Alcoholics.
Figure 1.
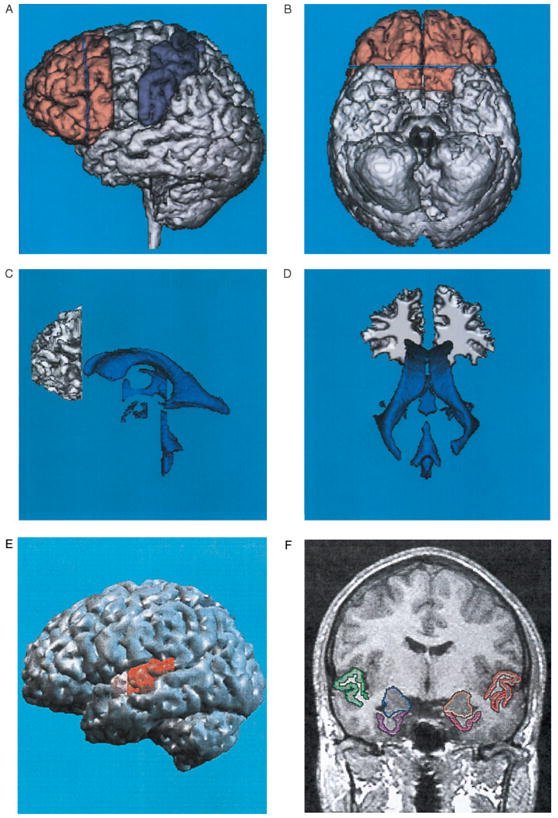
Illustrations, in healthy subjects, of brain Regions of Interest (ROI) frequently examined in schizophrenia. A: Left lateral view of a three–dimensional reconstruction of the prefrontal gray matter (shown in peach) in relationship to the precentral and postcentral gyri (shown in purple). The blue line within the prefrontal gray corresponds to the posterior landmark used for delineation of the white matter. B: Ventral view of the same brain as in A, and illustrates the orbitofrontal cortex. C: Left lateral view of a three–dimensional reconstruction of the prefrontal white matter (defined as in A) in relationship to the ventricles (same brain as in A). Note that the temporal horns of the lateral ventricles are mainly “virtual spaces” in this healthy subject. The open space in the area of the third ventricle is occupied by the massa intermedia, the midline thalamus. D: Posterior view of the same white matter and ventricles as in Part C. A, B, C, and D are adapted from Wible et al (1995). E: Left lateral view of a three dimensional reconstruction of the cortex, with pink indicating the anterior portion and red the posterior portion of the superior temporal gyrus (STG). F: SPGR coronal image (1.5 mm thick, 0.937×0.937 mm in plane voxels), showing the manually drawn outlines of regions of interest. This anterior–posterior location of this coronal slice is just posterior to the onset of the posterior portion of the STG in E, and is from the same subject. The regions of interest outlined are: the gray matter of the superior temporal gyrus (STG; subject left, red; subject right, green); more medially, the amygdala–hippocampal complex is shown (left, orange; right, blue) with the parahippocampal gyrus underneath (left, pink; right, purple). Adapted from Hirayasu et al (1998a).
An important question that arises in reviewing MRI studies is: Why do different studies of the same region have different findings? One likely major source is variation in the subject populations. Our impression is that an equally important factor is different definitions of ROI by different investigators. Other factors include the use of different scanners and acquisition protocols, as well as other methodological and technical differences, such as segmentation algorithms (algorithms that simultaneously work on the entire set of images are to be preferred over algorithms that process each slice individually). Future work can profitably try to reduce the variation in subjects by using selected populations imaged at similar points in the time course of the disorder and similar clinical symptom profiles. ROI definitions similar to those of previous studies should be used, if possible. Finally, as the quality of imaging equipment and segmentation algorithms becomes more standard, these technical variations will, we believe, account for less of the variance.
Whole Brain Volume
We conclude that there is little evidence for whole brain differences between schizophrenia and control populations. Only 19% of the 31 studies found whole brain volume differences, with four finding decreases and one study an increase. More methodologically advanced studies tend to find less difference.
CORRECTING FOR WHOLE BRAIN/INTRACRANIAL CONTENTS (ICC) DIFFERENCES IN SUBJECTS
Subjects may differ in brain and ICC volume independently of diagnosis for a psychiatric disorder, such as the well–known difference between men and women. Thus, corrections for ICC are standard in the field. This is usually done in either of two ways. The first method is to divide a particular ROI by the intracranial contents [i.e. (ROI/ICC], as is used in the ventricle/brain ratio measurement. The second method is to use regression–adjusted volumes, correcting the raw volumes in a population by the regression description of the relationship of the ROI volumes to ICC volumes in the appropriate control population. We find it useful for studies to report both corrected and raw (absolute) ROI volumes, since absolute volumes provide additional information needed by the reader in comparing ROI definitions.
Ventricles
The evidence is strong for a difference in lateral ventricle size, somewhat positive for third ventricle and zero for fourth ventricle size.
LATERAL VENTRICLE
Fully 77% of the 43 MRI studies report enlarged lateral ventricles, the most studied brain feature in the studies reviewed here. This 77% is about the same as the earlier literature on CT studies (75%). Moreover, even those studies not reporting overall ventricular enlargement often report enlargement in the temporal horn of the lateral ventricles (e.g., Shenton et al 1992 which is listed as a negative in Table 1).
THIRD VENTRICLE
A two–thirds majority of studies (67%, 16 of 24) report third ventricle enlargement.
FOURTH VENTRICLE
None of the 3 studies described differences from controls.
As we move to descriptions of brain parenchymal change, we will group studies by brain lobe, although, as will be discussed later, alterations in one lobe are often not independent of changes in other lobes.
Temporal Lobe
The main functional subdivisions within the temporal lobe include:
SUPERIOR TEMPORAL GYRUS
This includes: 1) Primary and secondary (association) auditory cortex, providing initial analysis of auditory signals; and 2) A language–related area in the posterior superior temporal gyrus, the planum temporale. Language function is usually left–lateralized in right–handed individuals.
MIDDLE AND INFERIOR TEMPORAL GYRI
These are linked to further processing of sensory stimuli, both auditory and visual. Some neurons in this area may be selectively responsive to complex and species–specific features, such as faces.
MEDIAL TEMPORAL LOBE STRUCTURES
1) Hippocampus and adjacent (parahippocampal and entorhinal) cortex are involved in laying down and retrieval of long–term memory through interconnections with neocortical areas; and 2) The amygdala is thought to be involved in emotion–related aspects of behavior, memory and learning. It may provide the emotional valence associated with memories and facilitate coding.
Because of temporal lobe links to auditory and language processing and the presence of thought disorder and auditory hallucinations as some of the main features of schizophrenia, the temporal lobe has been evaluated in numerous studies, and it is the brain lobe with the most consistently reported positive structural MRI findings.
WHOLE TEMPORAL LOBE
The 37 studies of whole temporal lobe (i.e. all structures lumped together) showed 62% with positive findings. The higher percentage of abnormalities in specifically defined ROI of Medial Temporal Lobe and superior temporal gyrus, as described below, suggests a non–diffuse distribution of temporal lobe structural changes.
MEDIAL TEMPORAL LOBE
Evaluating one or more of these structures (hippocampus, amygdala, parahippocampal gyrus, entorhinal cortex) led to positive findings in 77% of the 31 studies, one of the higher ROI percentages of abnormalities.
STG
The neocortical structure of superior temporal gyrus has recently been the subject of a number of studies, driven by the report of Barta et al (1990) that a reduction in volume in the anterior region was associated with hallucinations and our report (Shenton et al 1992) that the gray matter volume reduction in posterior STG was associated with thought disorder. Overall, 80% of the 15 studies showed abnormalities, the highest percentage of any cortical ROI.
Examination of the studies that did and did not separate gray from white matter is instructive, since all 7 of the studies evaluating gray matter found volume reductions, while a smaller percentage, 67%, of the 9 studies lumping gray and white matter found abnormalities in schizophrenia. It is of note that comparisons of STG white matter alone indicated no differences, although the same studies reported gray matter abnormalities (Menon et al 1995; Hajek et al 1997). These data seem to support our opinion that studies of cortical gyri should separately evaluate gray and white matter. Studies subdividing the STG into anterior and posterior regions have somewhat less inter–study agreement on which portion(s) are abnormal, likely due, at least in part, to differing definitions of subregions.
THE PLANUM TEMPORALE
This literally means the “temporal plain”, and was originally defined on the basis of its surface appearance in whole brain specimens. It includes the posterior portion of the STG. Most (N = 5) of the 8 studies in the literature report abnormalities in schizophrenia. Barta et al (1997a) review in some detail methodological and definitional differences between studies, which may account for differences in findings. Because most of the studies focus on reversal of asymmetry in schizophrenics from the usual L > R pattern, our table category of Planum Temporale includes studies with asymmetry differences without labeling them specifically, as is done for other ROI in the table.
Frontal Lobe
Schizophrenic subjects show cognitive and behavioral deficits that are frequently associated with frontal lobe damage in humans, such as deficits in performance of the Wisconsin Card Sorting Test, abnormalities in eye movement, and deficits in performance of spatial working memory tasks known to be impaired by frontal lesions in monkeys. Furthermore, both positron emission tomography (PET) and fMRI functional measures are often reported to be abnormal in prefrontal cortex in schizophrenia (see review in Wible et al 1995).
Thus, there has been a considerable interest in structural MRI studies of the frontal lobe. While 55% of the 33 structural MRI studies of the frontal lobe have reported abnormalities, almost an equal number have not (45%). This may be because reductions in prefrontal volume in schizophrenia are just at the threshold for MRI detection, and hence whether statistical significance is found may depend heavily on the subject group evaluated. It is also notable that the highly quantitative post–mortem study of Selemon et al 1998 found only a small (8%) reduction in prefrontal cortical thickness, a reduction that was not statistically significant, although significant abnormalities in density of various cell types were present in schizophrenia. A reduction in cortical thickness would of course appear as a gray matter volume reduction in MRI. Furthermore, even if the 8% change in volume were statistically significant, it would be at the threshold for MRI detection. Thus, these post–mortem data would be quite consistent with the observed findings in MRI studies, since random variation in subjects and imaging technology could easily account for the nearly even split in findings. Our group’s studies of whole prefrontal gray matter volumes (Wible et al 1995) found no mean differences between schizophrenics and controls; however, correlations of prefrontal volumes in schizophrenia with abnormal temporal lobe ROI volumes, and with negative clinical symptoms (Wible et al 1995) support our concept of the existence of a change in volume of prefrontal gray matter that may be subthreshold for MRI detection. It is also worth noting that evaluation of gray matter volumes of separately segmented frontal gyri has not yet been reported in schizophrenia, and it may be that this approach, for which the technical methodology has just been developed (Wible et al 1997) may show changes in volumes in some gyri but not in others.
Parietal Lobe
Of the 9 studies conducted, the number of studies reporting differences (44%) is nearly the same as those reporting no differences. Of the 4 studies with differences, only 2 were of volumes limited to the parietal lobe, while 1 included asymmetry differences. In general, the parietal lobe has not been studied in the same fine–grained detail as has the temporal lobe.
Occipital Lobe
As with parietal lobe, the findings are mixed. Three of the 7 studies report differences, while 4 do not. We are unaware of any gyral based ROI study for occipital lobe, an approach that has proved quite helpful in evaluating the temporal lobe.
Cortical Gray Matter Abnormalities in Schizophrenia: Diffuse or Localized?
In conceptualizing the etiology of brain alterations in schizophrenia, it makes considerable difference if one views the disorder as a generalized disorder of cortical gray matter, of equal intensity throughout, or whether the changes are (relatively) localized to one or several brain areas, in varying degrees of intensity. This issue was strongly raised by Zipursky et al (1992) who reported less gray matter volume in schizophrenic patients in all six cortical subregions, with all except one region attaining statistical significance (their regional definitions were geometric and were not based on sulco–gyral measurements). They concluded, “These findings have implications for studies of localized gray matter abnormalities and suggest that regional brain volume measurements need to be expressed in the context of possible widespread gray matter volume deficits in schizophrenia”. Their early study however, had some technical limitations, including thick slices (5 mm) and gaps (2.5 mm), and no refined segmentation procedure. Subsequent work from this group suggests differentiation of the degree of regional loss, with Sullivan et al (1998) reporting significantly greater volume deficits in the prefrontal and anterior superior temporal gray matter than in the more posterior cortical regions. Zipursky et al (1997), in another sample, found that gray matter volume deficits were significant in 8/12 cortical regions, but not in 4, also suggesting some localization.
One conclusion could be that the issue is largely semantic. If, by widespread, one means some changes in a number of regions, then the data support this conclusion. If however, it means diffuse and equal severity, the data do not support this. Table 1 shows that 6 of the 7 studies differentiating gray from white matter found evidence for localization of gray matter volume reduction. The four studies lumping gray and white matter in their measurements were evenly divided on localization, suggesting, as with STG, that gray–white matter differentiation is an important methodological advantage. Our conclusion is that there is very little evidence for diffuse gray matter changes in schizophrenia, and that some areas are more profoundly affected than others. Table 1 suggests that the temporal lobe gray matter of the STG and medial temporal lobe is especially affected. Pearlson (1997) has explicitly hypothesized that it is the heteromodal association cortex that is affected, cortex which includes dorsolateral pre-frontal, inferior parietal, and superior temporal gyrus regions. This investigator functionally describes heteromodal cortex as a highly integrated, reciprocally interconnected system that coordinates higher order cortical functions. As described in Table 1, Schlaepfer et al (1994) have data supporting gray matter volume reductions in all these areas, but the totality of data presented in Table 1 suggest that some domains of heteromodal cortex may be more affected than others and, further, that non–heteromodal cortex volume reductions are also present in the medial temporal lobe.
Subcortical Structures
THALAMUS
This structure has dense reciprocal projections with cerebral neocortex and with limbic structures, and forms a key part of the pathway for transmission of sensory information to cortex. Several theories have postulated its involvement in schizophrenia. Post–mortem studies have demonstrated neuroanatomical abnormalities in particular nuclei of the thalamus of schizophrenic patients (e.g., Pakkenberg 1987 for the medial dorsal nuclei), although the findings have been inconsistent.
Four of the 6 MRI studies reported thalamic abnormalities in schizophrenic patients compared to controls. Three of these positive studies were from the Andreasen laboratory, of which one study evaluated image intensity, not volume. The findings of the Andreasen et al study (1994a) of image intensity suggesting abnormalities in thalamic interconnections were actually compatible with a negative volumetric study in our laboratory, which found correlations between thalamic volumes and prefrontal white matter in the schizophrenic but not the control group (Portas et al 1998).
CORPUS CALLOSUM
The corpus callosum is a mid-line structure of white matter tracts connecting the two hemispheres. Since, as shown above, there are abnormalities in cortical gray matter in schizophrenia, it is reasonable to suppose that the hemispheric cortical interconnections might also be abnormal. As shown in Table 1, two thirds of the 18 MRI studies listed have found abnormalities (the reader is cautioned that our review of studies of this structure is less complete than for other ROI). Most studies measure the overall area of the corpus callosum in the midsagittal slice while some additionally parcellate the corpus callosum into subdivisions. With only one slice to examine per MRI, the data are vulnerable to errors in alignment, slice thickness and choice of the “best midsagittal slice”. It is also difficult to compare studies as measurements of thickness, shape, area of subsections and length of the corpus callosum are not consistent across studies. Gender needs also to be taken into account as the corpus callosum has been reported to show gender dimorphism in both shape and size. More studies, especially those that analyze shape (e.g., DeQuardo et al 1996) may help to clarify the presence of abnormalities in schizophrenia.
BASAL GANGLIA
These structures, because of their dopaminergic input and their function as a “multilaned throughway for separate streams of influence over the thalamus and motor structures … ” (Goldman–Rakic and Selemon 1990), have been of great interest to schizophrenia researchers (e.g., Carlsson and Carlsson 1990; Swerdlow and Koob 1987). There are now several studies showing an increase in volume in subjects receiving chronic “typical” neuroleptic treatment (see Table 1), an enlargement which appears to decrease when the “typical” is changed to an “atypical” neuroleptic (Chakos et al 1995). Studies in subjects with minimal neuroleptic treatment tend to show no (Chakos et al 1994) or decreased (Ohnuma et al 1997) volume. Most of the negative finding studies were done using older technology (e.g., Kelsoe et al 1988; Young et al 1991; Mion et al 1991).
CEREBELLUM
Modern functional studies suggest the cerebellum has a much greater role in cognition than the traditional view of its being involved with the planning and timing of movement. Recent evidence suggests that it also plays a role in higher cognitive functions, including timing of cognitive processes, and some structural MRI data in healthy controls is compatible with this hypothesis (Paradiso et al 1997). As shown in Table 1, MRI studies of the cerebellum in schizophrenia have yielded mainly negative results. Although the use of a single midsagittal slice of the vermian area, rather than volumes is problematic (e.g., Aylward et al 1994, 1997; Nasrallah et al 1991; Rossi et al 1993), the volumetric study of Andreasen et al (1994b) found no difference in total cerebellar brain tissue volume. Nevertheless, finer ROI subdivisions, such as of vermis and gray and white matter, might be useful.
CAVUM SEPTI PELLUCIDI
The cavum septi pellucidi (CSP) is the space (cavum) between the two leaflets of the septum pellucidum, the translucent midline membrane separating the left and right lateral ventricles. In human normal development, 85% of individuals show fusion of the two leaflets within 6 months of life; since some normals show a small CSP, most studies define abnormality as a large CSP, usually 6 mm or more long (see Kwon et al 1998a for further discussion). Fusion of the CSP may be associated with growth of the hippocampus and corpus callosum, and incomplete fusion and the presence of a large CSP, may, in turn, reflect possible neurodevelopmental anomalies of the hippocampus and corpus callosum. Supporting this assumption is the finding of Nopoulos et al (1996) that the presence of a large CSP was associated with temporal lobe volume reduction. Similarly, Kwon et al (1998a) found negative correlations of ~0.6 between the extent of the CSP and the volume of the left and right hippocampus of schizophrenics. This neurodevelopmental anomaly has also been associated with poorer treatment response and outcome (Fukuzako et al., 1996a).
Do the above abnormalities form subgroups of schizophrenic patients?
That is, do the abnormalities just described offer evidence for clusters of MRI abnormalities that, in turn, represent subgroups of schizophrenia? A later section of this review discusses general hypotheses (including those of our own group) that temporal lobe abnormalities may be associated with a subgroup of patients with positive symptoms, including formal thought disorder (disorganization) and that frontal abnormalities may be associated with more negative symptoms. Our opinion is that such subgroups are not yet strongly supported by the data. One of the major problems is that the time–consuming nature of ROI delineation is a major obstacle to defining ROI in enough brain regions in the same group of patients to define subgroups, i.e. to define which of the many possible ROI abnormalities tend to occur together. As discussed in the last section, use of automated methods for ROI definition may, in the future, make a systematic study of many ROI in the same subjects more feasible.
MRI Volume Alterations: Neurodevelopmental and/or Progression Over Time?
In responding to this question, perhaps the most important point to be made is that neurodevelopmental and progressive changes are not mutually exclusive, as emphasized by reports from an American College of Neuropsychopharmacology Satellite Meeting (1991), and from the National Institute of Mental Health (NIMH)–sponsored Carmel Conference on Neuroimaging in Schizophrenia (summarized in McCarley et al 1996). The Carmel Conference report described the major models for the longitudinal time course of schizophrenia as:
Purely neurodevelopmental events (genetically programmed, infections, etc.)
“Two hit” model, with progression of pathology after the onset of symptoms.
First Hit, Neurodevelopmental
Evidence includes: Temporal lobe sulco–gyral patterns are formed in the third trimester of gestation; pattern abnormalities in schizophrenics have been reported both by post–mortem studies (Jakob and Beckman 1986) and by in vivo MRI studies (e.g., Kikinis et al 1994). The CSP data described above also support a neurodevelopmental origin. There have been only rare case reports of ventricular enlargement prior to the onset of psychosis, and consequently it is not known if they represent a usually undetected, although common, finding or may be quite unusual.
While pre–onset data are sparse, there are now an increasing number of reports of changes detectable at the onset of the first psychotic episode, and if one includes abstract reports, these include almost the full spectrum of MRI volume abnormalities reported in chronic patients. These include MRI volume increases and asymmetry alterations of the ventricular system (e.g., Degreef et al 1990, 1992a; DeLisi et al 1991, 1992, 1995; Lim et al 1996; Nopolous et al 1995), asymmetry changes in cortical regional volumes (Bilder et al 1994), gray matter volume reductions in cortex (Lim et al 1996), in frontal lobe (Nopoulos et al 1995), in STG (Hirayasu et al 1998a), in hippocampus/amygdala (e.g., Bogerts et al 1990; Hirayasu et al 1998a) and abnormalities of the corpus callosum (Hoff et al 1994), planum temporale (DeLisi et al 1994) and CSP (Degreef et al 1992c). It must be noted, however, that symptoms may have been present for months and even years before the first hospitalization, and that these findings do not necessarily imply a developmental origin.
Second Hit, Ongoing Changes After Onset of Symptoms
The initial data from longitudinal structural studies are compatible with the occurrence of progression of neuropathology over the early phases of the illness. A detailed survey of CT changes is beyond the scope of this review, but, while CT studies in general have found no progression, Garver (1997) has reviewed CT data, and has reached the still controversial conclusion that cross–study analysis of the CT ventricular brain ratio (VBR) literature supports a bimodal distribution of change in VBR over time. While about 75% of patients show no change over time, about 25% do show increased VBR, and Garver suggests this latter group may be suffering from a progressive form of the illness. (A more detailed review of both CT and MRI progressive changes is found in Anderson et al 1998). From our laboratory, O’Donnell et al (1995) have described a rate of age–related increased P300 latency in schizophrenia compared with controls that are compatible with progressive neural alteration.
More recently, MRI data on parenchymal and CSF changes have become available. Gur et al (1998), for example, evaluated 20 first episode and 20 chronic patients on whole brain CSF, whole frontal lobes, whole temporal lobes and found, after a mean rescan interval of 31 months, that frontal lobe volume significantly decreased in schizophrenics compared with controls. First episode patients had greater temporal lobe volume reduction than chronics, but both of these groups were not different from controls on this scan–rescan measure. DeLisi et al (1997) examined, in follow– up studies of first episode schizophrenics, the cerebral hemispheres, temporal lobe, medial temporal lobe, lateral ventricles, cerebellum, caudate nucleus, corpus callosum, and sylvian fissure. Repeat MRI scans done 4 or more years after initial scans, showed rate of volume decrease was greater in schizophrenics for left and right hemispheres, right cerebellum, corpus callosum segment, and ventricles. Earlier, Degreef et al (1991) had reported no change in cortical and ventricular volume over a 1–2 year rescan interval in 13 first episode patients. Longitudinal studies are an area of very active current work, and a number of preliminary findings (e.g., Hirayasu et al 1998b) are compatible with progression of gray matter changes; however, more data are needed to provide definitive evidence.
Possible Causative Agents/Mechanisms For Post–Onset Changes
There is a rapidly growing body of work that implicates abnormal excitatory amino acid (EAA) neurotransmission in schizophrenia (McCarley et al 1996 provides a review, with pointers to the literature). Although still quite controversial, this mechanism could be a possible cause of both developmental abnormalities (where EAA–mediated neural guide mechanisms are well known), and of ongoing, use– dependent cellular damage through excitotoxic effects. We note excitotoxic changes can involve reduction in dendritic neuropil as well as cellular loss, as shown by studies in the hippocampus, where excitatory amino acid release mediates stress–induced atrophy of apical dendrites, which likely involves disassembly of the dendritic cytoskeleton (McEwen and Magarinos 1997). It is of interest that in Olney’s animal model, the neurotoxic effects of the N-methyl-D-aspartate (NMDA) antagonist MK801 are maximal near young adulthood, the time of maximal risk of schizophrenia onset (Olney and Farber 1995). Our basic science laboratory has used the in vitro rat hippocampus to study the basic recurrent inhibitory circuit: pyramidal cells activate GABAergic inhibitory neurons via NMDA receptors, and, in turn, are inhibited by GABAergic neurotransmission. We found that agents interfering with NMDA neurotransmission, such as 2–amino–5–phosphonovalerate (APV) and the endogenous substance N–acetyl–aspartyl– glutamate (NAAG, found to be increased in schizophrenics by Tsai and Coyle 1995), differentially reduced recurrent inhibition as compared with the excitatory projections of hippocampal pyramidal cells. Thus, increased levels of NMDA antagonists would result in an overactivation of projection circuits, with potential neurotoxic effects. It may also have cognitive consequences. Using a realistic biophysical model of this circuitry, our lab (Grunze et al 1996) found that NMDA antagonists led to a consequent aberrant spread of activation during associative learning. We thus suggested that some schizophrenic symptoms, such as loose associations, are consistent with a failure of this recurrent inhibitory circuit and its analogs in neocortex. Further support for the role of NMDA receptors comes from the fact that NMDA antagonists, such as phencyclidine (PCP or “angel dust”), mimic both the positive and negative symptoms of schizophrenia and interact with dopaminergic neurotransmission (Lahti et al 1995). EAA neurotransmission abnormalities do not, of course, exclude abnormalities of other neurotransmitters, and, indeed, current work indicates substantial dopamine– glutamate interaction.
The model of failure of recurrent inhibition is also compatible with the extensive body of work of Freedman and collaborators who have studied how blockade of the alpha 7 nicotinic receptor, localized to hippocampal inter-neurons, causes loss of the inhibitory gating of P50 response to auditory stimuli (Freedman et al 1994). Support for this nicotinic receptor mechanism as a pathophysiological element in sensory gating deficits in schizophrenia comes from the finding of linkage of the P50 deficit to a polymorphism at the site of the alpha 7 receptor on chromosome 15 (Freedman et al 1997). Orr–Urtreger et al (1997) have developed a null mutation of the nicotinic alpha 7 subunit in mice, which apparently showed normal development and neurological function, but have not yet been studied in vivo for subtle abnormalities, such as gating. These mice may prove useful for further elucidation of the in vivo functional role of this gene product.
Association of MRI Abnormalities With Clinical Symptoms: A Selective Review
Kraepelin (1919/1971) speculated that temporal lobe abnormalities might be the source of what today would be termed positive symptoms, while the frontal lobe might be the seat of more negative symptoms. This prediction, in general, has proven to be consistent with modern data. Space allows us here only a selective review of some of the correlations. The reader is further cautioned that in our discussion of associations, we are not claiming a “phrenological” exclusivity of function with any particular structure, rather, a description of a prominent influence since it is likely most symptom production will involve multiple brain structures. The reader is finally cautioned that significant clinical–MRI correlations are often highlighted in the results of studies, while absence of correlations may not be reported (the Rosenthal “file drawer” problem discussed earlier). Further studies are needed before the tentative associations described below can be described as on solid footing.
Temporal Lobe
The STG and medial temporal lobe structures are densely interconnected, and may be considered as linking memory and associations involving language and speech, particularly in the left (dominant) hemisphere. As we cautioned above, reports of correlations with one area should not be taken to exclude participation of other areas.
SUPERIOR TEMPORAL GYRUS
The STG MRI abnormalities have been a rich source of correlations with schizophrenia clinical data. Barta et al (1990) described an anterior STG volume reduction associated with hallucinations; an hallucination–STG association was confirmed by Flaum et al (1995a). Our lab has described an inverse association between left posterior STG volume and with formal thought disorder and delusions (Shenton et al 1992; McCarley et al 1993), a finding that was confirmed by Menon et al (1995). Barta et al (1997a) also found reduced gray matter volume of the posterior STG (planum temporale) to be associated with thought disorder, and Marsh et al (1997) found that worse scores on Brief Psychiatric Rating Scale (BPRS)–Thinking Disturbance Factor were selectively associated with a smaller gray matter volume of the left posterior STG. Vita et al (1995) also found severity of thought disorder to be associated with decreased left and increased right STG volume. Flaum et al (1995a) found positive psychotic symptoms in general to be associated with reduced whole STG volumes. Finally, these MRI abnormalities are consonant with reports of functional abnormalities in P300 in schizophrenia (McCarley et al 1993), PET studies (reviewed by Pearlson 1997), attentional processes (Posner et al 1988), and with hypotheses consonant with the view that abnormal asymmetries represent a genetic/developmental abnormality in schizophrenia (e.g., Crow et al 1989; Crow 1990a, b).
MEDIAL TEMPORAL LOBE
Consistent with our descriptions of the anatomical interconnections, clinical correlations with altered medial temporal lobe volumes tend to parallel those of STG, in that they are associated with positive symptoms. For example, Bogerts et al (1993) reported a correlation between bilateral reduction in medial temporal lobe structures, as a whole, and the psychotic factor on the BPRS. Goldberg et al (1994), in an evaluation of monozygotic twin pairs discordant for schizophrenia, reported a correlation between reduced volume in the left hippocampus and an increase in positive symptoms, as well as a disruption in logical memory in schizophrenic twins compared to non–schizophrenic twins. The 15O H2O PET study of Silbersweig et al (1995), points to the activation of the hippocampus in auditory hallucinations. Also consonant with STG–medial temporal lobe interconnections are the findings from our laboratory (Nestor et al 1993) of an association between poor scores on verbal memory, abstraction, and categorization, and reduced volume (bilaterally) in both the parahippocampal gyrus and in posterior STG. They may possibly be related to a dysfunctional semantic system in schizophrenia. Similarly, O’Donnell et al (1993), also from our laboratory, reported an association between reduced medial temporal lobe volume (as a whole), reduced left posterior STG, and reduced N200 amplitude, an event related potential associated with categorization of objects and events in the world.
Frontal Lobe
Functionally, the frontal lobe has been intensely studied and clear associations with functions disturbed in schizophrenia has been established, such as working memory; however, structural MRI–clinical correlations are sparse, perhaps due to the small extent of the frontal volume change and the failure to segment into gyri, which might have stronger correlations. In general, most investigators have postulated associations between frontal abnormalities and negative symptoms. Supporting this is our laboratory’s finding (Wible et al 1995) of Scale for Assessment of
Negative Symptoms (SANS) scores having a negative correlation with left prefrontal cortical white matter volume in schizophrenia; however, the picture is by no means clear, since many investigators find it difficult to correlate negative symptoms and frontal volumes and with some results suggesting the opposite, as Buchanan et al (1993) found that non–deficit patients had significantly smaller right and left total prefrontal volumes than did deficit patients.
Differences Between Schizophrenic and Affective Psychosis
One of the long–standing conundrums in psychiatry is whether the psychosis associated with mood disorder and that associated with schizophrenia represent different disorders or variants of a single disorder of psychosis that has somewhat different expressions. This question has proven difficult to resolve on the basis of clinical course alone, and there is a recent trend to use structural imaging to determine differences in the brain structure, the “endophenotype”, of each disorder. Presently available data suggest a reduction in gray matter volumes in certain cortical and medial temporal lobe regions in schizophrenia, but not in bipolar disorder, or at least to the same degree.
Hirayasu et al (1998a), in our laboratory, focused on the temporal lobe and compared first psychotic episode subjects with schizophrenia and those with mood disorder with psychosis. The mood disorder patients were mainly bipolar, in a manic phase, and statistical results remained the same when the few psychotic unipolar subjects were excluded. There was no difference in ICC among the two patient groups and controls, but schizophrenics were different from the two other groups in having a smaller gray matter volume in the posterior portion of the STG, and a significant left <right asymmetry. Schizophrenics had medial temporal lobe volume reduction (posterior hippocampus) compared with controls, but affective psychotics had an intermediate volume reduction and were not statistically different from either group on this measure, but did show more left <right asymmetry than did controls.
Pearlson and colleagues (1997) studied non–first–episode bipolar and schizophrenic subjects and also found STG and medial temporal lobe abnormalities in schizophrenics, but they used slightly different ROI definitions and had somewhat different localizations (bilateral entorhinal cortex, left amygdala, and anterior STG volume reduction). They, too, found an asymmetry alteration in posterior STG. The left amygdala was smaller and right anterior STG larger in bipolar but not in schizophrenia patients. This was the same group of schizophrenic subjects previously discussed in this review in the Schlaepfer et al (1994) paper, which also reported that bipolars did not have heteromodal cortex volume reduction. Global cortical gray matter volume did not differ among the bipolar, schizophrenic and control groups. Zipursky et al (1997) similarly found regional deceases in gray matter volume in schizophrenic but not bipolar non–first episode subjects, but, in their schizophrenia population, there was also a decrease in global gray matter volume. Harvey et al (1993) also noted a decrease in cortical volume in schizophrenics, but not in bipolars, who were not different from controls.
Meta–analytic comparisons by Elkis et al (1995) revealed statistically significant (p <.001) moderate composite effect sizes (d) for the comparisons of patients with mood disorders with controls on both ventricular enlargement (d = .44) and sulcal prominence (d = .42). Patients with schizophrenia had significantly greater ventricular enlargement than patients with mood disorders (p = .002), but the effect size was small (d = −.20). There were too few studies comparing these patient groups on sulcal prominence to support a quantitative meta–analysis. For further information on mood disorders and structural MRI, the recent reviews by Soares and Mann (1997) and by Steffens and Krishnan (1998) should be consulted.
The Future
The technical quality and the richness of information extracted from structural MRI studies have progressed considerably over the past decade. Additionally, new segmentation algorithms have improved the accuracy of tissue classification. Nonetheless, the major hindrance to anatomically–based studies of ROI is the labor–intensive nature of manually tracing ROI (the current gold standard), even with the assistance of semi–automated programs in defining voxels composed of gray matter, white matter and CSF. In many ways, our current technology is still much like that of monks’ hand–copying manuscripts before the invention of the printing press. The next decade will likely see the development of sophisticated methodologies for the automated definition of ROI that are faithful to anatomically and physiologically–based divisions of the brain. Some of these techniques, such as “brain warping” of an atlas to match and thereby define features of subject brains, have already proven feasible for the basal ganglia (Iosifescu et al 1997) and thalamus (unpublished data from our laboratory). The definition of multiple ROI in the same group of subjects is also essential for determining how each ROI abnormality relates to other ROIs, and for the detection of any subgroups of schizophrenic endophenotypes by the presence of distinct patterns of clustering of ROI abnormalities. Furthermore, evaluating multiple brain regions in a large number of subjects will allow a further refinement of links between structural abnormalities and behavioral and cognitive manifestations of schizophrenia. Image analyses in the future, will also likely involve the description and comparison of ROI shapes in addition to volume measures, and new MRI–based technologies, such as MR brain diffusion tensor imaging techniques, will allow us to define white matter abnormalities by tracing the dynamics of water diffusion in axons. These innovations promise a further revolution in our understanding of the pathophysiology of schizophrenia.
Acknowledgments
This work was supported by NIMH 40977, and by MERIT and Schizophrenia Center Awards from the Department of Veterans Affairs (RWM); NIMH 01110 and 50747 (MES).
References
- American College of Neuropsychopharmacology Satellite Meeting. Longitudinal perspectives on the pathophysiology of schizophrenia. Examining the neurodevelopmental versus neurodegenerative hypotheses. Schizophr Res. 1991;5(3):183–210. [PubMed] [Google Scholar]
- Anderson JE, O’Donnell BF, McCarley RW, Shenton ME. Progressive changes in Schizophrenia: Do they exist and what do they mean? Restor Neurol Neurosci. 1998;12:1–10. [PubMed] [Google Scholar]
- Andreasen NC, Nasrallah HA, Dunn V, Olson SC, Grove WM, Ehrhardt JC, et al. Structural abnormalities in the frontal system in Schizophrenia. Arch Gen Psychiatry. 1986;43:136. doi: 10.1001/archpsyc.1986.01800020042006. [DOI] [PubMed] [Google Scholar]
- Andreasen NC, Ehrhardt JC, Swayze VW, II, Alliger RJ, Yuh WTC, Cohen G, et al. Magnetic resonance imaging of the brain in Schizophrenia: The pathophysiologic significance of structural abnormalities. Arch Gen Psychiatry. 1990;47:35–44. doi: 10.1001/archpsyc.1990.01810130037006. [DOI] [PubMed] [Google Scholar]
- Andreasen NC, Arndt S, Swayze VW, II, Cizadlo T, Flaum M, O’Leary D, et al. Thalamic abnormalities in schizophrenia visualized through magnetic resonance image averaging. Science. 1994a;266:294–298. doi: 10.1126/science.7939669. [DOI] [PubMed] [Google Scholar]
- Andreasen NC, Flashman L, Flaum M, Arndt S, Swayze VW, II, O’Leary DS, et al. Regional brain abnormalities in Schizophrenia measured with magnetic resonance imaging. JAMA. 1994b;272:1763–1769. [PubMed] [Google Scholar]
- Aylward EH, Roberts–Twillie JV, Barta PE, Kumar AJ, Harris GJ, Geer M, Peyser CE, et al. Basal ganglia volumes and white matter hyperintensities in patients with bipolar disorder. Am J Psychiatry. 1994;15:687–693. doi: 10.1176/ajp.151.5.687. [DOI] [PubMed] [Google Scholar]
- Aylward EH, Augustine A, Li Q, Barta PE, Pearlson GD. Measurement of frontal lobe volumes on magnetic resonance imaging scans. Psychiatry Res. 1997;75:23–30. doi: 10.1016/s0925-4927(97)00026-7. [DOI] [PubMed] [Google Scholar]
- Barr WB, Ashtari M, Bilder RM, Degreef G, Lieberman JA. Brain morphometric comparison of first episode Schizophrenia and temporal lobe epilepsy. Br J Psychiatry. 1997;170:515–519. doi: 10.1192/bjp.170.6.515. [DOI] [PubMed] [Google Scholar]
- Barta PE, Pearlson GD, Powers RE, Richards SS, Tune LE. Auditory hallucinations and smaller superior temporal gyral volume in schizophrenia. Am J Psychiatry. 1990;147:1457–1462. doi: 10.1176/ajp.147.11.1457. [DOI] [PubMed] [Google Scholar]
- Barta PE, Pearlson GD, Brill LB, Royall R, McGilchrist IK, Pulver AE, et al. Planum temporale asymmetry reversal in Schizophrenia: Replication and relationship to gray matter abnormalities. Am J Psychiatry. 1997a;154:661–667. doi: 10.1176/ajp.154.5.661. [DOI] [PubMed] [Google Scholar]
- Barta PE, Powers RE, Aylward EH, Chase GA, Harris GJ, Rabins PV, et al. Quantitative MRI volume changes in late onset Schizophrenia and Alzheimer’s disease compared to normal controls. Psychiatry Res. 1997b;68:65–75. doi: 10.1016/s0925-4927(96)02751-5. [DOI] [PubMed] [Google Scholar]
- Becker T, Elmer K, Mechela B, Schneider F, Taubert S, Schroth G, et al. MRI findings in the medial temporal lobe structures in Schizophrenia. Euro Neuropsychopharm. 1990;1:83–186. doi: 10.1016/0924-977x(90)90018-6. [DOI] [PubMed] [Google Scholar]
- Becker T, Elmer K, Schneider F, Schneider M, Grodd W, Bartels M, et al. Confirmation of reduced temporal limbic structure volume on magnetic resonance imaging in male patients with Schizophrenia. Psychiatry Res. 1996;67:135–143. doi: 10.1016/0925-4927(96)03002-8. [DOI] [PubMed] [Google Scholar]
- Bilder RM, Wu H, Bogerts B, Degreef G, Ashtari M, Alvir JMJ, et al. Absence of regional hemispheric volume asymmetries in first–episode Schizophrenia. Am J Psychiatry. 1994;151:1437–1447. doi: 10.1176/ajp.151.10.1437. [DOI] [PubMed] [Google Scholar]
- Blackwood DHR, Young AH, McQueen JK, Martin MJ, Rox-borough HM, Muir WJ, et al. Magnetic resonance imaging in Schizophrenia: Altered brain morphology associated with P300 abnormalities and eye tracking dysfunction. Biol Psychiatry. 1991;30:753–769. doi: 10.1016/0006-3223(91)90232-b. [DOI] [PubMed] [Google Scholar]
- Bogerts B, Ashtari M, Degreef G, Alvir JMJ, Bilder RM, Lieberman JA. Reduced temporal limbic structure volumes on magnetic resonance images in first episode Schizophrenia. Psychiatry Res: Neuroimaging. 1990;35:1–13. doi: 10.1016/0925-4927(90)90004-p. [DOI] [PubMed] [Google Scholar]
- Bogerts B, Lieberman JA, Ashtari M, Bilder RM, Degreef G, Lerner G, et al. Hippocampus–amygdala volumes and psychopathology in chronic Schizophrenia. Biol Psychiatry. 1993;33:236–246. doi: 10.1016/0006-3223(93)90289-p. [DOI] [PubMed] [Google Scholar]
- Bornstein RA, Schwarzkopf SB, Olson SC, Nasrallah HA. Third–ventricle enlargement and neuropsychological deficit in Schizophrenia. Biol Psychiatry. 1992;31:954–961. doi: 10.1016/0006-3223(92)90121-f. [DOI] [PubMed] [Google Scholar]
- Breier A, Buchanan RW, Elkashef A, Munson RC, Kirkpatrick B, Gellad F. Brain morphology and Schizophrenia: A magnetic resonance imaging study of limbic, prefrontal cortex, and caudate structures. Arch Gen Psychiatry. 1992;49:921–926. doi: 10.1001/archpsyc.1992.01820120009003. [DOI] [PubMed] [Google Scholar]
- Buchanan RW, Breier A, Kirkpatrick B, Elkashef A, Munson RC, Gellad F, et al. Structural abnormalities in deficit and nondeficit Schizophrenia. Am J Psychiatry. 1993;150:59–65. doi: 10.1176/ajp.150.1.59. [DOI] [PubMed] [Google Scholar]
- Buchsbaum MS, Someya T, Teng CY, Abel L, Chin S, Najafi A, et al. PET and MRI of the thalamus in never–medicated patients with Schizophrenia. Am J Psychiatry. 1996;153:191–199. doi: 10.1176/ajp.153.2.191. [DOI] [PubMed] [Google Scholar]
- Buchsbaum MS, Yang S, Hazlett E, Siegel BV, Germans M, Haznedar M, et al. Ventricular volume and asymmetry in schizotypal personality disorder and Schizophrenia assessed with magnetic resonance imaging. Schizophr Res. 1997;27:45–53. doi: 10.1016/S0920-9964(97)00087-X. [DOI] [PubMed] [Google Scholar]
- Carlsson M, Carlsson A. Interaction between glutamatergic and monoaminergic systems within the basal ganglia: Implications for Schizophrenia and Parkinson’s disease. Trends in Neuroscience. 1990;13:272–276. doi: 10.1016/0166-2236(90)90108-m. [DOI] [PubMed] [Google Scholar]
- Casanova MF, Zito M, Goldberg T, Abi–Dargham A, Sanders R, Bigelow LB, et al. Shape distortion of the corpus callosum of monozygotic twins discordant for Schizophrenia. Schizophr Res. 1990;3:155–156. doi: 10.1016/0920-9964(90)90049-d. [DOI] [PubMed] [Google Scholar]
- Chakos MH, Lieberman JA, Bilder RM, Borenstein M, Lerner G, Bogerts B, et al. Increase in caudate nuclei volumes of first–episode schizophrenic patients taking antipsychotic drugs. Am J Psychiatry. 1994;151:1430–1436. doi: 10.1176/ajp.151.10.1430. [DOI] [PubMed] [Google Scholar]
- Chakos MH, Lieberman JA, Alvir J, Bilder R, Ashtari M. Caudate nuclei volumes in schizophrenic patients treated with typical antipsychotics or clozapine. Lancet. 1995;345:456–457. doi: 10.1016/s0140-6736(95)90441-7. [DOI] [PubMed] [Google Scholar]
- Coffman JA, Schwarzkopf SB, Olson SC, Nasrallah HA. Midsagittal cerebral anatomy by magnetic resonance imaging: The importance of slice position and thickness. Schizophr Res. 1989;2:287–294. doi: 10.1016/0920-9964(89)90005-4. [DOI] [PubMed] [Google Scholar]
- Colombo C, Abbruzzese M, Livian S, Scotti G, Locatelli M, Bonfanti A, et al. Memory functions and temporal limbic morphology in Schizophrenia. Psychiatry Res Neuroimaging. 1993;50:45–56. doi: 10.1016/0925-4927(93)90023-b. [DOI] [PubMed] [Google Scholar]
- Colombo C, Bonfanti A, Scarone S. Anatomical characteristics of the corpus callosum and clinical correlates in Schizophrenia. Euro Arch Psychiatry Clin Neuroscience. 1994;243:244–248. doi: 10.1007/BF02191582. [DOI] [PubMed] [Google Scholar]
- Corey–Bloom J, Jernigan T, Archibald S, Harris MJ, Jeste DV. Quantitative magnetic resonance imaging of the brain in late–life Schizophrenia. Am J Psychiatry. 1995;152:447–449. doi: 10.1176/ajp.152.3.447. [DOI] [PubMed] [Google Scholar]
- Crow TJ, Ball J, Bloom SR, Brown R, Bruton CJ, Colter N, et al. Schizophrenia as an anomaly of development of cerebral asymmetry: A postmortem study and a proposal concerning the genetic basis of the disease. Arch Gen Psychiatry. 1989;46:1145–1150. doi: 10.1001/archpsyc.1989.01810120087013. [DOI] [PubMed] [Google Scholar]
- Crow TJ. The continuum of psychosis and its genetic origins: The 65th Maudsley lecture. Br J Psychiatry. 1990a;156:788–797. doi: 10.1192/bjp.156.6.788. [DOI] [PubMed] [Google Scholar]
- Crow TJ. Temporal lobe assymetries as the key to the etiology of Schizophrenia. Schizophr Bull. 1990b;16:433–443. doi: 10.1093/schbul/16.3.433. [DOI] [PubMed] [Google Scholar]
- Dauphinais D, DeLisi LE, Crow TJ, Alexandropoulos K, Colter N, Tuma I, et al. Reduction in temporal lobe size in siblings with Schizophrenia: A magnetic resonance imaging study. Psychiatry Res: Neuroimaging. 1990;35:137–147. doi: 10.1016/0165-1781(90)90156-y. [DOI] [PubMed] [Google Scholar]
- Degreef G, Bogerts B, Ashtari M, Lieberman JA. Ventricular system morphology in first episode Schizophrenia: A volumetric study of ventricular subdivisions on MRI. Schizophr Res. 1990;3:18. [Google Scholar]
- Degreef G, Ashtari M, Wu HW, Borenstein M, Geisler S, Lieberman J. Follow–up MRI study in first–episode Schizophrenia. Schizophr Res. 1991;5:204–206. doi: 10.1016/0920-9964(91)90075-3. [DOI] [PubMed] [Google Scholar]
- Degreef G, Ashtari M, Bogerts B, Bilder RM, Jody DN, Alvir JMJ, et al. Volumes of ventricular system subdivisions measured from magnetic resonance images in first–episode schizophrenic patients. Arch Gen Psychiatry. 1992a;49:531–537. doi: 10.1001/archpsyc.1992.01820070025004. [DOI] [PubMed] [Google Scholar]
- Degreef G, Bogerts B, Falkai P, Greve B, Lantos G, Ashtari M, et al. Increased prevalence of the cavum septum pellucidum in magnetic resonance scans and post–mortem brains of schizophrenic patients. Psychiatry Res: Neuroimaging. 1992b;45:193–199. doi: 10.1016/0925-4927(92)90009-s. [DOI] [PubMed] [Google Scholar]
- Degreef G, Lantos G, Bogerts B, Ashtari M, Lieberman J. Abnormalities of the septum pellucidum on MR scans in first–episode schizophrenic patients. Am J Neuroradiology. 1992c;13:835–840. [PMC free article] [PubMed] [Google Scholar]
- DeLisi LE, Dauphinais ID, Gershon ES. Perinatal complications and reduced size of brain limbic structures in familial Schizophrenia. Schizophr Bull. 1988;14:185–191. doi: 10.1093/schbul/14.2.185. [DOI] [PubMed] [Google Scholar]
- DeLisi LE, Hoff AL, Schwartz JE, Shields GW, Halthore SN, Gupta SM, et al. Brain morphology in first–episode schizophrenic–like psychotic patients: A quantitative magnetic resonance imaging study. Biol Psychiatry. 1991;29:159–175. doi: 10.1016/0006-3223(91)90044-m. [DOI] [PubMed] [Google Scholar]
- DeLisi LE, Strizke P, Riordan H, Holan V, Boccio A, Kushner M, et al. The timing of brain morphological changes in Schizophrenia and their relationship to clinical outcome. Biol Psychiatry. 1992;31:241–254. doi: 10.1016/0006-3223(92)90047-4. [DOI] [PubMed] [Google Scholar]
- DeLisi LE, Hoff AL, Kushner M, Degreef G. Increased prevalence of cavum septum pellucidum in Schizophrenia. Psychiatry Res: Neuroimaging. 1993;50:193–199. doi: 10.1016/0925-4927(93)90030-l. [DOI] [PubMed] [Google Scholar]
- DeLisi LE, Hoff AL, Neale C, Kushner M. Asymmetries in the superior temporal lobe in male and female first–episode schizophrenic patients: Measures of the planum temporale and superior temporal gyrus by MRI. Schizophr Res. 1994;12:19–28. doi: 10.1016/0920-9964(94)90080-9. [DOI] [PubMed] [Google Scholar]
- DeLisi LE, Tew W, Xhie S, Hoff AL, Sakuma M, Kushner M, et al. A prospective follow–up study of brain morphology and cognition in first–episode schizophrenic patients: Preliminary findings. Biol Psychiatry. 1995;38:349–360. doi: 10.1016/0006-3223(94)00376-e. [DOI] [PubMed] [Google Scholar]
- DeLisi LE, Sakuma M, Tew W, Kushner M, Hoff AL, Grimson R. Schizophrenia as a chronic active brain process: A study of progressive brain structural change subsequent to the onset of Schizophrenia. Psychiatry Res. 1997;74:129–140. doi: 10.1016/s0925-4927(97)00012-7. [DOI] [PubMed] [Google Scholar]
- DeQuardo JR, Bookstein FL, Green WD, Brunberg JA, Tandon R. Spatial relationships of neuroanatomic landmarks in Schizophrenia. Psychiatry Res. 1996;67:81–95. [PubMed] [Google Scholar]
- Di Michele V, Rossi A, Stratta P, Schiazza G, Bolino F, Giordano L, et al. Neuropsychological and clinical correlates of temporal lobe anatomy in Schizophrenia. ACTA Psychiatr Scand. 1992;85:484–488. doi: 10.1111/j.1600-0447.1992.tb03216.x. [DOI] [PubMed] [Google Scholar]
- Egan MF, Duncan CC, Suddath RL, Kirch DG, Mirsky AF, Wyatt RJ. Event–related potential abnormalities correlate with structural brain alterations and clinical features in patients with chronic Schizophrenia. Schizophr Res. 1994;11:259–271. doi: 10.1016/0920-9964(94)90020-5. [DOI] [PubMed] [Google Scholar]
- Elkashef AM, Buchanan RW, Gellad F, Munson RC, Breier A. Basal ganglia pathology in Schizophrenia and tardive dyskinesia: An MRI quantitative study. Am J Psychiatry. 1994;151:752–755. doi: 10.1176/ajp.151.5.752. [DOI] [PubMed] [Google Scholar]
- Elkis H, Friedman L, Wise A, Meltzer HY. Meta–analyses of studies of ventricular enlargement and cortical sulcal prominence in mood disorders: Comparisons with controls or patients with schizophrenia. Arch Gen Psychiatry. 1995;52:735–746. doi: 10.1001/archpsyc.1995.03950210029008. [DOI] [PubMed] [Google Scholar]
- Flaum M, O’Leary DS, Swayze VW, II, Miller DD, Arndt S, Andreasen NC. Symptom dimensions and brain morphology in Schizophrenia and related psychotic disorders. J Psychiatric Res. 1995a;29:261–276. doi: 10.1016/0022-3956(94)00046-t. [DOI] [PubMed] [Google Scholar]
- Flaum M, Swayze VW, II, O’Leary DS, Yuh WTC, Ehrhardt JC, Arndt SV, et al. Effects of diagnosis and gender on brain morphology in Schizophrenia. Am J Psychiatry. 1995b;152:704–714. doi: 10.1176/ajp.152.5.704. [DOI] [PubMed] [Google Scholar]
- Freedman R, Adler LE, Bickford P, Byerley W, Coon H, Cullum CM, et al. Schizophrenia and nicotinic receptors. Harvard Rev Psychiatry. 1994;2:179–192. doi: 10.3109/10673229409017136. [DOI] [PubMed] [Google Scholar]
- Freedman R, Coon H, Myles–Worsley M, Orr–Urtreger A, Olincy A, Davis A, et al. Linkage of a neurophysiological deficit in Schizophrenia to a chromosome 15 locus. Proc Natl Acad Sci USA. 1997;94:587–592. doi: 10.1073/pnas.94.2.587. [DOI] [PMC free article] [PubMed] [Google Scholar]
- Fukuzako T, Fukuzako H, Kodama S, Hashiguchi T, Takigawa M. Cavum septum pellucidum in schizophrenia: A magnetic resonance imaging study. Psychiatry Clin Neuro. 1996a;50:125–128. doi: 10.1111/j.1440-1819.1996.tb01675.x. [DOI] [PubMed] [Google Scholar]
- Fukuzako H, Fukuzako T, Hashiguchi T, Hokazono Y, Takeuchi K, Hirakawa K, et al. Reduction in hippocampal formation volume is caused mainly by its shortening in chronic schizophrenia: Assessment by MRI. Biol Psychiatry. 1996b;39:938–945. doi: 10.1016/0006-3223(95)00251-0. [DOI] [PubMed] [Google Scholar]
- Garver DL. The etiologic heterogeneity of Schizophrenia. Harv Rev Psychiatry. 1997;4:317–327. doi: 10.3109/10673229709030559. [DOI] [PubMed] [Google Scholar]
- Gerig G, Kikinis R, Kubler O. Technical report BIWI–TR–124. Zurich, Switzerland: Communication Technology Laboratory, Image Science Division; 1990. Significant improvement of MR image data quality using anisotrophic diffusion filtering. [Google Scholar]
- Gerig G, Martin J, Kikinis R, Kubler O, Shenton ME, Jolesz FA. Automated segmentation of 3D dual–echo MR head data. Image and Vision Computing. 1992;10:349–360. [Google Scholar]
- Glass GV, McGaw B, Smith ML. Meta–Analysis in Social Research. Newbury Park, CA: Sage Publications; 1981. [Google Scholar]
- Goldberg TE, Torrey EF, Berman DF, Weinberger DR. Relations between neuropsychological performance and brain morphological and physiological measures in monozygotic twins discordant for Schizophrenia. Psychiatry Res. 1994;55:51–61. doi: 10.1016/0925-4927(94)90011-6. [DOI] [PubMed] [Google Scholar]
- Goldman–Rakic PS, Selemon LD. New frontiers in basal ganglia research. Trends in Neuroscience. 1990;13:241–244. doi: 10.1016/0166-2236(90)90103-h. [DOI] [PubMed] [Google Scholar]
- Grunze HCR, Rainnie DG, Hasselmo ME, Barkai E, Hearn EF, McCarley RW, et al. NMDA–dependent modulation of CA1 local circuit inhibition. J Neuroscience. 1996;16:2034–2043. doi: 10.1523/JNEUROSCI.16-06-02034.1996. [DOI] [PMC free article] [PubMed] [Google Scholar]
- Gunther W, Petsch R, Steinberg R, Moser E, Streck P, Heller H, et al. Brain dysfunction during motor activation and corpus callosum alterations in Schizophrenia measured by cerebral blood flow and magnetic resonance imaging. Biol Psychiatry. 1991;29:535–555. doi: 10.1016/0006-3223(91)90090-9. [DOI] [PubMed] [Google Scholar]
- Gur RE, Mozley PD, Shtasel DL, Cannon TD, Gallacher F, Turetsky B, et al. Clinical subtypes of Schizophrenia: Differences in brain and CSF volume. Am J Psychiatry. 1994;151:343–350. doi: 10.1176/ajp.151.3.343. [DOI] [PubMed] [Google Scholar]
- Gur RE, Cowell P, Turetsky BI, Gallacher F, Cannon T, Bilker W, et al. A follow–up magnetic resonance imaging study of Schizophrenia: Relationship of neuroanatomical changes to clinical and neurobehavioral measures. Arch Gen Psychiatry. 1998;55:145–152. doi: 10.1001/archpsyc.55.2.145. [DOI] [PubMed] [Google Scholar]
- Hajek M, Huonker R, Boehle C, Volz HP, Nowak H, Sauer H. Abnormalities of auditory evoked magnetic fields and structural changes in the left hemisphere of male schizophrenics - a magnetoencephalographic–magnetic resonance imaging study. Biol Psychiatry. 1997;42:609–616. doi: 10.1016/s0006-3223(96)00428-3. [DOI] [PubMed] [Google Scholar]
- Harvey J, Ron MA, Boulay GD, Wicks D, Lewis SW, Murray RM. Reduction of cortical volume in Schizophrenia on magnetic resonance imaging. Psych Med. 1993;23:591–604. doi: 10.1017/s003329170002537x. [DOI] [PubMed] [Google Scholar]
- Hauser PI, Dauphinais D, Berrettini W, DeLisi LE, Gelernter J, Post RM. Corpus callosum dimensions measured by magnetic resonance imaging in bipolar affective disorder and Schizophrenia. Biol Psychiatry. 1989;26:659–668. doi: 10.1016/0006-3223(89)90100-5. [DOI] [PubMed] [Google Scholar]
- Hirayasu Y, Shenton ME, Salisbury DF, Dickey CD, Fischer IA, Mazzoni P, et al. Lower left temporal lobe MRI volumes in patients with first–episode Schizophrenia comapred with psychotic patients with first–episode affective disorder and normal subjects. Am J Psychiatry. 1998a;155:1384–1391. doi: 10.1176/ajp.155.10.1384. [DOI] [PubMed] [Google Scholar]
- Hirayasu Y, Shenton ME, Salisbury DF, Fischer IA, Kisler T, Kwon JS, et al. Superior temporal gyrus changes over time in first episode Schizophrenia. Biol Psychiatry(abstracts) 1998b;43:116S. [Google Scholar]
- Hoff AL, Riordan H, O’Donnell D, Stritzke P, Neale C, Boccio A, et al. Anomalous lateral sulcus and cognitive function in first–episode Schizophrenia. Schizophr Bull. 1992;18:257–272. doi: 10.1093/schbul/18.2.257. [DOI] [PubMed] [Google Scholar]
- Hoff AL, Neal C, Kushner M, DeLisi LE. Gender differences in corpus callosum size in first–episode schizophrenics. Biol Psychiatry. 1994;35:913–919. doi: 10.1016/0006-3223(94)91237-8. [DOI] [PubMed] [Google Scholar]
- Hokama H, Shenton ME, Nestor PG, Kikinis R, Levitt JL, Metcalf D, et al. Caudate, putamen, and globus pallidus volume in schizophrenia: A quantitative MRI study. Psychiatry Res: Neuroimaging. 1995;61:209–229. doi: 10.1016/0925-4927(95)02729-h. [DOI] [PubMed] [Google Scholar]
- Hunter JE, Schmidt FL. Methods of Meta–Analysis. Sage Publications; Newbury Park, California: 1990. [Google Scholar]
- Iosifescu DV, Shenton ME, Warfield SK, Kikinis R, Dengler J, McCarley RW. An automated registration algorithm for measuring MRI subcortical brain structures. Neuroimage. 1997;6:13–25. doi: 10.1006/nimg.1997.0274. [DOI] [PubMed] [Google Scholar]
- Jakob H, Beckmann H. Prenatal developmental disturbances in the limbic allocortex in schizophrenics. J Neural Transmission. 1986;65:303–326. doi: 10.1007/BF01249090. [DOI] [PubMed] [Google Scholar]
- Jernigan TL, Zisook S, Heaton RK, Moranville JT, Hesselink JR, Braff DL. Magnetic resonance imaging abnormalities in lenticular nuclei and cerebral cortex in Schizophrenia. Arch Gen Psychiatry. 1991;48:881–890. doi: 10.1001/archpsyc.1991.01810340013002. [DOI] [PubMed] [Google Scholar]
- Johnstone EC, Owens DGC, Crow TJ, Frith CD, Alexandropolis K, Bydder G, et al. Temporal lobe structure as determined by nuclear magnetic resonance in Schizophrenia and bipolar affective disorder. J Neurol Neurosurg and Psychiatry. 1989;52:736–741. doi: 10.1136/jnnp.52.6.736. [DOI] [PMC free article] [PubMed] [Google Scholar]
- Jurjus GJ, Nasrallah HA, Olson SC, Schwarzkopf SB. Cavum septum pellucidum in Schizophrenia, affective disorder, and healthy controls: A magnetic resonance imaging study. Psych Med. 1993;23:319–322. doi: 10.1017/s0033291700028403. [DOI] [PubMed] [Google Scholar]
- Kawasaki Y, Maeda Y, Urata K, Higashima M, Yamaguchi N, Suzuki M, et al. A quantitative magnetic resonance imaging study of patients with Schizophrenia. Euro Arch Psych Clin Neuroscience. 1993;242:268–272. doi: 10.1007/BF02190385. [DOI] [PubMed] [Google Scholar]
- Kelsoe JR, Cadet JL, Pickar D, Weinberger DR. Quantitative neuroanatomy in Schizophrenia: A controlled magnetic resonance imaging study. Arch Gen Psychiatry. 1988;45:533–541. doi: 10.1001/archpsyc.1988.01800300029003. [DOI] [PubMed] [Google Scholar]
- Keshavan MS, Bagwell WW, Haas GL, Sweeney JA, Schooler NR, Pettegrew JW. Does caudate volume increase during follow up in first–episode psychosis? Schizophr Res. 1995;15:87. [Google Scholar]
- Kikinis R, Jolesz FA, Gerig G, Sandor T, Cline H, Lorensen W, et al. 3D morphometric and morphometric information derived from clinical brain MR images. In: Hohne KH, editor. NATO ASI Series Vol. F60: Imaging in Medicine. Berlin, Heidelberg: Spinger–Verlag; 1990. pp. 121–132. [Google Scholar]
- Kikinis R, Shenton ME, Jolesz FA, Gerig G, Martin J, Anderson M, et al. Routine analysis of brain and cerebrospinal fluid spaces with MR imaging. J Magn Reson Imaging. 1992;2:619–629. doi: 10.1002/jmri.1880020603. [DOI] [PubMed] [Google Scholar]
- Kikinis R, Shenton ME, Gerig G, Hokama H, Haimson J, O’Donnell BF, et al. Temporal lobe sulco–gyral pattern anomalies in Schizophrenia: An in vivo MR three–dimensional surface rendering study. Neuroscience Lett. 1994;182:7–12. doi: 10.1016/0304-3940(94)90192-9. [DOI] [PubMed] [Google Scholar]
- Kleinschmidt P, Falkai P, Huang Y, Schneider T, Furst G, Steinmetz H. In vivo morphometry of planum temporale asymmetry in first–episode Schizophrenia. Schizophr Res. 1994;12:9–18. doi: 10.1016/0920-9964(94)90079-5. [DOI] [PubMed] [Google Scholar]
- Kraepelin E. In: Dementia Praecox. Barclay E, Barclay S, translators. New York: Churchill Livingstone Inc; 19191971. [Google Scholar]
- Kulynych JJ, Vladar K, Fantie BD, Jones DW, Weinberger DR. Normal asymmetry of the planum temporale in patients with Schizophrenia: Three–dimensional cortical morphometry with MRI. Br J Psychiatry. 1995;166:742–749. doi: 10.1192/bjp.166.6.742. [DOI] [PubMed] [Google Scholar]
- Kulynych JJ, Vladar K, Jones DW, Weinberger DR. Superior temporal gyrus volume in Schizophrenia: A study using MRI morphometry assisted by surface rendering. Am J Psychiatry. 1996;153:50–56. doi: 10.1176/ajp.153.9.A50. [DOI] [PubMed] [Google Scholar]
- Kwon JS, Shenton ME, Hirayasu Y, Salisbury DF, Fischer IA, Dickey CC, et al. MRI study of cavum septi pellucidi in Schizophrenia, affective disorder, and schizotypal personality disorder. Am J Psychiatry. 1998a;155:509–515. doi: 10.1176/ajp.155.4.509. [DOI] [PMC free article] [PubMed] [Google Scholar]
- Kwon JS, McCarley RW, Hirayasu Y, Anderson JE, Fischer IA, Kikinis R, et al. Left planum temporale volume reduction in Schizophrenia. Arch Gen Psychiatry. 1999;56:142–148. doi: 10.1001/archpsyc.56.2.142. [DOI] [PubMed] [Google Scholar]
- Lahti AC, Holcomb HH, Medoff DR, Tamminga CA. Ketamine activates psychosis and alters limbic blood flow in Schizophrenia. Neuroreport. 1995;6:869–872. doi: 10.1097/00001756-199504190-00011. [DOI] [PubMed] [Google Scholar]
- Lauriello J, Hoff A, Wieneke MH, Blankfeld H, Faustman WO, Rosenbloom M, et al. Similar extent of brain dysmorphology in severely ill women and men with Schizophrenia. Am J Psychiatry. 1997;154:819–825. doi: 10.1176/ajp.154.6.819. [DOI] [PubMed] [Google Scholar]
- Lewine RR, Gulleu LR, Risch SC, Jewart R, Houpt JL. Sexual dimorphism, brain morphology, and Schizophrenia. Schizophr Bull. 1990;16:195–203. doi: 10.1093/schbul/16.2.195. [DOI] [PubMed] [Google Scholar]
- Lim KO, Tew W, Kushner M, Chow K, Matsumoto B, DeLisi LE. Cortical gray matter volume deficit in patients with first–episode Schizophrenia. Am J Psychiatry. 1996;153:1548–1553. doi: 10.1176/ajp.153.12.1548. [DOI] [PubMed] [Google Scholar]
- Marsh L, Suddath RL, Higgins N, Weinberger DR. Medial temporal lobe structures in Schizophrenia: Relationship of size to duration of illness. Schizophr Res. 1994;11:225–238. doi: 10.1016/0920-9964(94)90016-7. [DOI] [PubMed] [Google Scholar]
- Marsh L, Harris D, Lim KO, Beal M, Hoff AL, Minn K, et al. Structural magnetic resonance imaging abnormalities in men with severe chronic Schizophrenia and an early age at clinical onset. Arch Gen Psychiatry. 1997;54:1104–1112. doi: 10.1001/archpsyc.1997.01830240060009. [DOI] [PubMed] [Google Scholar]
- McCarley RW, Shenton ME, O’Donnell BF, Faux SF, Kikinis R, Nestor PG, et al. Auditory P300 abnormalities and left posterior superior temporal gyrus volume reduction in Schizophrenia. Arch Gen Psychiatry. 1993;50:190–197. doi: 10.1001/archpsyc.1993.01820150036003. [DOI] [PubMed] [Google Scholar]
- McCarley RW, Hsiao J, Freedman R, Pfefferbaum A, Donchin E. Neuroimaging and the cognitive neuroscience of Schizophrenia. Schizophr Bull. 1996;22:703–726. doi: 10.1093/schbul/22.4.703. [DOI] [PubMed] [Google Scholar]
- McEwen BS, Magarinos AM. Stress effects on morphology and function of the hippocampus. Ann NY Acad Sci. 1997;821:271–284. doi: 10.1111/j.1749-6632.1997.tb48286.x. [DOI] [PubMed] [Google Scholar]
- Menon RR, Barta PE, Aylward EH, Richards SS, Vaughn DD, Tien AY, et al. Posterior superior temporal gyrus in Schizophrenia: Grey matter changes and clinical correlates. Schizophr Res. 1995;16:127–135. doi: 10.1016/0920-9964(94)00067-i. [DOI] [PubMed] [Google Scholar]
- Mion CC, Andreasen NC, Arndt S, Swayze VW, Cohen GA. MRI abnormalities in tardive dyskinesia. Psychiatry Res: Neuroimaging. 1991;40:157–166. doi: 10.1016/0925-4927(91)90007-d. [DOI] [PubMed] [Google Scholar]
- Nasrallah HA, Schwarzkopf SB, Olson SC, Coffman JA. Gender differences in Schizophrenia on MRI brain scans. Schizophr Bull. 1990;16:205–210. doi: 10.1093/schbul/16.2.205. [DOI] [PubMed] [Google Scholar]
- Nasrallah HA, Schwarzkopf SB, Olson SC, Coffman JA. Perinatal brain injury and cerebral vermal lobules I–X in Schizophrenia. Biol Psychiatry. 1991;29:567–574. doi: 10.1016/0006-3223(91)90092-z. [DOI] [PubMed] [Google Scholar]
- Nestor PG, Shenton ME, McCarley RW, Haimson J, Smith RS, O’Donnell BF. Neuropsychological correlates of MRI temporal lobe abnormalities in Schizophrenia. Am J Psychiatry. 1993;150:1849–1855. doi: 10.1176/ajp.150.12.1849. [DOI] [PubMed] [Google Scholar]
- Nopoulos P, Torres I, Flaum M, Andreasen NC, Ehrhardt JC, Yuh WTC. Brain morphology in first–episode Schizophrenia. Am J Psychiatry. 1995;152:1721–1723. doi: 10.1176/ajp.152.12.1721. [DOI] [PubMed] [Google Scholar]
- Nopoulos P, Swayze V, Andreasen NC. Pattern of brain morphology in patients with Schizophrenia and large cavum septi pellucidi. J Neuropsychiatry Clin Neurosciences. 1996;8:147–152. doi: 10.1176/jnp.8.2.147. [DOI] [PubMed] [Google Scholar]
- Nopoulos P, Swayze V, Flaum M, Ehrhardt JC, Yuh WT, Andreasen NC. Cavum septi pellucidi in normals and patients with Schizophrenia as detected by magnetic resonance imaging. Biol Psychiatry. 1997;41:1102–1108. doi: 10.1016/S0006-3223(96)00209-0. [DOI] [PubMed] [Google Scholar]
- O’Donnell BF, Shenton ME, McCarley RW, Faux SF, Smith RS, Salisbury DF, et al. The auditory N2 component in Schizophrenia: Relationship to MRI temporal lobe gray matter and to other ERP abnormalities. Biol Psychiatry. 1993;34:26–40. doi: 10.1016/0006-3223(93)90253-a. [DOI] [PubMed] [Google Scholar]
- O’Donnell BF, Faux SF, McCarley RW, Kimble MO, Salisbury DF, Nestor PG, et al. Increased rate of P300 latency prolongation with age in Schizophrenia. Arch Gen Psychiatry. 1995;52:544–549. doi: 10.1001/archpsyc.1995.03950190026004. [DOI] [PubMed] [Google Scholar]
- Ohnuma T, Kimura N, Takahashi T, Iwamoto N, Arai H. A magnetic resonance imaging study in first episode disorganized–type patients with Schizophrenia. Psychiatry and Clin Neurosciences. 1997;51:9–15. doi: 10.1111/j.1440-1819.1997.tb02359.x. [DOI] [PubMed] [Google Scholar]
- Olney JW, Farber NB. Glutamate receptor dysfunction and Schizophrenia. Arch Gen Psychiatry. 1995;52:998–1007. doi: 10.1001/archpsyc.1995.03950240016004. [DOI] [PubMed] [Google Scholar]
- Orr–Urtreger A, Goldner FM, Saeki M, Lorenzo I, Goldberg L, De Biasi M, et al. Mice deficient in the 7 neuronal nicotinic acetylcholine receptor lack bungarotoxin binding sites and hippocampal fast nicotinic currents. J Neuroscience. 1997;17:9165–9171. doi: 10.1523/JNEUROSCI.17-23-09165.1997. [DOI] [PMC free article] [PubMed] [Google Scholar]
- Pakkenberg B. Post–mortem study of chronic schizophrenic brains. Br J Psychiatry. 1987;151:744–752. doi: 10.1192/bjp.151.6.744. [DOI] [PubMed] [Google Scholar]
- Paradiso S, Andreasen NC, O’Leary DS, Arndt S, Robinson RG. Cerebellar size and cognition: Correlations with IQ, verbal memory and motor dexterity. Neuropsychiatry Neuropsychol Behav Neurol. 1997;10:1–8. [PubMed] [Google Scholar]
- Pearlson GD. Superior temporal gyrus and planum temporale in Schizophrenia: A selective review. Prog Neuropsychopharm Biol Psychiatry. 1997;21:1203–1229. doi: 10.1016/s0278-5846(97)00159-0. [DOI] [PubMed] [Google Scholar]
- Petitti DB. Meta-Analysis, Decision Analysis, and Cost–Effectiveness Analysis. New York: Oxford University Press; 1994. [Google Scholar]
- Petty RG, Barta PE, Pearlson GD, McGilchrist IK, Lewis RW, Tien Y, et al. Reversal of asymmetry of the planum temporale in Schizophrenia. Am J Psychiatry. 1995;152:715–721. doi: 10.1176/ajp.152.5.715. [DOI] [PubMed] [Google Scholar]
- Portas CM, Goldstein JM, Shenton ME, Hokama HH, Wible CG, Fischer IA, et al. Volumetric evaluation of the thalamus in schizophrenic male patients using magnetic resonance imaging. Biol Psychiatry. 1998;43:649–659. doi: 10.1016/s0006-3223(97)00339-9. [DOI] [PubMed] [Google Scholar]
- Posner MI, Early TS, Reiman E, Pardo P, Dhaawan M. Asymmetries in hemispheric control of attention in Schizophrenia. Arch Gen Psychiatry. 1988;45:814–821. doi: 10.1001/archpsyc.1988.01800330038004. [DOI] [PubMed] [Google Scholar]
- Raine A, Harrison GN, Reynolds GP, Sheard C, Cooper JE, Medley I. Structural and functional characteristics of the corpus callosum in schizophrenics. Arch Gen Psychiatry. 1990;47:1060–1064. doi: 10.1001/archpsyc.1990.01810230076012. [DOI] [PubMed] [Google Scholar]
- Raine A, Lencz T, Reynolds GP, Harrison G, Sheard C, Medley I, et al. An evaluation of structural and functional prefrontal deficits in Schizophrenia: MRI and neuropsychological measures. Psychiatry Res: Neuroimaging. 1992;45:123–137. doi: 10.1016/0925-4927(92)90006-p. [DOI] [PubMed] [Google Scholar]
- Reite M, Sheeder J, Teale P, Adams M, Richardon D, Simon J, et al. Magnetic source imaging evidence of sex differences in cerebral lateralization in Schizophrenia. Arch Gen Psychiatry. 1997;54:433–440. doi: 10.1001/archpsyc.1997.01830170059009. [DOI] [PubMed] [Google Scholar]
- Rosenthal R. Judgement Studies. Design, Analysis and Meta–Analysis. Cambridge, UK: Cambridge University Press; 1987. [Google Scholar]
- Rossi A, Stratta P, Gallucci M, Amicarelli I, Passariello R, Casacchia M. Standardized magnetic resonance image intensity study in Schizophrenia. Psychiatry Res. 1988;25:223–231. doi: 10.1016/0165-1781(88)90054-6. [DOI] [PubMed] [Google Scholar]
- Rossi A, Stratta P, Galluci M, Passariello R, Casacchia M. Quantification of corpus callosum and ventricles in schizophrenics with nuclear magnetic resonance imaging: A pilot study. Am J Psychiatry. 1989a;46:99–101. doi: 10.1176/ajp.146.1.99. [DOI] [PubMed] [Google Scholar]
- Rossi A, Stratta P, D’Albenzio L, Tartaro A, Schiazza G, Di Michele V, et al. Reduced temporal lobe area in Schizophrenia by magnetic resonance imaging: Preliminary evidence. Psychiatry Res. 1989b;29:261–263. doi: 10.1016/0165-1781(89)90056-5. [DOI] [PubMed] [Google Scholar]
- Rossi A, Stratta P, D’Albenzio L, Tartaro A, Schiazza G, DiMichele V, et al. Reduced temporal lobe areas in Schizophrenia: Preliminary evidences from a controlled multiplanar magnetic resonance imaging study. Biol Psychiatry. 1990b;27:61–68. doi: 10.1016/0006-3223(90)90020-3. [DOI] [PubMed] [Google Scholar]
- Rossi A, Stratta A, Michele VD, Gallucci M, Splendiani A, DeCataldo S, et al. Temporal lobe structure by magnetic resonance in bipolar affective disorders and Schizophrenia. J Affective Dis. 1991;21:19–22. doi: 10.1016/0165-0327(91)90014-j. [DOI] [PubMed] [Google Scholar]
- Rossi A, Stratta P, Mattei P, Cupillari M, Bozzao A, Gallucci M, et al. Planum temporale in Schizophrenia: A magnetic resonance study. Schizophr Res. 1992;7:19–22. doi: 10.1016/0920-9964(92)90069-h. [DOI] [PubMed] [Google Scholar]
- Rossi A, Stratta P, Mancini F, Cataldo SD, Casacchia M. Cerebellar vermal size in schizophrenia: A male effect. Biol Psychiatry. 1993;33:354–357. doi: 10.1016/0006-3223(93)90324-7. [DOI] [PubMed] [Google Scholar]
- Rossi A, Serio A, Stratta P, Petruzzi C, Schiazza G, Mancini F, et al. Planum temporale asymmetry and thought disorder in Schizophrenia. Schizophr Res. 1994a;12:1–7. doi: 10.1016/0920-9964(94)90078-7. [DOI] [PubMed] [Google Scholar]
- Rossi A, Stratta P, Mancini F, Gallucci M, Mattei P, Core L, et al. Magnetic resonance imaging findings of amygdala–anterior hippocampus shrinkage in male patients with Schizophrenia. Psychiatry Res. 1994b;52:43–53. doi: 10.1016/0165-1781(94)90119-8. [DOI] [PubMed] [Google Scholar]
- Schlaepfer TE, Harris GJ, Tien AY, Peng LW, Lee S, Federman EB, et al. Decreased regional cortical gray matter volume in Schizophrenia. Am J Psychiatry. 1994;151:842–848. doi: 10.1176/ajp.151.6.842. [DOI] [PubMed] [Google Scholar]
- Schwartz JM, Aylward E, Barta PE, Tune LE, Pearlson GD. Sylvian fissure size in Schizophrenia measured with the magnetic resonance imaging rating protocol of the consortium to establish a registry for Alzheimer’s disease. Am J Psychiatry. 1992;149:1195–1198. doi: 10.1176/ajp.149.9.1195. [DOI] [PubMed] [Google Scholar]
- Schwarzkopf SB, Olson SC, Coffman JA, Nasrallah HA. Third and lateral ventricular volumes in Schizophrenia: Support for progressive enlargement of both structures. Psychopharm Bull. 1990;26:385–391. [PubMed] [Google Scholar]
- Scott TF, Price TP, George MS, Brillman J, Rothfus W. Cerebral malformations and Schizophrenia. J Neuropsychiatry Clin Neurosci. 1993;5:287. doi: 10.1176/jnp.5.3.287. [DOI] [PubMed] [Google Scholar]
- Selemon LD, Rajkowska G, Goldman–Rakic PS. Elevated neuronal density in prefrontal area 46 in brains from schizophrenic patients: Application of a three–dimensional stereologic counting method. J Comp Neurol. 1998;392:402–412. [PubMed] [Google Scholar]
- Shenton ME, Kikinis R, McCarley RW, Metcalf D, Tieman J, Jolesz FA. Application of automated MRI volumetric measurement techniques to the ventricular system in schizophrenics and normal controls. Schizophr Res. 1991;5:103–113. doi: 10.1016/0920-9964(91)90037-r. [DOI] [PubMed] [Google Scholar]
- Shenton ME, Kikinis R, Jolesz FA, Pollak SD, LeMay M, Wible CG, et al. Abnormalities of the left temporal lobe and thought disorder in Schizophrenia: A quantitative magnetic resonance imaging study. N Eng J Med. 1992;327:604–612. doi: 10.1056/NEJM199208273270905. [DOI] [PubMed] [Google Scholar]
- Shenton ME, Wible CG, McCarley RW. A review of magnetic resonance imaging studies of brain abnormalities in schizophrenia. In: Krishnan KRR, Doraiswamy PM, editors. Brain Imaging in Clinical Psychiatry. New York: Marcel Dekker, Inc; 1997. [Google Scholar]
- Shioiri T, Oshitani Y, Kato T, Murashita J, Hamakawa H, Inubushi T, et al. Prevalence of cavum septum pellucidum detected by MRI in patients with bipolar disorder, major depression and Schizophrenia. Psych Med. 1996;26:431–434. doi: 10.1017/s0033291700034838. [DOI] [PubMed] [Google Scholar]
- Silbersweig DA, Stern E, Frith C, Cahill C, Holmes A, Grootoonk S, et al. A functional neuroanatomy of hallucinations in Schizophrenia. Nature. 1995;378:176–179. doi: 10.1038/378176a0. [DOI] [PubMed] [Google Scholar]
- Smith RC, Calderon M, Ravichandran GK, Largen J, Vroulis G, Shvartsburd A, et al. Nuclear magnetic resonance in Schizophrenia: A preliminary study. Psychiatry Res. 1984;12:137–147. doi: 10.1016/0165-1781(84)90013-1. [DOI] [PubMed] [Google Scholar]
- Soares JC, Mann JJ. The anatomy of mood disorders: Review of structural neuroimaging studies. Biol Psychiatry. 1997;41:86–106. doi: 10.1016/s0006-3223(96)00006-6. [DOI] [PubMed] [Google Scholar]
- Steffens DC, Krishnan KRR. Structural neuroimaging and mood disorders: Recent findings, implications for classification, and future directions. Biol Psychiatry. 1998;43:705–712. doi: 10.1016/s0006-3223(98)00084-5. [DOI] [PubMed] [Google Scholar]
- Stratta P, Rossi A, Gallucci M, Amicarelli I, Passariello R, Casacchia M. Hemispheric asymmetries and Schizophrenia: A preliminary magnetic resonance imaging study. Biol Psychiatry. 1989;25:275–284. doi: 10.1016/0006-3223(89)90175-3. [DOI] [PubMed] [Google Scholar]
- Suddath RL, Casanova MF, Goldberg TE, Daniel DG, Kelsoe JR, Weinberger DR. Temporal lobe pathology in Schizophrenia: A quantitative magnetic resonance imaging study. Am J Psychiatry. 1989;146:464–472. doi: 10.1176/ajp.146.4.464. [DOI] [PubMed] [Google Scholar]
- Suddath RL, Christison GW, Torrey EF, Casanova MF, Weinberger DR. Anatomical abnormalities in the brains of monozygotic twins discordant for Schizophrenia. N Engl J Med. 1990;332:789–794. doi: 10.1056/NEJM199003223221201. [DOI] [PubMed] [Google Scholar]
- Sullivan EV, Mathalon DH, Lim KO, Marsh L, Pfefferbaum A. Patterns of regional cortical dysmorphology distinguishing Schizophrenia and chronic alcoholism. Biol Psychiatry. 1998;43:118–131. doi: 10.1016/S0006-3223(97)00264-3. [DOI] [PubMed] [Google Scholar]
- Swayze VW, II, Andreasen NC, Alliger RJ, Yuh WTC, Ehrhardt JC. Subcortical and temporal structures in affective disorder and Schizophrenia: A magnetic resonance imaging study. Biol Psychiatry. 1992;31:221–240. doi: 10.1016/0006-3223(92)90046-3. [DOI] [PubMed] [Google Scholar]
- Swerdlow NR, Koob GF. Dopamine, Schizophrenia, mania, and depression: Toward a unified hypothesis of cortico–striatal–pallido–thalamic function. Beh Brain Sci. 1987;10:197–245. [Google Scholar]
- Tsai GC, Coyle JT. N–acetylaspartate in neuropsychiatric disorders. Prog Neurobiol. 1995;46:531–540. doi: 10.1016/0301-0082(95)00014-m. [DOI] [PubMed] [Google Scholar]
- Tune L, Barta P, Wong D, Powers RE, Pearlson G, Tien AY, et al. Striatal dopamine D2 receptor quantification and superior temporal gyrus: Volume determination in 14 chronic schizophrenic subjects. Psychiatry Res. 1996;67:155–158. doi: 10.1016/0925-4927(96)02728-x. [DOI] [PubMed] [Google Scholar]
- Uematsu M, Kaiya H. The morphology of the corpus callosum in schizophrenia: An MRI study. Schizophr Res. 1988;1:391–398. doi: 10.1016/0920-9964(88)90020-5. [DOI] [PubMed] [Google Scholar]
- Uematsu M, Kaiya H. Midsagittal cortical pathomorphology of Schizophrenia: A magnetic resonance imaging study. Psychiatry Res. 1989;30:11–20. doi: 10.1016/0165-1781(89)90167-4. [DOI] [PubMed] [Google Scholar]
- Vita A, Dieci M, Giobbio GM, Caputo A, Ghiringhelli L, Comazzi M, et al. Language and thought disorder in Schizophrenia: Brain morphological correlates. Schizophr Res. 1995;15:243–251. doi: 10.1016/0920-9964(94)00050-i. [DOI] [PubMed] [Google Scholar]
- Wible CG, Shenton ME, Hokama H, Kikinis R, Jolesz FA, Metcalf D, et al. Prefrontal cortex and Schizophrenia: A quantitative magnetic resonance imaging study. Arch Gen Psychiatry. 1995;52:279–288. doi: 10.1001/archpsyc.1995.03950160029007. [DOI] [PubMed] [Google Scholar]
- Wible CG, Shenton ME, Fischer IA, Allard JE, Kikinis R, Jolesz FA, et al. Parcellation of the human prefrontal cortex using MRI. Psychiatry Res: Neuroimaging. 1997;1:29–40. doi: 10.1016/s0925-4927(97)00060-7. [DOI] [PubMed] [Google Scholar]
- Woodruff PW, Pearlson GD, Geer MJ, Barta PE, Calcite HD. A computerized magnetic resonance imaging study of corpus callosum morphology in Schizophrenia. Psych Med. 1993;23:45–56. doi: 10.1017/s0033291700038836. [DOI] [PubMed] [Google Scholar]
- Woodruff PW, Wright IC, Shuriquie N, Russouw H, Rushe T, Howard RJ, et al. Structural brain abnormalities in male schizophrenics reflect fronto–temporal dissociation. Psych Med. 1997a;27:1257–1266. doi: 10.1017/s0033291797005229. [DOI] [PubMed] [Google Scholar]
- Woodruff PW, Philips ML, Rushe T, Wright IC, Murray RM, David AS. Corpus callosum size and inter–hemispheric function in Schizophrenia. Schizophr Res. 1997b;23:189–196. doi: 10.1016/s0920-9964(96)00103-x. [DOI] [PubMed] [Google Scholar]
- Woods BT, Yurgelun–Todd D, Goldstein JM, Seidman LJ, Tsuang M. MRI brain abnormalities in chronic Schizophrenia: One process or more? Biol Psychiatry. 1996;40:585–596. doi: 10.1016/0006-3223(95)00478-5. [DOI] [PubMed] [Google Scholar]
- Young AH, Blackwood DHR, Roxborough H, McQueen JK, Martin MJ, Kean D. A magnetic resonance imaging study of Schizophrenia: Brain structure and clinical symptoms. Br J Psychiatry. 1991;158:158–164. doi: 10.1192/bjp.158.2.158. [DOI] [PubMed] [Google Scholar]
- Zipursky RB, Lim DO, Sullivan EV, Brown BW, Pfefferbaum A. Widespread cerebral gray matter volume deficits in Schizophrenia. Arch Gen Psychiatry. 1992;49:195–205. doi: 10.1001/archpsyc.1992.01820030027004. [DOI] [PubMed] [Google Scholar]
- Zipursky RB, Marsh L, Lim KO, DeMent S, Shear PK, Sullivan EV, et al. Volumetric MRI assessment of temporal lobe structures in Schizophrenia. Biol Psychiatry. 1994;35:501–516. doi: 10.1016/0006-3223(94)90097-3. [DOI] [PubMed] [Google Scholar]
- Zipursky RB, Seeman MV, Bury A, Langevin R, Wortzman G, Katz R. Deficits in gray matter volume represent in Schizophrenia but not bipolar disorder. Schizophr Res. 1997;26:85–92. doi: 10.1016/s0920-9964(97)00042-x. [DOI] [PubMed] [Google Scholar]