

Abstract
Genome-wide DNA hypomethylation plays an important role in epigenomic and genomic instability and colorectal carcinogenesis. DNA methylation in the long interspersed nucleotide element-1, L1 (LINE-1) repetitive element is a good indicator of global DNA methylation level. In addition, LINE-1 hypomethylation in blood cells has been associated with colorectal adenoma risk, and LINE-1 hypomethylation in colorectal cancer is related with prognosis and linearly predicts shorter patient survival. However, no study has comprehensively evaluated the precision of sodium bisulfite conversion and PCR-pyrosequencing to measure LINE-1 methylation. Using 10 paraffin-embedded colon cancers, 5 matched normal colon mucosa, and 5 unrelated peripheral blood buffy coat leukocyte specimens, we enriched tumor DNA by macrodissection and laser capture microdissection. LINE-1 methylation was calculated as an average of 100 * C/(C + T) at 4 CpG sites after bisulfite-PCR-pyrosequencing. The LINE-1 methylation value in colon cancers varied, ranging approximately from 30 to 80. To measure assay precision, we performed bisulfite conversion on seven different DNA specimen aliquots and repeated PCR-pyrosequencing seven times. Run-to-run (between-run) SD ranged from 1.3 to 4.4 (median, 3.0) in macrodissected colon cancers; 1.1 to 10.5 (median, 3.8) in laser capture microdissection specimens; 1.3 to 2.5 (median, 1.9) in normal colon; and 1.5 to 3.4 (median, 1.9) in leukocyte DNA. In conclusion, bisulfite conversion and PCR-pyrosequencing assay can measure LINE-1 methylation in macrodissected colon cancer, normal colon, and blood DNA, and may be useful in clinical and research settings.
Genome-wide DNA hypomethylation is considered to play an important role in genomic instability and carcinogenic processes.1,2,3,4,5,6,7 DNA methylation measured in LINE-1 (long interspersed nucleotide element-1, or L1) has been correlated with global DNA methylation,8,9,10,11 and linearly predicts survival of colon cancer patients.12 In addition, LINE-1 methylation levels in synchronous colorectal cancer pairs (ie, two or more primary colorectal cancers) are significantly correlated, suggesting the presence of a nonstochastic component in a variation of LINE-1 methylation levels in cancer.13 Nonetheless, utility of measuring LINE-1 or global DNA methylation levels in peripheral blood leukocytes remains controversial. One study has reported no significant association between LINE-1 methylation levels in blood leukocytes and risk of colorectal adenoma,14 whereas another study has shown an inverse association between global DNA methylation level in blood leukocytes and colorectal adenoma risk.15 Additional studies using precise LINE-1 methylation measurements are needed. Moreover, LINE-1 methylation measurement in peripheral blood can provide a useful way to evaluate the activity of DNA methylation inhibitors in solid tumor patients.16
Assays to measure DNA methylation, which are important in epigenetic research and clinical diagnostics,17 typically rely on conversion of unmethylated cytosine to uracil by sodium bisulfite. However, no previous study has evaluated the precision of bisulfite conversion to measure LINE-1 methylation. In addition, although pyrosequencing appears to be superior to combined bisulfite and restriction analysis or bisulfite/real-time PCR (MethyLight) in terms of precision of LINE-1 methylation measurement on plasma DNA,16 no study has comprehensively evaluated performance of bisulfite-pyrosequencing assay to measure LINE-1 methylation in paraffin-embedded tissue.
In this study, we assessed the precision of sodium bisulfite conversion and PCR-pyrosequencing assay using 10 paraffin-embedded colon cancer specimens, 5 matched normal colon specimens, and 5 unrelated blood specimens. We have shown that LINE-1 pyrosequencing assay has good precision and can reliably measure LINE-1 methylation in paraffin-embedded colon cancer, normal colon tissue, and peripheral blood cells.
Materials and Methods
Colon Cancer Tissue, Normal Colon, and Blood Specimens
Specimen collection and analysis in this study were approved by the Harvard School of Public Health and Brigham and Women's Hospital Institutional Review Boards. Formalin-fixed, paraffin-embedded colon cancer tissue specimens of 10 cases (designated as Case numbers 1 through 10) and 5 matched paraffin-embedded normal colon specimens were anonymized after collection from the archival file of Department of Pathology, Brigham and Women's Hospital. Peripheral blood specimens (designated as Blood numbers 11 through 15) were collected from 5 unrelated healthy volunteers, who provided informed consent.
Macrodissection and Laser Capture Microdissection of Tumor Specimens, and Bisulfite DNA Treatment
H&E-stained slides of the tumors were reviewed, and areas of tumor were marked for macrodissection, to enrich tumor DNA. H&E-stained tissue sections (15 μm sections) were scraped off from glass slides (herein referred to as “macrodissected colon cancers”) from tumor in Cases 1 to 10 and from normal colon in Cases 1 to 5. Approximately 500 cancer cells from 5 cases (Cases 1, 3, 7, 9 and 10) were collected by laser capture microdissection (LCM) using a LCM instrument (MDS Analytical Technologies, Ontario, Canada). Specimens collected by macrodissection and LCM were suspended in 140 μl of tissue lysate solution (100 mmol/L Tris, pH 8, 10 mmol/L EDTA, pH 8, 1 mg/ml proteinase K, and 0.05 mg/ml tRNA), and incubated overnight at 50°C. The lysate was aliquoted into seven tubes, each containing 18 μl of tissue lysate, and stored at −20°C until sodium bisulfite modification was performed. For blood specimens, DNA was extracted from 50 ml buffy coat fractions diluted with 150 ml of PBS by the Qiagen QIAamp Blood Kit (Qiagen, Chatsworth, CA) spin protocol. Treatment of tissue lysates and blood DNA specimens with sodium bisulfite was performed as previously described in detail.18 To assess precision of the bisulfite treatment step, bisulfite treatments seven times on each specimen, on seven different days.
PCR and Pyrosequencing Assay for LINE-1 Methylation
PCR and pyrosequencing for LINE-1 methylation were performed as previously described,19 using the PyroMark kit (Qiagen, Valencia, CA). Each PCR mix contained the forward and reverse primer (each 0.4 μmol/L), 0.8 μmol/L of dNTPs, 1.5 mmol/L of MgCl2, 1× PCR buffer (Qiagen), 0.64 U of HotStar Taq polymerase (Qiagen), and 2 μl of bisulfited template DNA in a total volume of 20 μl. PCR conditions were as follows: initial denaturing at 95°C for 15 minutes; 45 cycles of 95°C for 20 seconds, 50°C for 20 seconds, and 72°C for 20 seconds; and final extension at 72°C for 5 minutes. The PCR products (each 10 μl) were sequenced by pyrosequencing PSQ96 HS System (Qiagen) according to manufacturer's instructions (Figure 1, A and B). The nucleotide dispensation order was: 5′-ACTCAGTGTGTCAGTCAGTTAGTCTG-3′. It would not be practical to confirm complete bisulfite conversion at every unmethylated cytosine; nonetheless, we examined a single cytosine at a non-CpG site within PCR products (see arrows in Figure 1) as a reasonable and feasible alternative method to ensure successful bisulfite conversion of unmethylated cytosine. The amount of C divided by the sum of the amounts of C and T at each CpG site was calculated as percentage (ie, multiplied by 100). The first, third and fourth CpG sites follow stretches of Ts, resulting in higher T peaks (Figure 1, in light shade) than the second CpG site, and the proportion of C has been adjusted accordingly.
Figure 1.
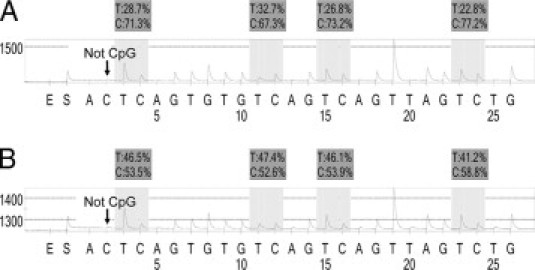
Pyrosequencing to measure LINE-1 methylation. A: Microdissected colon cancer (Case #1). B: Microdissected colon cancer (Case #2). The “%” numbers (in dark shade) are proportions of C and T at each CpG site after bisulfite conversion. Thus, the methylation level of each CpG site is estimated by the proportion of C (%). An overall LINE-1 methylation level is calculated as the average of the proportions of C at the four CpG sites. The first, third and fourth CpG sites follow stretches of Ts, resulting in higher T peaks (in light shade) than the second CpG site, and the proportion of C has been adjusted accordingly. The arrows indicate no residual C at the non-CpG site, ensuring complete bisulfite conversion.
The average of the relative amounts of C in the 4 CpG sites was used as overall LINE-1 methylation level in a given specimen. To assess assay precision, we repeated PCR-pyrosequencing seven times on each bisulfite treated DNA on seven different days (Figure 2). We compared SD of methylation values at each CpG site with SD of the average methylation values using the 4 CpG sites, among different bisulfite-modified DNA specimens (B1 through B7). With 100 comparisons, in 91 times (91%), the average methylation value gave smaller SD than methylation value at each CpG site (P < 0.0001). Thus, we used the average methylation value of the four CpG sites in each specimen for further analysis.
Figure 2.
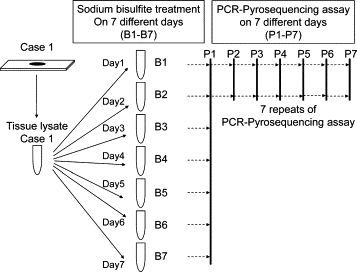
Strategy to assess precision of bisulfite conversion and PCR-pyrosequencing on each specimen (an example of macrodissected colon cancer Case #1). Bisulfite conversion was performed on seven different aliquots (B1 through B7) from each specimen. PCR-pyrosequencing was performed on the 7 bisulfite-treated specimens (B1–B7), and was repeated seven times on two specimens (B1 and B2) on seven different days (P1 through P7).
Results
Strategy to Assess Precision of Bisulfite Conversion and PCR-Pyrosequencing
To assess precision of bisulfite-PCR-pyrosequencing for LINE-1 methylation, we used 10 paraffin-embedded colon cancers, 5 matched paraffin-embedded normal colon specimens, and 5 unrelated blood DNA specimens. Colon cancer tissues were collected by macrodissection (Cases 1 to 10) and by LCM (Cases 1, 3, 7, 9, and 10). Figure 2 illustrates our overall strategy to measure the precision of bisulfite DNA conversion and PCR-pyrosequencing on each specimen. We performed bisulfite conversion on seven different aliquots from each specimen on seven different days. Thus, from each specimen, we have seven different bisulfite-converted DNA specimens (designated as B1 through B7), which ideally should show at least similar levels of LINE-1 methylation. Using PCR-pyrosequencing assay, we measured LINE-1 methylation level in each of the seven separate bisulfite-converted DNA specimens. For each case, we measured the SD of these seven LINE-1 methylation levels on B1 through B7, which would depend on variations in bisulfite conversion and PCR-pyrosequencing. Furthermore, we repeated PCR-pyrosequencing assays seven times (designated as P1 through P7) on two (B1 and B2) of the seven bisulfite-converted DNA specimens, on seven different days. We calculated the SD of the seven LINE-1 methylation levels (P1 through P7) on one bisulfite-converted DNA specimen. This SD would primarily depend on run-to-run (between-run) variation of PCR-pyrosequencing assay, but not on bisulfite conversion.
Table 1 shows an example of macrodissected colon cancer Case #1 in the assessment of precision of LINE-1 methylation measurement. Each of B1 though B7 represents each bisulfite-converted DNA specimen from this case. We obtained mean LINE-1 methylation value (72.8) across B1 through B7 in a single PCR-pyrosequencing run, and calculated bisulfite-to-bisulfite SD [designated as SD(B)] (0.4). P1 though P7 represent results of PCR-pyrosequencing assay by seven repeats on seven different days. We designated SD(P) as run-to-run (between-run) SD on a given bisulfite-treated DNA specimen. Mean LINE-1 methylation value was 73.6 with SD(P) of 1.6 for B1 specimen in this case.
Table 1.
Assessment of Precision of LINE-1 Methylation Measurement (an example of macrodissected colon cancer Case No. 1)
| Different PCR-pryosequencing runs (on 7 different days) |
|||||||||
|---|---|---|---|---|---|---|---|---|---|
| P1 | P2 | P3 | P4 | P5 | P6 | P7 | Mean of LINE-1 methylation values | Run-to-run SD or SD(P) | |
| Different bisulfite-treated | |||||||||
| DNA specimens | |||||||||
| B1 | 72.9 | 72.8 | 74.2 | 72.3 | 75.4 | 71.6 | 75.7 | 73.6 | 1.6 |
| B2 | 73.0 | 73.3 | 77.2 | 72.4 | 77.7 | 71.6 | 76.5 | 74.5 | 2.5 |
| B3 | 72.7 | ||||||||
| B4 | 72.3 | ||||||||
| B5 | 73.0 | ||||||||
| B6 | 73.5 | ||||||||
| B7 | 72.4 | ||||||||
| Mean of LINE-1 methylation values | 72.8 | ||||||||
| Bisulfite-to-bisulfite SD or SD(B) | 0.4 | ||||||||
B1 though B7 represent each bisulfite-converted DNA specimen from the same case. P1 though P7 represent PCR-pyrosequencing assay results on seven different days on a given bisulfite-treated DNA specimen. We made similar tables for each of the other nine colon cancer macrodissected specimens, five LCM (laser capture microdissection) specimens, five normal colon specimens, and five blood DNA specimens.
Bisulfite-to-Bisulfite SD of LINE-1 Methylation Values
Each of the 10 macrodissected colon cancers, 5 LCM specimens, 5 normal colons, and 5 blood DNA specimens was treated by sodium bisulfite on 7 different days, and aliquoted into 7 different tubes (B1 through B7) (Figure 2). We assessed variation of LINE-1 methylation values across B1 through B7 for each source of bisulfite-treated DNA specimens. Figure 3A shows LINE-1 methylation values [mean ± SD or SD(B)] on B1 through B7 for each specimen source. For the macrodissected colon cancers, normal colons, and blood DNA specimens, SD(B) was generally small, implying that a single bisulfite-treated DNA aliquot could provide precise LINE-1 methylation measurement. However, for the LCM specimens, SD(B) was relatively large. The median of SD(B) was as follows: 1.2 (ranging 0.4 to 2.4) in the 10 macrodissected colon cancers; 4.2 (ranging 3.1 to 13.4) in the 5 LCM specimens; 1.3 (ranging 0.5 to 2.3) in the 5 normal colons; and 1.1 (ranging 0.4 to 1.3) in the 5 blood DNA specimens. In the macrodissected colon cancers, SD(B) was small regardless of mean LINE-1 methylation level. Of note, all normal colons and blood DNA specimens provided high-level LINE-1 methylation (between 65 and 80).
Figure 3.
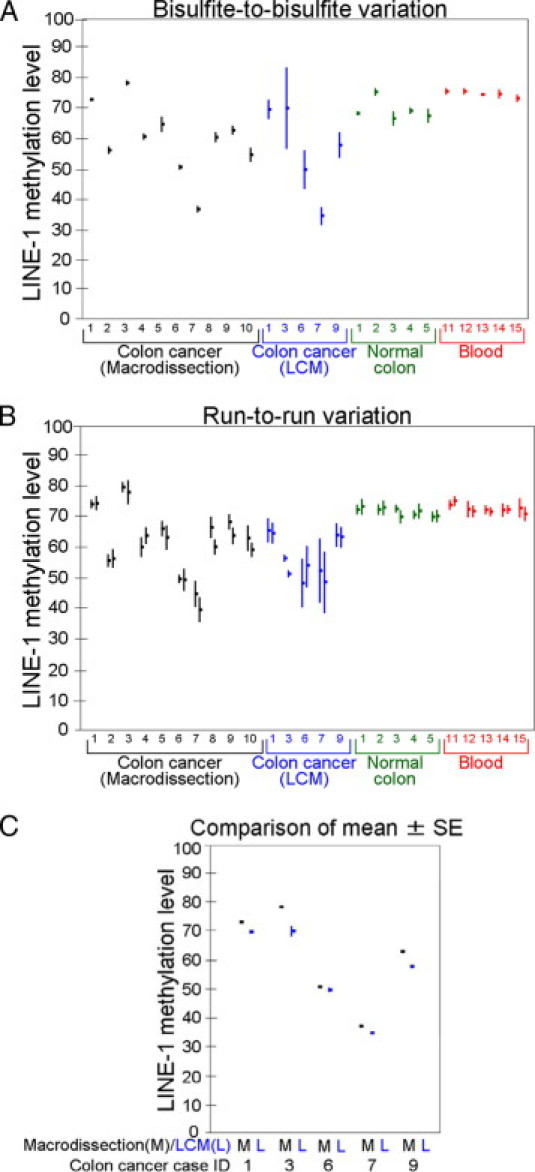
Results on repeated measurements of LINE-1 methylation levels. A: Bisulfite-to-bisulfite variation of LINE-1 methylation values. Each dot and vertical bar represent mean and SD [SD or SD(B) in Table 1], respectively, of LINE-1 methylation values among different bisulfite-treated DNA specimens from each case (DNA source). The x-axis indicates DNA sources, ie, 10 macrodissected colon cancers, 5 matched colon cancers collected by LCM, 5 matched normal colons, and 5 unrelated blood DNA specimens, with each number representing Case ID. B: Run-to-run (between-run) variation of LINE-1 methylation values. Each dot and vertical bar represent mean and SD [SD or SD(P) in Table 1], respectively, of LINE-1 methylation values among different runs on the same bisulfite-treated DNA specimen. The x-axis indicates DNA sources, ie, 10 macrodissected colon cancers, 5 matched colon cancers collected by LCM, 5 matched normal colons, and 5 unrelated blood DNA specimens, with each number representing Case ID. Results from B1 (bisulfite-treated specimen #1; see Figure 2) and B2 are shown side-by-side for each DNA source. C: Mean LINE-1 methylation value and SE of mean in the 5 macrodissected colon cancers and matched LCM specimens. Note that each SE of mean is small due to seven repeated measurements. When a LCM specimen showed low-level LINE-1 methylation (eg, Cases 6 and 7), a matched macrodissected specimen also showed low-level LINE-1 methylation.
Run-to-Run (Between-Run) SD of LINE-1 Methylation Values
We examined run-to-run (between-run) variation of PCR-pyrosequencing assay by repeating seven times using two of the seven bisulfite-treated DNA specimens from each DNA source (Figure 2). Figure 3B shows LINE-1 methylation value [mean ± SD or SD(P)] of seven different PCR-pyrosequencing runs on various specimens. The median of SD(P) was as follows: 3.0 (ranging 1.3 to 4.4) in the 10 macrodissected colon cancers; 3.8 (ranging 1.1 to 10.5) in the 5 LCM colon cancers; 1.9 (ranging 1.3 to 2.5) in the 5 normal colons; and 1.9 (ranging 1.5 to 3.4) in the 5 blood DNA specimens.
Mean LINE-1 Methylation Value in Macrodissected Colon Cancer and Matched LCM Specimens
Macrodissected colon cancer specimens contain a mixture of tumor cells, inflammatory cells, stromal cells, and blood vessels. How well LINE-1 methylation in macrodissected colon cancer reflects LINE-1 methylation level in a pure collection of tumor cells remains uncertain. Thus, we compared LINE-1 methylation values in macrodissected colon cancers with that in matched LCM specimens with a pure collection of tumor cells. Because SD(B) in the LCM specimens was relatively large, we used the mean LINE-1 methylation value in B1 through B7. Because of the central limit theorem, we could obtain a precise measure of mean LINE-1 methylation values from the LCM specimens using seven different aliquots (B1 through B7). That is, even though a single measure on a LCM specimen could not give a precise LINE-1 methylation value, the use of repeated measurements could provide a precise measurement estimate. Because a value by LINE-1 methylation measurement is a random variable and there is a underlying (true) value of LINE-1 methylation in each specimen, repeated values by LINE-1 methylation measurements are approximately normally distributed with a mean close to “the underlying value” and SD of σ. Then, the mean of repeated LINE-1 methylation measurements (in a specified number “N” of repeats) are also normally distributed with a mean close to “the underlying value” and SD (or SE of mean) of “σ/N”, which is essentially the central limit theorem. That means, when measurements are repeated, variation (ie, SE) of the mean becomes smaller, inversely proportional to the number of repeats. As the variation of the mean becomes smaller (with an increasing number of repeats), we are able to obtain the mean value closer to “the underlying value.” Thus, methylation level (“the underlying value”) of pure tumor cell collection could be quite precisely measured by repeated measurements.
Figure 3C shows mean LINE-1 methylation values (mean ± SE) in the five macrodissected colon cancers and matched LCM specimens. A small SE of the mean implied a precise measurement of the mean LINE-1 methylation. Because SE of the mean was consistently small, the mean LINE-1 methylation estimate was quite precise even though it might not be accurate. When a LCM specimen showed low-level LINE-1 methylation (eg, Cases 6 and 7), a macrodissected specimen comparably showed low-level LINE-1 methylation. This implied that any effect of contaminating normal cells on LINE-1 methylation value did not appear to be substantial.
Discussion
In this study, we evaluated the precision of sodium bisulfite conversion and PCR-pyrosequencing assay for LINE-1 methylation assessment, in 10 paraffin-embedded colon cancer specimens, prepared by both macrodissection and LCM, 5 matched normal colon specimens, and 5 unrelated blood leukocyte specimens. Our data have shown that PCR-pyrosequencing assay of LINE-1 methylation level has good precision for macrodissected colon cancer, normal colon tissue and blood DNA specimens. Nonetheless, based on our data, it may be ideal to obtain repeated measurements (two or three times) for a more precise estimate of LINE-1 methylation level in a given specimen. In addition, tumoral LINE-1 hypomethylation can be detected using macrodissected colon cancer specimens despite the presence of contaminating normal cells. Our data indicate that LINE-1 methylation level in colon cancer, normal colon mucosa, or peripheral blood cells can be measured by bisulfite-pyrosequencing assay for clinical or research use.
Pyrosequencing is a nonelectrophoretic nucleotide extension sequencing technology for various applications20,21 including single nucleotide polymorphism genotyping,14 bacterial strain typing,22 mutation detection in tumors23,24,25,26,27 and quantitative CpG island methylation analyses.17,28,29,30,31,32 The pyrosequencing technology has especially good precision at higher methylation levels, such as are observed in LINE-1.8,9,19,33,34 While pyrosequencing has previously been shown to be more precise than combined bisulfite and restriction analysis and MethyLight for LINE-1 methylation measurements of plasma DNA,16 we believe this is the first study to comprehensively evaluate its performance on paraffin-embedded, formalin-fixed tissues.
DNA methylation is a major epigenetic mechanism in X-chromosome inactivation, imprinting and repression of repetitive elements such as retrotransposons and endogenous retroviruses,35,36 and studying epigenetic alterations is important in cancer research.17,32,37,38,39,40,41,42,43,44,45 Genome-wide DNA hypomethylation plays an important role in genomic instability by reactivating transposable DNA sequences and, therefore, contributes to colorectal carcinogenesis.1,3,4,5,6,35,39,46,47,48 Previous studies have reported that most carcinomas of colon, stomach, breast, lung, prostate, liver, and esophagus show hypomethylation of LINE-1 compared with matched normal tissues.1,19,34,49 In colorectal carcinogenesis model, LINE-1 methylation level in colon cancer is lower than that of adenomas and normal colonic cells. In addition, LINE-1 methylation level in peripheral blood cells has been associated with a decreased risk of colorectal adenoma.15 LINE-1 methylation is a good indicator of global DNA methylation level, and has been shown to become lower as an advance in colorectal carcinogenic process.8,9 Therefore, precise measurement of LINE-1 methylation levels in colon cancer, normal colon, and peripheral blood is important for estimating mortality of colon cancer patients and a risk of developing colorectal neoplasia.1,12,13,14,15,16 In addition, LINE-1 methylation may be a useful marker for predicting cancer prognosis12 and monitoring efficacy of adjuvant therapy in cancer patients.16
A variety of assays to measure LINE-1 methylation have been developed for paraffin-embedded tissue, and many of these methods rely on sodium bisulfite treatment of genomic DNA from tumor tissue. Sodium bisulfite treatment of DNA is a harsh chemical method, and previous data suggest that 84% to 96% of DNA is degraded within 4 hours of bisulfite treatment at 55°C.50 To measure the precision of bisulfite conversion, we performed bisulfite treatment on seven different aliquots of DNA from various specimen sources (macrodissected colon cancers, matched LCM specimens, matched normal colons, and unrelated blood DNA specimens). Our results indicate that variation of LINE-1 methylation values between different bisulfite treatments is not substantial, and that one bisulfite-treated DNA specimen can provide precise measurement of LINE-1 methylation value. These results are in agreement with our previous data on precision of CpG island methylation measurement by bisulfite-MethyLight (real-time PCR) assay.18
To measure the precision of the PCR-pyrosequencing assay, we also repeated PCR-pyrosequencing seven times. Our results indicate that run-to-run (between-run) variation of LINE-1 methylation values is not large, and a single run of PCR-pyrosequencing can provide reasonably precise measurement of LINE-1 methylation in a given specimen.
We observed a larger variation of LINE-1 methylation values in the LCM specimens. LCM specimens appear to provide less precise LINE-1 methylation level, and it may be necessary to repeat bisulfite treatments and/or PCR-pyrosequencing to obtain precise LINE-1 measurement. One possible explanation might be that tumor tissue was inherently heterogeneous, and contained some tumor cells with high-level LINE-1 methylation and other tumor cells with low-level LINE-1 methylation. By using the LCM technique, this heterogeneity might manifest as a large variation of LINE-1 methylation values from one LCM preparation to next. This hypothesis well explains why LCM specimens showed much larger bisulfite-to-bisulfite variation (in repeats on seven LCM specimens) than macrodissected colon cancer, whereas a difference in the run-to-run variations (in repeats on one LCM or macrodissected specimen) was small between macrodissected colon cancers and LCM specimens. These results imply that, if LCM is used to study LINE-1 methylation levels in tumor, it may be advisable to have good sampling throughout the tumor section to obtain representative LINE-1 methylation value. In addition, location-specific LINE-1 methylation levels and/or heterogeneity of LINE-1 methylation levels within tumor may have clinical/biological significance. Future studies are necessary to address this intriguing question.
Tumor tissue contains a mixture of tumor cells, inflammatory cells, stromal cells, and blood vessels. It is possible that macrodissected cancer tissue may not be an ideal specimen for the detection of LINE-1 hypomethylation. Therefore, we compared a mean LINE-1 methylation value in macrodissected colon cancer with that in a matched LCM specimen. Because of the central limit theorem, by seven repeats of bisulfite treatment, we could obtain precise measures of mean LINE-1 methylation value from both macrodissected colon caners and matched LCM specimens. We have shown that LINE-1 hypomethylation can be detected in macrodissected colon cancer specimens, and there is no substantial difference in the degrees of LINE-1 hypomethylation between macrodissected colon cancers and matched LCM specimens. Our data indicate that contaminating normal cells do not substantially affect LINE-1 methylation measurement in colon cancer.
In summary, our study has shown that sodium bisulfite conversion is reproducible and that subsequent PCR-pyrosequencing assay can assess LINE-1 methylation in macrodissected colon cancer, normal colon, and peripheral blood leukocyte specimens, preferably with repeated measurements. Bisulfite-pyrosequencing is a useful methodology in molecular diagnostics and large-scale epidemiological studies.
Acknowledgements
We thank Walter Willett for helpful suggestions, Takako Kawasaki for implementing the LINE-1 pyrosequencing assay, Liying Yan for technical advice, and Janina Longtine for our use of the pyrosequencing instrument.
Footnotes
Supported by the U.S. National Institute of Health (grant P01 CA87969 to S. Hankinson, P01 CA55075 to W. Willett, P50 CA127003 to C.S.F., K07 CA122826 to S.O.); the Bennett Family Fund; and the Entertainment Industry Foundation National Colorectal Cancer Research Alliance. K.N. was supported by a fellowship grant from the Japan Society for Promotion of Science.
N.I., K.N., and Y.B. contributed equally to this work.
The content is solely the responsibility of the authors and does not necessarily represent the official views of NCI or NIH. Funding agencies did not have any role in the design of the study; the collection, analysis, or interpretation of the data; the decision to submit the manuscript for publication; or the writing of the manuscript.
This work was presented as an abstract at the 2009 Association for Molecular Pathology Annual Meeting in Kissimmee, Florida.
References
- 1.Chalitchagorn K, Shuangshoti S, Hourpai N, Kongruttanachok N, Tangkijvanich P, Thong-ngam D, Voravud N, Sriuranpong V, Mutirangura A. Distinctive pattern of LINE-1 methylation level in normal tissues and the association with carcinogenesis. Oncogene. 2004;23:8841–8846. doi: 10.1038/sj.onc.1208137. [DOI] [PubMed] [Google Scholar]
- 2.Deng G, Nguyen A, Tanaka H, Matsuzaki K, Bell I, Mehta KR, Terdiman JP, Waldman FM, Kakar S, Gum J, Crawley S, Sleisenger MH, Kim YS. Regional hypermethylation and global hypomethylation are associated with altered chromatin conformation and histone acetylation in colorectal cancer. Int J Cancer. 2006;118:2999–3005. doi: 10.1002/ijc.21740. [DOI] [PubMed] [Google Scholar]
- 3.Gaudet F, Hodgson JG, Eden A, Jackson-Grusby L, Dausman J, Gray JW, Leonhardt H, Jaenisch R. Induction of tumors in mice by genomic hypomethylation. Science. 2003;300:489–492. doi: 10.1126/science.1083558. [DOI] [PubMed] [Google Scholar]
- 4.Holm TM, Jackson-Grusby L, Brambrink T, Yamada Y, Rideout WM, 3rd, Jaenisch R. Global loss of imprinting leads to widespread tumorigenesis in adult mice. Cancer Cell. 2005;8:275–285. doi: 10.1016/j.ccr.2005.09.007. [DOI] [PubMed] [Google Scholar]
- 5.Matsuzaki K, Deng G, Tanaka H, Kakar S, Miura S, Kim YS. The relationship between global methylation level, loss of heterozygosity, and microsatellite instability in sporadic colorectal cancer. Clin Cancer Res. 2005;11:8564–8569. doi: 10.1158/1078-0432.CCR-05-0859. [DOI] [PubMed] [Google Scholar]
- 6.Suzuki K, Suzuki I, Leodolter A, Alonso S, Horiuchi S, Yamashita K, Perucho M. Global DNA demethylation in gastrointestinal cancer is age dependent and precedes genomic damage. Cancer Cell. 2006;9:199–207. doi: 10.1016/j.ccr.2006.02.016. [DOI] [PubMed] [Google Scholar]
- 7.Yamada Y, Jackson-Grusby L, Linhart H, Meissner A, Eden A, Lin H, Jaenisch R. Opposing effects of DNA hypomethylation on intestinal and liver carcinogenesis. Proc Natl Acad Sci USA. 2005;102:13580–13585. doi: 10.1073/pnas.0506612102. [DOI] [PMC free article] [PubMed] [Google Scholar]
- 8.Yang AS, Doshi KD, Choi SW, Mason JB, Mannari RK, Gharybian V, Luna R, Rashid A, Shen L, Estecio MR, Kantarjian HM, Garcia-Manero G, Issa JP. DNA methylation changes after 5-aza-2′-deoxycytidine therapy in patients with leukemia. Cancer Res. 2006;66:5495–5503. doi: 10.1158/0008-5472.CAN-05-2385. [DOI] [PubMed] [Google Scholar]
- 9.Yang AS, Estecio MR, Doshi K, Kondo Y, Tajara EH, Issa JP. A simple method for estimating global DNA methylation using bisulfite PCR of repetitive DNA elements. Nucleic Acids Res. 2004;32:e38. doi: 10.1093/nar/gnh032. [DOI] [PMC free article] [PubMed] [Google Scholar]
- 10.Weisenberger DJ, Campan M, Long TI, Kim M, Woods C, Fiala E, Ehrlich M, Laird PW. Analysis of repetitive element DNA methylation by MethyLight. Nucleic Acids Res. 2005;33:6823–6836. doi: 10.1093/nar/gki987. [DOI] [PMC free article] [PubMed] [Google Scholar]
- 11.Woodson K, Weisenberger DJ, Campan M, Laird PW, Tangrea J, Johnson LL, Schatzkin A, Lanza E. Gene-specific methylation and subsequent risk of colorectal adenomas among participants of the polyp prevention trial. Cancer Epidemiol Biomarkers Prev. 2005;14:1219–1223. doi: 10.1158/1055-9965.EPI-04-0726. [DOI] [PubMed] [Google Scholar]
- 12.Ogino S, Nosho K, Kirkner GJ, Kawasaki T, Chan AT, Schernhammer ES, Giovannucci EL, Fuchs CS. A cohort study of tumoral LINE-1 hypomethylation and prognosis in colon cancer. J Natl Cancer Inst. 2008;100:1734–1738. doi: 10.1093/jnci/djn359. [DOI] [PMC free article] [PubMed] [Google Scholar]
- 13.Nosho K, Kure S, Irahara N, Shima K, Baba Y, Spiegelman D, Meyerhardt JA, Giovannucci EL, Fuchs CS, Ogino S. A prospective cohort study shows unique epigenetic, genetic, and prognostic features of synchronous colorectal cancers. Gastroenterology. 2009;137:1609–1620. doi: 10.1053/j.gastro.2009.08.002. [DOI] [PMC free article] [PubMed] [Google Scholar]
- 14.Figueiredo JC, Grau MV, Wallace K, Levine AJ, Shen L, Hamdan R, Chen X, Bresalier RS, McKeown-Eyssen G, Haile RW, Baron JA, Issa JP. Global DNA hypomethylation (LINE-1) in the normal colon and lifestyle characteristics and dietary and genetic factors. Cancer Epidemiol Biomarkers Prev. 2009;18:1041–1049. doi: 10.1158/1055-9965.EPI-08-0926. [DOI] [PMC free article] [PubMed] [Google Scholar]
- 15.Lim U, Flood A, Choi SW, Albanes D, Cross AJ, Schatzkin A, Sinha R, Katki HA, Cash B, Schoenfeld P, Stolzenberg-Solomon R. Genomic methylation of leukocyte DNA in relation to colorectal adenoma among asymptomatic women. Gastroenterology. 2008;134:47–55. doi: 10.1053/j.gastro.2007.10.013. [DOI] [PMC free article] [PubMed] [Google Scholar]
- 16.Aparicio A, North B, Barske L, Wang X, Bollati V, Weisenberger D, Yoo C, Tannir N, Horne E, Groshen S, Jones P, Yang A, Issa JP. LINE-1 methylation in plasma DNA as a biomarker of activity of DNA methylation inhibitors in patients with solid tumors. Epigenetics. 2009;4:176–184. doi: 10.4161/epi.4.3.8694. [DOI] [PMC free article] [PubMed] [Google Scholar]
- 17.Sepulveda AR, Jones D, Ogino S, Samowitz W, Gulley ML, Edwards R, Levenson V, Pratt VM, Yang B, Nafa K, Yan L, Vitazka P. CpG methylation analysis - current status of clinical assays and potential applications in molecular diagnostics: a report of the association for molecular pathology. J Mol Diagn. 2009;11:266–278. doi: 10.2353/jmoldx.2009.080125. [DOI] [PMC free article] [PubMed] [Google Scholar]
- 18.Ogino S, Kawasaki T, Brahmandam M, Cantor M, Kirkner GJ, Spiegelman D, Makrigiorgos GM, Weisenberger DJ, Laird PW, Loda M, Fuchs CS. Precision and performance characteristics of bisulfite conversion and real-time PCR (MethyLight) for quantitative DNA methylation analysis. J Mol Diagn. 2006;8:209–217. doi: 10.2353/jmoldx.2006.050135. [DOI] [PMC free article] [PubMed] [Google Scholar]
- 19.Ogino S, Kawasaki T, Nosho K, Ohnishi M, Suemoto Y, Kirkner GJ, Fuchs CS. LINE-1 hypomethylation is inversely associated with microsatellite instability and CpG island methylator phenotype in colorectal cancer. Int J Cancer. 2008;122:2767–2773. doi: 10.1002/ijc.23470. [DOI] [PMC free article] [PubMed] [Google Scholar]
- 20.Fakhrai-Rad H, Pourmand N, Ronaghi M. Pyrosequencing: an accurate detection platform for single nucleotide polymorphisms. Hum Mutat. 2002;19:479–485. doi: 10.1002/humu.10078. [DOI] [PubMed] [Google Scholar]
- 21.Ronaghi M. Pyrosequencing sheds light on DNA sequencing. Genome Res. 2001;11:3–11. doi: 10.1101/gr.11.1.3. [DOI] [PubMed] [Google Scholar]
- 22.Jordan JA, Butchko AR, Durso MB. Use of pyrosequencing of 16S rRNA fragments to differentiate between bacteria responsible for neonatal sepsis. J Mol Diagn. 2005;7:105–110. doi: 10.1016/s1525-1578(10)60015-3. [DOI] [PMC free article] [PubMed] [Google Scholar]
- 23.Garcia CA, Ahmadian A, Gharizadeh B, Lundeberg J, Ronaghi M, Nyren P. Mutation detection by pyrosequencing: sequencing of exons 5-8 of the p53 tumor suppressor gene. Gene. 2000;253:249–257. doi: 10.1016/s0378-1119(00)00257-2. [DOI] [PubMed] [Google Scholar]
- 24.Ahmadian A, Lundeberg J, Nyren P, Uhlen M, Ronaghi M. Analysis of the p53 tumor suppressor gene by pyrosequencing. Biotechniques. 2000;28:140–144. doi: 10.2144/00281rr02. 146–147. [DOI] [PubMed] [Google Scholar]
- 25.Ogino S, Kawasaki T, Brahmandam M, Yan L, Cantor M, Namgyal C, Mino-Kenudson M, Lauwers GY, Loda M, Fuchs CS. Sensitive sequencing method for KRAS mutation detection by pyrosequencing. J Mol Diagn. 2005;7:413–421. doi: 10.1016/S1525-1578(10)60571-5. [DOI] [PMC free article] [PubMed] [Google Scholar]
- 26.Nosho K, Kawasaki T, Ohnishi M, Suemoto Y, Kirkner GJ, Zepf D, Yan L, Longtine JA, Fuchs CS, Ogino S. PIK3CA mutation in colorectal cancer: relationship with genetic and epigenetic alterations. Neoplasia. 2008;10:534–541. doi: 10.1593/neo.08336. [DOI] [PMC free article] [PubMed] [Google Scholar]
- 27.Ogino S, Kawasaki T, Kirkner GJ, Loda M, Fuchs CS. CpG island methylator phenotype-low (CIMP-low) in colorectal cancer: possible associations with male sex and KRAS mutations. J Mol Diagn. 2006;8:582–588. doi: 10.2353/jmoldx.2006.060082. [DOI] [PMC free article] [PubMed] [Google Scholar]
- 28.Colella S, Shen L, Baggerly KA, Issa JP, Krahe R. Sensitive and quantitative universal pyrosequencing methylation analysis of CpG sites. Biotechniques. 2003;35:146–150. doi: 10.2144/03351md01. [DOI] [PubMed] [Google Scholar]
- 29.Uhlmann K, Brinckmann A, Toliat MR, Ritter H, Nurnberg P. Evaluation of a potential epigenetic biomarker by quantitative methyl-single nucleotide polymorphism analysis. Electrophoresis. 2002;23:4072–4079. doi: 10.1002/elps.200290023. [DOI] [PubMed] [Google Scholar]
- 30.Tost J, Dunker J, Gut IG. Analysis and quantification of multiple methylation variable positions in CpG islands by pyrosequencing. Biotechniques. 2003;35:152–156. doi: 10.2144/03351md02. [DOI] [PubMed] [Google Scholar]
- 31.Mikeska T, Bock C, El-Maarri O, Hubner A, Ehrentraut D, Schramm J, Felsberg J, Kahl P, Buttner R, Pietsch T, Waha A. Optimization of quantitative MGMT promoter methylation analysis using pyrosequencing and combined bisulfite restriction analysis. J Mol Diagn. 2007;9:368–381. doi: 10.2353/jmoldx.2007.060167. [DOI] [PMC free article] [PubMed] [Google Scholar]
- 32.Dejeux E, Audard V, Cavard C, Gut IG, Terris B, Tost J. Rapid identification of promoter hypermethylation in hepatocellular carcinoma by pyrosequencing of etiologically homogeneous sample pools. J Mol Diagn. 2007;9:510–520. doi: 10.2353/jmoldx.2007.060209. [DOI] [PMC free article] [PubMed] [Google Scholar]
- 33.Estecio MR, Gharibyan V, Shen L, Ibrahim AE, Doshi K, He R, Jelinek J, Yang AS, Yan PS, Huang TH, Tajara EH, Issa JP. LINE-1 hypomethylation in cancer is highly variable and inversely correlated with microsatellite instability. PLoS ONE. 2007;2:e399. doi: 10.1371/journal.pone.0000399. [DOI] [PMC free article] [PubMed] [Google Scholar]
- 34.Choi SH, Worswick S, Byun HM, Shear T, Soussa JC, Wolff EM, Douer D, Garcia-Manero G, Liang G, Yang AS. Changes in DNA methylation of tandem DNA repeats are different from interspersed repeats in cancer. Int J Cancer. 2009;125:723–729. doi: 10.1002/ijc.24384. [DOI] [PMC free article] [PubMed] [Google Scholar]
- 35.Esteller M. Epigenetics in cancer. N Engl J Med. 2008;358:1148–1159. doi: 10.1056/NEJMra072067. [DOI] [PubMed] [Google Scholar]
- 36.Jones PA, Baylin SB. The epigenomics of cancer. Cell. 2007;128:683–692. doi: 10.1016/j.cell.2007.01.029. [DOI] [PMC free article] [PubMed] [Google Scholar]
- 37.Schernhammer ES, Giovannucci E, Kawasaki T, Rosner B, Fuchs CS, Ogino S. Dietary folate, alcohol, and B vitamins in relation to LINE-1 hypomethylation in colon cancer. Gut 2010: in press (published online, doi: 10.1136/gut.2009.183707) [DOI] [PMC free article] [PubMed]
- 38.Melnikov A, Scholtens D, Godwin A, Levenson V. Differential methylation profile of ovarian cancer in tissues and plasma. J Mol Diagn. 2009;11:60–65. doi: 10.2353/jmoldx.2009.080072. [DOI] [PMC free article] [PubMed] [Google Scholar]
- 39.Balic M, Pichler M, Strutz J, Heitzer E, Ausch C, Samonigg H, Cote RJ, Dandachi N. High quality assessment of DNA methylation in archival tissues from colorectal cancer patients using quantitative high-resolution melting analysis. J Mol Diagn. 2009;11:102–108. doi: 10.2353/jmoldx.2009.080109. [DOI] [PMC free article] [PubMed] [Google Scholar]
- 40.Gustafson KS. Locked nucleic acids can enhance the analytical performance of quantitative methylation-specific polymerase chain reaction. J Mol Diagn. 2008;10:33–42. doi: 10.2353/jmoldx.2008.070076. [DOI] [PMC free article] [PubMed] [Google Scholar]
- 41.Melnikov AA, Scholtens DM, Wiley EL, Khan SA, Levenson VV. Array-based multiplex analysis of DNA methylation in breast cancer tissues. J Mol Diagn. 2008;10:93–101. doi: 10.2353/jmoldx.2008.070077. [DOI] [PMC free article] [PubMed] [Google Scholar]
- 42.Vlassenbroeck I, Califice S, Diserens AC, Migliavacca E, Straub J, Di Stefano I, Moreau F, Hamou MF, Renard I, Delorenzi M, Flamion B, DiGuiseppi J, Bierau K, Hegi ME. Validation of real-time methylation-specific PCR to determine O6-methylguanine-DNA methyltransferase gene promoter methylation in glioma. J Mol Diagn. 2008;10:332–337. doi: 10.2353/jmoldx.2008.070169. [DOI] [PMC free article] [PubMed] [Google Scholar]
- 43.Nygren AO, Lens SI, Carvalho R. Methylation-specific multiplex ligation-dependent probe amplification enables a rapid and reliable distinction between male FMR1 premutation and full-mutation alleles. J Mol Diagn. 2008;10:496–501. doi: 10.2353/jmoldx.2008.080053. [DOI] [PMC free article] [PubMed] [Google Scholar]
- 44.Kholod N, Boniver J, Delvenne P. A new dimethyl sulfoxide-based method for gene promoter methylation detection. J Mol Diagn. 2007;9:574–581. doi: 10.2353/jmoldx.2007.070025. [DOI] [PMC free article] [PubMed] [Google Scholar]
- 45.Samowitz WS. The CpG island methylator phenotype in colorectal cancer. J Mol Diagn. 2007;9:281–283. doi: 10.2353/jmoldx.2007.070031. [DOI] [PMC free article] [PubMed] [Google Scholar]
- 46.Ji W, Hernandez R, Zhang XY, Qu GZ, Frady A, Varela M, Ehrlich M. DNA demethylation and pericentromeric rearrangements of chromosome 1. Mutat Res. 1997;379:33–41. doi: 10.1016/s0027-5107(97)00088-2. [DOI] [PubMed] [Google Scholar]
- 47.Karpf AR, Matsui S. Genetic disruption of cytosine DNA methyltransferase enzymes induces chromosomal instability in human cancer cells. Cancer Res. 2005;65:8635–8639. doi: 10.1158/0008-5472.CAN-05-1961. [DOI] [PubMed] [Google Scholar]
- 48.Bestor TH. Transposons reanimated in mice. Cell. 2005;122:322–325. doi: 10.1016/j.cell.2005.07.024. [DOI] [PubMed] [Google Scholar]
- 49.Pattamadilok J, Huapai N, Rattanatanyong P, Vasurattana A, Triratanachat S, Tresukosol D, Mutirangura A. LINE-1 hypomethylation level as a potential prognostic factor for epithelial ovarian cancer. Int J Gynecol Cancer. 2008;18:711–717. doi: 10.1111/j.1525-1438.2007.01117.x. [DOI] [PubMed] [Google Scholar]
- 50.Grunau C, Clark SJ, Rosenthal A. Bisulfite genomic sequencing: systematic investigation of critical experimental parameters. Nucleic Acids Res. 2001;29:E65. doi: 10.1093/nar/29.13.e65. [DOI] [PMC free article] [PubMed] [Google Scholar]