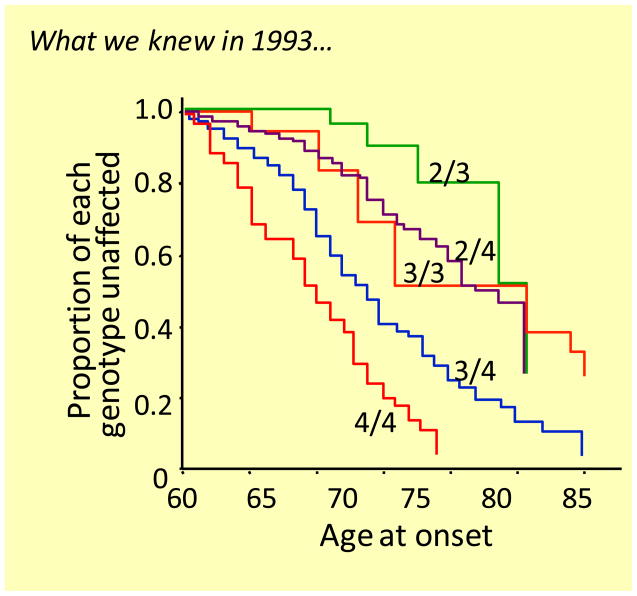
Figure 5. Age of onset curves for individuals with the indicated genotypes using the information available in 1993.
From [1]. Today we propose that each of the age of onset curves is an average of sub-curves. There are two curves for APOE3/4 individuals due to the presence of either a short or a long 523 polymorphisms linked to APOE3. There are likely three curves for APOE3/3 individuals due to the possible combination of alleles at 523, i.e. short/short, short/very long, and very long/very long.

