

SUMMARY
Scale-free dynamics, with a power spectrum following P ∝ f-β, are an intrinsic feature of many complex processes in nature. In neural systems, scale-free activity is often neglected in electrophysiological research. Here, we investigate scale-free dynamics in human brain and show that it contains extensive nested frequencies, with the phase of lower frequencies modulating the amplitude of higher frequencies in an upward progression across the frequency spectrum. The functional significance of scale-free brain activity is indicated by task performance modulation and regional variation, with β being larger in default network and visual cortex and smaller in hippocampus and cerebellum. The precise patterns of nested frequencies in the brain differ from other scale-free dynamics in nature, such as earth seismic waves and stock market fluctuations, suggesting system-specific generative mechanisms. Our findings reveal robust temporal structures and behavioral significance of scale-free brain activity and should motivate future study on its physiological mechanisms and cognitive implications.
INTRODUCTION
Since the invention of human electroencephalography (EEG), and Berger’s first demonstration of the human occipital alpha rhythm (Berger, 1929), the search for brain rhythms has been a dominant theme not only in human EEG and subsequent animal local field potential (LFP) research, but also in routine clinical EEG practice. Indeed, the classical frequency bands in EEG – delta (1-3 Hz), theta (4-8 Hz), alpha (9-12 Hz), beta (12-30 Hz) and gamma (>30 Hz)1 – were demarcated based on the various oscillatory rhythms that appear conspicuously in EEG traces in specific behavioral states, such as delta oscillations during sleep, theta oscillations under certain types of cognition, alpha oscillations during eye-closure, beta and gamma oscillations in activated states. However, as pointed out by several pioneers in the field (Bullock et al., 1995; Bullock et al., 2003; Freeman and Zhai, 2009; Logothetis, 2002), arrhythmic brain activity also constitutes a significant, if not the major, part of EEG and LFP records, but much less is known about it. Recently, it was found that broadband field potentials recorded from the human brain are modulated by task performance and correlate with neuronal spiking activity (Manning et al., 2009; Miller et al., 2009b). Moreover, synchronization between different neuronal groups not only occurs via synchronized oscillations, but may also manifest within arrhythmic brain activity with no apparent periodicity (Eckhorn, 1994; Thivierge and Cisek, 2008).
Viewed in the frequency domain, the temporal power spectrum of arrhythmic brain activity roughly follows a straight line when plotted in coordinates of log power vs. log frequency: log(P) ∝ -β log(f) or P ∝ f-β (0 < β < 4). This is called a “power-law” distribution, “scale-free” or “fractal” dynamics, and is commonly referred to as “1/f noise” (note, however, that the exponent β for brain signals is not always in the vicinity of 1, see below). Periodic brain oscillations appear as local peaks that rise above the power-law distribution in the power spectrum. This arrhythmic, scale-free brain activity is invisible in many EEG or LFP studies, since power at each frequency is routinely normalized by its value during a pre-task baseline, effectively removing the presence of the 1/f-β spectrum, or else the data is pre-whitened to remove the 1/f-β spectrum and emphasize oscillations (e.g., Buzsaki, 2006; Mitra and Pesaran, 1999). This systematic disregard of “1/f noise” is partly due to its ubiquitous presence in nature, including earthquakes, solar flares, economics, evolution, ecology, epidemics, electronics, speech and music (Bak, 1996; Gisiger, 2001; Hsu and Hsu, 1991; Voss and Clarke, 1975), which often leads to doubts of any significance that “1/f noise” might play in operations specific to the brain. In addition, the possibility that “1/f noise” might originate from instrument noise (Zarahn et al., 1997) has also deterred investigations on scale-free activity in relation to brain function.
However, not only do LFP, EEG and functional magnetic resonance imaging (fMRI) signals recorded from the brain exhibit scale-free dynamics (Bullmore et al., 2001; Buzsaki, 2006; Freeman and Zhai, 2009; Linkenkaer-Hansen et al., 2001; Milstein et al., 2009; Monto et al., 2008), but the speed of action potentials (Ward, 2002), the dynamics of neurotransmitter release (Lowen et al., 1997) and human cognition and behaviors (Gilden, 2001; Maylor et al., 2001; Ward, 2002) too manifest scale-free dynamics, which are inexplicable by instrument noise. Moreover, recent work suggested that fluctuations in the signal comprising the low-frequency end of the 1/fβ spectrum, the slow cortical potential (SCP), not only modulate trial-to-trial behavioral performance and the amplitude of higher-frequency activities (Monto et al., 2008; Vanhatalo et al., 2004; for reviews see Birbaumer et al., 1990; He and Raichle, 2009), but also correlate with the fMRI signal (He and Raichle, 2009; He et al., 2008; Khader et al., 2008; Nagai et al., 2004).
Therefore, an understanding of arrhythmic, 1/f-β brain activity seems critical if a full understanding of brain operations is to be achieved. Unfortunately, existing studies on broadband field potentials focusing on arrhythmic, 1/f-β activity remain scarce (Buiatti et al., 2007; Freeman and Zhai, 2009; Manning et al., 2009; Miller et al., 2009b; Onton and Makeig, 2009), and usually characterize only the gross properties of the power spectrum such as the power-law exponent or total variance. Many simulations of scale-free dynamics have been constructed by physicists (e.g., Bak, 1996; de Arcangelis et al., 2006; De Los Rios and Zhang, 1999; Lin and Chen, 2005; Mandelbrot, 1999; Ward and Greenwood, 2007), but it remains to be seen whether these general models also describe the neurophysiological processes giving rise to 1/f-β signals in the brain. Notably, scale-free properties have recently been described in the amplitude and synchronization of oscillatory brain activity (Linkenkaer-Hansen et al., 2001; Stam and de Bruin, 2004), and in the temporal and spatial distributions of negative LFP peaks (Plenz and Thiagarajan, 2007). Yet, these analyses do not directly address the form of 1/f-β activity so prevalent in raw fluctuations of brain field potentials, and their relations to the latter await future investigation.
We investigated the fine temporal structures of arrhythmic, scale-free brain activity by using nested-frequency analysis. Nested frequencies refer to a systematic relationship between the phase of a lower frequency and the amplitude of a higher frequency, and has been described for the phase of theta and amplitude of gamma oscillations (Bragin et al., 1995; Canolty et al., 2006; Lakatos et al., 2005; Tort et al., 2008), and between the phase of delta and sub-delta activity and amplitude of higher frequencies (Lakatos et al., 2008; Monto et al., 2008; Vanhatalo et al., 2004). Here we show that the extent of nested frequencies is much broader than previously conceived, extending beyond the confinement of brain oscillations to being present within arrhythmic brain activity. These results suggest that, contrary to common assumptions, arrhythmic brain activity contains a rich temporal organization. We then provide data showing that the power-law exponent of scale-free brain activity varies across brain regions and is modulated by task performance. Lastly, we compared scale-free brain activity with other scale-free dynamics in nature including earth seismic waves and stock market fluctuations, as well as simulated time series. Each of these scale-free dynamics follows a power-law distribution, but the fine temporal patterns present within them differ across systems, which are likely a manifestation of different underlying generative mechanisms. Together, these results indicate that arrhythmic, scale-free brain activity has an unexplored physiological architecture and intrinsic function.
RESULTS
Power Spectra of Electrical Field Potentials of the Brain
We collected spontaneous electrocorticography (ECoG, i.e., invasive EEG) data from five patients (Patients #1 - #5, Table S1) undergoing surgical treatment for drug-resistant epilepsy, in both quiet wakefulness and slow-wave sleep (SWS, sleep stages 3/4). The length of data collected in each arousal state ranged from 12 to 83 min. In Patient #4, 30 min of rapid-eye-movement (REM) sleep data were also collected. Electrode locations documented by plain X-ray pictures are shown in Fig. 1F. For the details of clinical and data collection information see Table S1.
Figure 1.
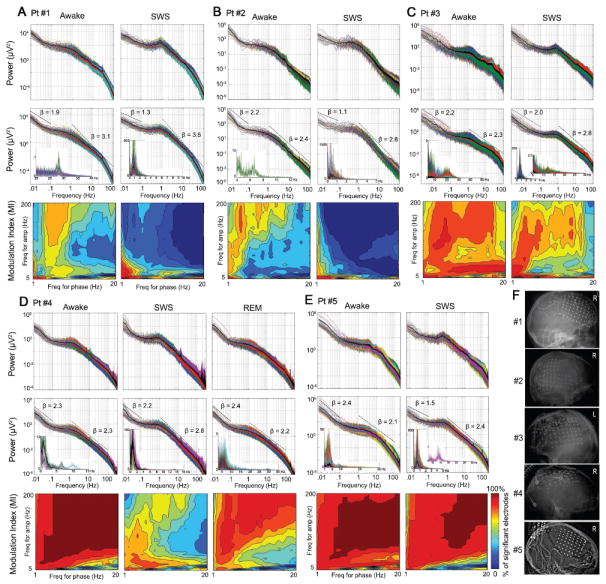
(A-E) Power spectra and nested frequencies in spontaneous ECoG signals recorded from different arousal states in Patients #1-#5. Top: Raw power spectra for all electrodes plotted in log-log plots. Different colors plot different electrodes, the thick black trace plots the average across all electrodes. Middle: The fractal components of the power spectra, extracted by the CGSA method. The thick black trace plots the average across all electrodes. The low-frequency end (<0.1 Hz) and higher-frequency range (1-100 Hz) of the average power spectrum were each fit with a power-law function P(f) ∝ 1/fβ. The obtained exponents β are indicated in the graphs. The insets show the harmonic components extracted by the CGSA method. Results from all or a subset of electrodes are plotted on a linear scale; electrodes with pronounced harmonic activity were selected for presentation. Bottom: The percentage of electrodes with significant phase-amplitude cross-frequency coupling. Phase was extracted from 1-Hz-width bins with center frequencies from 1 to 20 Hz in 1-Hz steps. Amplitude was extracted from 5-Hz-width bins with center frequencies from 5 to 200 Hz in 5-Hz steps. The percentage of electrodes with significant MI Z-score (P < 0.05 after Bonferroni correction) is plotted as color for each frequency pair. (F) Electrode locations documented by plain X-ray pictures for each patient. R: electrodes over right hemisphere; L: electrodes over left hemisphere.
The power spectra of ECoG signals, plotted in log-log coordinates (Fig. 1 A-E, top graphs), roughly followed a straight line, with local peaks corresponding to well-known brain oscillations rising above this line. These oscillations included the slow oscillation (~0.8 Hz) and sleep spindles (~12 Hz) during SWS, the theta (~7-8 Hz), alpha (~10 Hz) and beta (~20 Hz) oscillations in the awake state. Multiple brain oscillations notwithstanding, the vast majority of power in the ECoG signals is accounted for by the power-law distribution representing arrhythmic brain activity.
To estimate the power-law exponent, we first adopted the procedure developed by Yamamoto and Hughson (1991, 1993), coarse-graining spectral analysis (CGSA), to separate the harmonic/oscillatory from the scale-free/fractal components of the ECoG power spectrum. This method takes advantage of the self-affinity property of a scale-free time series, i.e., the statistical distribution of the data remains the same when sampled at different scales (Mandelbrot and Van Ness, 1968), and the fact that this is not true for harmonic time series (for details see Supplementary Experimental Procedures). The fractal and harmonic components of the ECoG power spectrum obtained by the CGSA method for each patient, each arousal state are presented in Fig. 1 A-E (middle graphs). In SWS, harmonic components included peaks at 0.5-1 Hz and 12-14 Hz, representing the slow oscillation (also called “up-and-down states”, UDS) and sleep spindles respectively. In the waking state, the harmonic components included various peaks in the delta, theta, alpha, beta and gamma frequency ranges. In the REM sleep data from Patient #4, the harmonic component included peaks in the theta frequency range and around 30 Hz.
Interestingly, after reducing oscillatory activity, the remaining fractal components of the power spectrum still had a “shoulder” in the frequency range of 0.1-1 Hz. Whether this reflected a true property of arrhythmic brain activity, or alternatively, the remaining presence of the UDS that was unsuccessfully removed by the CGSA method awaits future investigation2. Accordingly, we fit the low-frequency end (<0.1 Hz) and the higher-frequency range (1-100 Hz) respectively with a power-law function: P ∝ f-β, avoiding the “shoulder”. The values of the resultant β exponents are listed in Fig. 1A-E. Averaged across all patients, the low (<0.1 Hz) and high (1-100 Hz) frequency ranges had exponent of 2.2 and 2.44 respectively in the awake state, and 1.6 and 2.87 respectively in SWS. The effect of arousal state on power-law exponent was non-significant (P > 0.5). However, the interaction of arousal state × frequency range was highly significant (P < 0.004); whether this reflected unreduced UDS in the data or a true change in arrhythmic brain activity across waking and SWS requires future investigation. Notably, the exponents we obtained correspond very well with previous reports on the power-law exponent of LFP or ECoG activity (Freeman and Zhai, 2009; Miller et al., 2009a; Milstein et al., 2009).
The Widespread Presence of Nested Frequencies
To investigate temporal structures within spontaneous ECoG signals, we examined nested-frequency patterns in each electrode. For a pair of frequencies, instantaneous phase and amplitude were extracted for the lower and higher frequency respectively. The lower-frequency phase at all samples was sorted into 20 bins, and the concurrent higher-frequency amplitude was averaged within each bin. The resultant curve shows the dependency of the higher-frequency amplitude on lower-frequency phase, and its deviation from a uniform distribution was evaluated using an inverted entropy measure to yield a modulation index (MI) (Tort et al., 2008). The MI was compared with shuffled data to obtain a MI Z-score indexing the strength of cross-frequency phase-amplitude coupling. For details see Supplementary Experimental Procedures.
Cross-frequency phase-amplitude coupling was investigated in a 2-D frequency space: phase was extracted from each 1-Hz-width bin centered at 1, 2 … 20 Hz, and amplitude was extracted from each 5-Hz-width bin centered at 5, 10 … 200 Hz. For each frequency pair, the percentage of electrodes with a significant MI Z-score (P < 0.05 after Bonferroni correction) is plotted as color in Fig. 1 A-E (bottom graphs). During wakefulness, extensive nested frequencies are present in every patient in the majority of electrodes; the extent of nested frequencies decreases during SWS but remains highly robust across wide frequency ranges in Patients #3, #4 & #5. REM sleep data from Patient #4 also shows extensive nested frequencies across the entire frequency spectrum. Such widespread presence of nested frequencies extends beyond the frequency boundaries of rhythmic brain oscillations (see insets in the middle graphs of Fig. 1A-E) and is difficult to reconcile with previous notions conceiving nested frequencies only within the framework of oscillatory brain activities. Instead, it appears that to explain its presence, arrhythmic brain activity must be invoked.
Power-Law Distribution Is Not an Artifact of Averaging
Brain oscillations and “1/f noise” have so far remained two largely separate fields. An important, unresolved question concerns whether they index distinct physiological processes with different underlying mechanisms (e.g., Bullock et al., 2003; Freeman and Zhai, 2009), or alternatively, if “1/f noise” is the result of averaging across time of many different, transient and recurrent oscillations at different frequencies and with different amplitudes (e.g., Buzsaki, 2006).
To investigate this issue, we randomly picked three electrodes (from Patient #3), two with and one without rhythmic oscillations. As shown by the power spectra averaged across the entire awake record (Fig. 2A left), electrode #33 contains oscillations at ~1.5 Hz and ~20 Hz, electrode #43 contains oscillations at 7-8 Hz and ~20 Hz, and electrode #64 contains no periodic oscillations but only arrhythmic, scale-free activity. The above impression from the power spectra is corroborated by visual inspection of the raw ECoG records. Two randomly selected 20-second segments of raw data, which were separated in time by >1 hour are shown in Fig. 2C. The power spectra of these two short data segments (Fig. 2A middle and right) recapitulate the power spectra averaged over the entire 83-min record. The observation that the overall shape of the power spectrum – its power-law distribution and the location of oscillatory peaks – appears to be stable over time was obtained in many electrodes.
Figure 2.

Stability of the 1/fβ power spectrum and nested-frequency patterns. (A) Power spectra from three example electrodes in Patient #3. The left, middle and right panels are from the entire awake record (83 min), and two randomly selected 20-sec segments, respectively. Note the difference in scales between left vs. middle and right graphs. (B) Phase-amplitude cross-frequency coupling for each of the three electrodes computed from the entire awake record. MI Z-score is plotted as color for each frequency pair. Only significant values (P < 0.05 after Bonferroni correction) are shown. (C) The raw data records for the two 20-sec segments. For each segment, 0-10 sec is shown on the top and 10-20 sec shown on the bottom. (D) Nested-frequency patterns for selected frequency pairs in electrode #64. Amplitude of the higher frequencies (5-Hz-width bands centered at 25, 50, 100, 150, 200 Hz) was averaged at different phases of the lower frequencies (1-Hz-width bands centered at 1, 6, 11, 16 Hz). Phase ±π corresponds to the trough (surface negativity), and phase 0 to the peak (surface positivity) of the lower-frequency fluctuation. Nested-frequency patterns from the two 20-sec segments (middle and right) are very similar to that from the entire awake record (left).
These results suggest that the power-law distribution of the ECoG power spectrum does not seem to be an artifact of averaging over time of many independent, periodic oscillations, but rather appears to be the direct result of the presence of arrhythmic, scale-free brain activity. One remaining possibility is that there are hidden rhythmic activities at finer spatial scales than the resolution of ECoG electrodes. However, arrhythmic, scale-free activity is present at every spatial scale in the brain. The power spectrum of spontaneous LFP activity also follows a power-law distribution (Leopold et al., 2003; Milstein et al., 2009) with a power-law exponent close to that of ECoG activity. Further, cortical pyramidal neurons’ spikes are usually nonrhythmic (Ermentrout et al., 2008; Faisal et al., 2008; Freeman and Zhai, 2009; Koch, 1997; Thivierge and Cisek, 2008; but see Maimon and Assad, 2009) and “1/f noise” has been observed in neuronal spike trains (Gisiger, 2001; Gruneis et al., 1989; Takahashi et al., 2004; Yamamoto, 1991) and neurotransmitter release (Lowen et al., 1997).
Stability of Nested Frequencies within Arrhythmic Brain Activity
Next we investigated whether electrodes with only scale-free brain activity but no rhythmic oscillations also contained nested frequencies. Nested frequencies in the above three electrodes were computed in the same 2-D frequency space as shown in Fig. 1A-E (bottom graphs). Significant cross-frequency coupling across wide frequency ranges were found in every electrode (Fig. 2B), including electrode #64, which contained no discernible periodic oscillations.
To examine the stability of nested-frequency patterns within arrhythmic brain activity, we plotted the higher-frequency amplitude averaged at different phases of the lower frequency for selected frequency pairs in electrode #64. Amplitude of 5-Hz-width bands centered at 25, 50, 100, 150, 200 Hz was each averaged at different phases of lower-frequency bands (1-Hz-width) centered at 1, 6, 11, 16 Hz and plotted in Fig. 2D. This analysis was repeated for the entire awake record (Fig. 2D, left) and the two 20-sec segments shown in Fig. 2C (Fig. 2D, middle and right). The nested-frequency patterns from the two short data segments are each similar to the pattern from the entire record, suggesting that the nested frequencies present within arrhythmic brain activity appear to be stable over time. Similar results from a few other representative electrodes in each patient are shown in Fig. S1. Importantly, the pattern of nested frequencies varied across electrodes, even though all of them contained mainly arrhythmic brain activity (Fig. S1).
Nested-Frequency Patterns across Brain Surface
To characterize nested-frequency patterns across electrodes, for the same frequency pairs as in Fig. 2D, we obtained the MI Z-score, which indexes the strength of cross-frequency phase-amplitude coupling, for each of the 259 electrodes from all five patients. The percentage of electrodes with significant cross-frequency phase-amplitude coupling for each frequency pair is listed in Table 1 (the bottom values in each cell). Averaged across the 20 frequency pairs, 85% and 72% electrodes had a significant MI Z-score in wakefulness and SWS respectively.
Table 1.
Percentage of all electrodes (from Patients #1-#5) with significant cross-frequency coupling that preferred lower-frequency phase around phase 0 vs. lower-frequency phase around phase ±π. Electrodes with preferred phase falling in the interval [-0.3 π, 0.3 π) are counted as preferring phase 0; those with preferred phase falling in the interval [0.7π, π) or [-π, -0.7 π) are counted as preferring phase ±π. Only electrodes with a significant MI Z-score were counted.
| Awake | ||||||||
|---|---|---|---|---|---|---|---|---|
| Phase Amplitude |
1 Hz | 6 Hz | 11 Hz | 16 Hz | ||||
| 200 Hz |
|
|
|
|
||||
| 150 Hz |
|
|
|
|
||||
| 100 Hz |
|
|
|
|
||||
| 50 Hz |
|
|
|
|
||||
| 25 Hz |
|
|
|
|
||||
| SWS | ||||||||
|
Phase Amplitude |
1 Hz | 6 Hz | 11 Hz | 16 Hz | ||||
| 200 Hz |
|
|
|
|
||||
| 150 Hz |
|
|
|
|
||||
| 100 Hz |
|
|
|
|
||||
| 50 Hz |
|
|
|
|
||||
| 25 Hz |
|
|
|
|
||||
For each frequency pair, the number of electrodes preferring phase 0 and those preferring phase ±π (both with a significant MI Z-score) were entered into an ANOVA, with arousal state and preferred phase as two factors.
 P < 0.05 for the effect of preferred phase
 P < 0.05 for the effect of preferred phase and the effect of arousal state
 P < 0.05 for the effect of preferred phase, the effect of arousal state, and the interaction of preferred phase × arousal state.
For each electrode and frequency pair we also determined the preferred phase of the lower frequency, which denotes the phase of the lower frequency fluctuation at which the higher frequency has the largest amplitude. Plotting the MI Z-score against preferred phase on an electrode-by-electrode basis for each patient and frequency pair, we found that the preferred phase tends to cluster around 0 and ±π, that is, the peak and trough of the lower-frequency fluctuation respectively (Figs. 3A & S2). For each frequency pair, the percentage of electrodes (across all five patients) with preferred lower-frequency phase around 0 or ±π, and significant cross-frequency coupling, are listed in Table 1.
Figure 3.
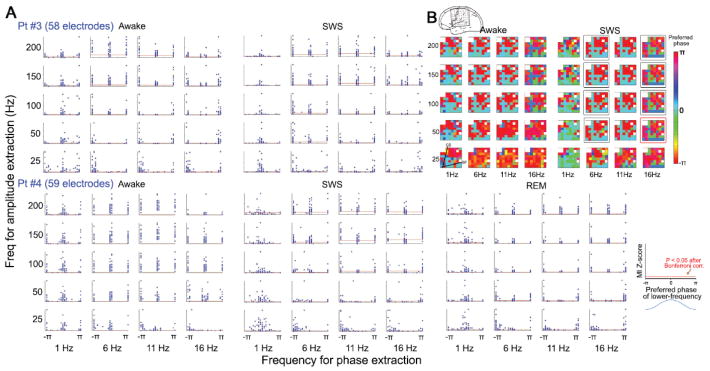
(A) Nested-frequency patterns from two example patients, #3 and #4. Phase was extracted from 1-Hz-width bands centered at 1, 6, 11, and 16 Hz. Amplitude was extracted from 5-Hz-width bands centered at 25, 50, 100, 150, and 200 Hz. For each frequency pair, the subplot shows a scatter-plot of all electrodes, each represented by one dot. The ordinate value plots the cross-frequency coupling strength as indexed by MI Z-score. The red horizontal line indicates significance level (P < 0.05 after Bonferroni correction). The abscissa value plots the preferred phase of the lower frequency, i.e., the phase of the lower-frequency fluctuation at which the amplitude of the higher frequency is largest. (B) For Patient #3, the preferred phase for each frequency pair in (A) and each electrode are plotted as color on a 2-D representation of the 8 × 8 electrode grid. The orientation and location of this grid on the cortical surface is shown in the top diagram. The six white cells in the grid are bad electrodes that have been eliminated from all analyses. The approximate locations of the central sulcus (CS) and Sylvian fissure (SF) are denoted on the bottom left grid. Squares in the right panel mark frequency pairs whose preferred-phase maps remained stable across waking and SWS (indexed by a significant spatial circular correlation; black: P < 0.002; red: P < 0.05, after Bonferroni correction for multiple comparisons).
The above bimodal distribution of preferred phase raises the question of whether the electrodes with preferred phase around 0 and those with preferred phase around ±π situated in different cortical regions. Thus, for each frequency pair, we plotted the preferred phase of the lower frequency as color on a 2-D representation of the electrode grid (Patient #3 in Fig. 3B, Patients #1, 4&5 in Fig. S3). Indeed, electrodes preferring phase 0 and those preferring phase ±π formed largely separate clusters, which to a rough degree followed cortical anatomy such as the location of Sylvian fissure and the central sulcus (marked in Fig. 3B). Moreover, these spatial patterns were relatively stable across arousal states (significant spatial correlations across wakefulness and SWS are marked by squares in Figs. 3B and S3).
It should be noted that the results of this analysis were contributed by both arrhythmic brain activity and periodic brain oscillations, because, unlike in Fig. 2, spontaneous ECoG signals from all electrodes were used. When periodic brain oscillations and arrhythmic brain activity are already mixed in collected data, as is the case for many electrodes in our recordings, there is no a posteriori mathematical means to separate them while preserving their respective biologically-meaningful phase. The influence of brain oscillations on the results in Figs. 3 & S2 can be most clearly seen in 1-Hz-phase modulation of higher frequency amplitudes (the leftmost column in each sub-panel, also see Table 1). During wakefulness, the preferred 1-Hz phase is a bimodal distribution, which clustered around 0 and ±π; however, during SWS it becomes a unimodal distribution with most electrodes having their preferred phase around phase 0. This is in full accordance with known neurophysiology: During SWS, the slow oscillation (i.e., UDS) at around 1 Hz becomes very prominent, which modulates higher frequencies strongly. The surface positive (phase ~0) ECoG activity at ~1 Hz corresponds to the intracellular “up-state”, during which higher-frequency activities are dramatically increased (Vyazovskiy et al., 2009).
Task Modulation of Scale-Free Brain Activity
We tested whether scale-free brain activity has any functional significance by recording ECoG signals during both quiet wakefulness and task performance in Patients #3 & #5 and three additional subjects (#6 - #8, see Table S1). The task included a cued button press condition and a self-paced button press condition. In the cued condition, a visual cue prompted the subject to press a button as soon as they detected the cue, the inter-trial interval varied randomly between 2 and 20 seconds (mean 6.1 sec). In the self-paced condition, the subject was instructed to press the button at their own pace, separating adjacent button presses by a few seconds but avoiding regular rhythms (which could entrain arrhythmic brain activity into oscillations, see, e.g., Elbert et al., 1991; Lakatos et al., 2008). The button press was performed by either the left or right index finger, each corresponding to either the contralateral or ipsilateral hand, depending on which brain hemisphere the electrodes covered.
We searched blindly for electrodes whose power spectrum was significantly altered by task performance. Significant deviation of power-law exponent during task from that during rest was found in 11 electrodes, including four over the hand representation of primary motor cortex, one over lower motor cortex (tongue/face representation), three over premotor area, one over Broca’s area, one over lateral occipital cortex, and one over lateral temporal lobe (Fig. 4 A-C & Fig. S4). All five electrodes over primary motor cortex were confirmed by cortical stimulation as part of patients’ routine clinical care. Compared to rest, the power-law exponent β of all these electrodes decreased during all four trial types (i.e., the slope became “shallower”), suggesting that scale-free brain activity is modulated by task performance. Interestingly, there was no systematic difference between the four trial types. Consistent with a previous report (Miller et al., 2009a), we did not find any significant change of power-law exponent in the higherfrequency range (10-100 Hz) during task performance.
Figure 4.

Task modulation of scale-free brain activity. (A-C) Power-law exponent changes during task performance in electrodes over task-relevant brain areas. Cued: visual-cued button press condition. Selfpaced: self-paced button press condition. LH/RH: the button press was performed by the left or right index finger. Six example electrodes from three patients are shown. Five additional electrodes with significant alteration of the power-law exponent during task performance are shown in Fig. S4. Statistical significance of the difference of power-law exponent between rest and task conditions was assessed by t-tests, with P-values shown in the graphs. In Patient #5, SWS power spectrum (orange) is presented for comparison, but not used for statistical analysis. (D) Emergence of an oscillation from scale-free brain activity during task performance. Results are from electrode #64 in Patient #3, same as electrode #64 in Fig. 2. Left: Power spectra from the spontaneous awake state (black), SWS (orange), and four trial types of the task. An oscillatory peak at ~8 Hz emerges during all four task conditions (blue arrow). Top right: Randomly selected 20-sec raw data record during task. The presence of an 8-Hz oscillation is readily seen (arrows). Bottom right: Nested-frequency patterns for selected frequency pairs during task-performance (averaged across all task blocks), which are very similar to those during the spontaneous awake state (shown in Fig. 2D). The locations of these electrodes are indicated by arrows in the plain X-ray pictures (A&B), reconstructed image from anatomical MR and CT scans (C) and the clinical diagram (D).
In electrode #64 from Patient #3 that contained only scale-free brain activity during the spontaneous waking state (see Fig. 2), we found the emergence of an oscillation at ~8 Hz during task performance in all four trial types (Fig. 4D). This oscillatory activity can be seen in both the power spectrum and raw data records. Nonetheless, the nested-frequency patterns did not change (compare Fig. 4D bottom right graph to Fig. 2D, and see Fig. S5). Since our task contained no rhythmic structure, the emergence of this 8-Hz oscillation was not a result of entrainment by external stimuli, but reflected intrinsic properties of the underlying neuronal network.
Variation of Power-Law Exponent across Brain Regions Assessed by fMRI
Since previous studies have demonstrated that the power spectrum of spontaneous fMRI signals also follows a power-law distribution (Bullmore et al., 2001; Fox et al., 2007), we investigated the scale-free dynamics in the fMRI signal and its power-law exponent across brain regions, utilizing the whole-brain coverage provided by fMRI. Resting-state fMRI data was acquired in 17 consenting healthy volunteers in a 3T scanner. A set of 31 regions of interest (ROIs) were obtained from previous studies by the authors or published articles (see Table S2), among which there were 10 pairs of homologous brain regions. Other than three ROIs located outside the neocortex – hippocampus, cerebellum and thalamus – the remaining regions resided in five known brain networks (attention, default, motor, saliency, and visual) (Fox and Raichle, 2007).
The normalized power spectrum (i.e., power spectral density, with total power/variance = 1) was computed for the fMRI signal time course from each ROI for each fMRI run, then averaged across runs and across subjects. Power spectra from homologous brain regions were averaged together, yielding one average power spectrum for each of 21 brain regions (Fig. 5A). The power spectra of spontaneous fMRI signals roughly followed a straight line when plotted in loglog coordinates (Fig. 5A), suggesting that spontaneous fMRI signals are also scale-free. The power-law exponents obtained by a least squares fit are listed in Table S2, with a mean of 0.69 across brain regions, which differed significantly from the power-law exponent of ECoG signals (mean 2.2 for <0.1 Hz range in wakefulness) (P < 10-6). The origin of this difference between ECoG and fMRI signal power-law exponents warrants future investigation.
Figure 5.

Scale-free dynamics in spontaneous fMRI signals. Power spectrum of spontaneous fMRI signal was computed for 31 brain regions (10 pairs of homologous regions were each averaged together, for details see Table S2). (A) Normalized power spectrum (total power/variance = 1) for each brain region is plotted in a log-log plot. Line colors are grouped by cortical networks. Purple: default network; blue: attention network; orange: visual network; green: motor network; cyan: saliency network; red: non-neocortical group. (B) Each power spectrum in (A) was fit with a power-law function P(f) ∝1/fβ. The exponent β was entered into an ANOVA with brain network as the main factor. Error bars denote S.E.M. The effect of network was highly significant (F5,15 = 5.05, P = 0.006). The two regions belonging to the saliency network, right frontoinsular cortex (R FI) and dorsal anterior cingulate cortex (dACC), were plotted separately for visualization, given the wide difference between their exponents. The non-neocortical group included the cerebellum, hippocampus and thalamus. Using Tukey/Kramer post-hoc test, significant differences were found between the default network and non-neocortical regions, and between the visual and non-neocortical regions. (C) Total fMRI signal variance and power-law exponent were correlated across brain regions.
The power-law exponent of the fMRI signal was found to vary across brain networks. The visual regions, default network and dorsal anterior cingulate cortex (dACC) had the steepest power spectra, characterized by the largest power-law exponent β. On the other end, the cerebellum and hippocampus had the shallowest power spectra, characterized by the smallest power-law exponent. The motor and attention network regions were intermediate. An ANOVA suggested that the effect of brain network on power-law exponents was highly significant (F5,15 = 5.05, P = 0.006). By contrast, when the total variance of the fMRI signal (listed in Table S2 for each brain region) instead of the power-law exponent was entered into the ANOVA, no significant network effect was found (P = 0.3). Nonetheless, there was a moderate but significant correlation between fMRI signal variance and power-law exponent across brain regions (Fig. 5C). Of note, the small power-law exponents of the cerebellum and hippocampus reflected a proportionally smaller amount of low-frequency activity as compared to the neocortex, consistent with previous neurophysiological observations and considerations of their respective anatomical structures (Bullock and Basar, 1988; He and Raichle, 2009).
Control Recordings and Analyses
Because fluctuations of resistivity in electronic conducting materials can also exhibit “1/fnoise” (Weissman, 1988), it is important to demonstrate that our data were not contributed by instrument noise. To address this, we conducted a dummy ECoG recording in a standard epilepsy in-patient monitoring room without the presence of a patient. The power spectrum of the dummy recording (duration 46 min) is plotted in log-log coordinates in Fig. S6, together with the average ECoG power spectrum from a patient. The magnitude of the dummy recording is far below that of ECoG signals recorded from the patient. Further, the power spectrum of the dummy recording does not follow a power-law distribution. Fitting a power-law function P ∝ 1/fβ to the low (< 0.1 Hz) and high (1-100 Hz) frequency range nonetheless yielded exponent of 0.6 and 1 respectively, which are significantly different from power-law exponents of brain ECoG signals (P < 0.0001 for both frequency ranges). Moreover, no significant nested frequencies were observed in the dummy recording time series.
Our fMRI data were previously published in Fox et al. (2007). In this study the authors acquired fMRI signals from a water phantom in the same scanner, the power spectrum of which was close to white noise (see Fig. S4 in Fox et al., 2007), which differs significantly from the power spectrum of fMRI signals recorded from the brain (see Fig. 5A).
A recent study showed that microsaccades could produce artifactual broadband activity in the EEG signal (Yuval-Greenberg et al., 2008). Although it was suggested that these concerns do not apply to ECoG recordings (Yuval-Greenberg et al., 2008), we confirmed that the current results were not contributed by muscle artifacts related to eye movements by plotting the strength of cross-frequency coupling across the cortical surface (Fig. S7). All ECoG results presented in this paper were obtained under the common-mean-reference montage, therefore artifacts related to eye movements should be most pronounced in electrodes closest to the eyes (Melloni et al., 2009; Yuval-Greenberg et al., 2008). The results in Fig. S7 confirmed that significant nested frequencies were present across wide cortical regions and did not exhibit an anterior-posterior gradient.
Comparison with Other Scale-Free Dynamics in Nature
Thus far we have shown that arrhythmic, scale-free brain activity contains rich temporal structures and is behaviorally relevant. However, since scale-free dynamics are ubiquitous in nature, one potentially revealing question is whether other scale-free dynamics also contain temporal structures and functional meanings and whether their structures are similar to or different from those observed in brain activity. While it is up to economists and physicists to decide whether scale-free dynamics in market fluctuations contributed to the recent economic crash (Cho, 2009) or if similar dynamics can initiate earthquakes, we merely investigated the potential temporal structures present in these scale-free dynamics and compared them with those in scale-free brain activity.
We conducted nested-frequency analysis on spontaneous earth seismic waves (collected over 4 months) and fluctuations of the Dow-Jones Industrial Average Index (collected over 80 years). Both earth seismic waves and stock market fluctuations followed a power-law distribution in their temporal power spectrum (Fig. 6A). Moreover, the power-law exponent of both data types (1.99 for seismic waves and 1.95 for stock market) was close to that of the brain ECoG activity (mean 2.2 during wakefulness for <0.1 Hz range).
Figure 6.

Scale-free dynamics in earth seismic waves (left column) and stock market fluctuations (right column). (A) Power spectra plotted in log-log plots. For seismic data, frequency is in Hz (cycle/sec). For stock market data, frequency is in cycle/day. The power-law exponent β for seismic and stock market data was 1.99 and 1.95 respectively. (B) Top: Phase-amplitude cross-frequency coupling assessed by MI Z-score, plotted as color in the 2-D frequency space. Only significant values (P < 0.05 after Bonferroni correction) are shown. Bottom: Example nested-frequency patterns for selected frequency pairs. Amplitude of the higher frequency was averaged at different phases of the lower frequency and plotted.
Like arrhythmic brain activity, both earth seismic waves and stock market fluctuations contained extensive nested frequencies (Fig. 6B). However, the exact patterns of nested frequencies in these signals differed from those in brain activity. For example, a bimodal nested-frequency distribution with two preferred phases is seldom seen in the ECoG signals (<10% of all electrodes), but was prominent in earth seismic waves. This bimodal distribution in earth seismic waves might be due to different generators in the earth propagating to the same surface location; by contrast, the rarity of a bimodal nested-frequency pattern in the ECoG signal might imply a more homogeneous source of generators. The observation that nested frequencies are prominent in these natural and economic scale-free dynamics reinforces the conclusion that the extensive nested frequencies observed in ECoG signals were contributed primarily by scale-free brain activity and not by periodic brain oscillations.
Simulations of Scale-Free Dynamics
Finally, to better understand the relationship between nested frequencies and scale-free dynamics, we constructed several simulated scale-free time series and examined whether they contained nested frequencies. All simulated time series were analyzed in a similar manner as the ECoG data for temporal power spectrum and nested frequencies.
First, as a control analysis, we performed nested-frequency analysis on a Gaussian-distributed white-noise time series (Fig. 7A, left). This time series does not contain any nested frequencies (Fig. 7A, right). Second, we constructed a scale-free time series by filtering this white-noise time series in the frequency domain to yield a power-law distribution of P ∝ 1/fβ (β = 1.8) while maintaining the random phase of the white-noise time series. This spectrally-generated scale-free time series with a power-law exponent close to that of brain ECoG activity also did not contain any nested frequencies (Fig. 7B).
Figure 7.

Power spectra and nested-frequency patterns of simulated scale-free dynamics. All simulated time series were set to 512-Hz sampling rate, and subjected to the same analyses as the ECoG data. In each panel, the left graph shows the power spectrum plotted in log-log scales; the right graph shows cross-frequency coupling strength (MI Z-score) as color in the 2-D frequency space (color range from Z = 3.84 to Z = 20, all P < 0.05 after Bonferroni correction). (A) A white-noise time series following Gaussian distribution from a pseudorandom number generator (mean = 0, variance = 10). The inset in the left graph shows the distribution of the values in the time series. No significant cross-frequency coupling was found. This white-noise time series was used as input to models in (B)-(E). (B) Spectrally generated scale-free time series. The white-noise time series in (A) was filtered in the frequency domain by P(f) ∝ 1/fβ (β = 1.8), without altering the phase, and then inverse-Fourier transformed. This time series does not have nested frequencies. (C) A first-order autoregressive (AR-1) process: x(t) = φ x(t-1) + ε(t), where φ = 0.9 and ε(t) is the same white-noise time series as in (A). (D) Aggregate of three AR-1 processes , where φ1 = 0.1, φ2 = 0.5, φ3 = 0.9, and εi(t) is the same white-noise time series as in (A). Neither C nor D has significant nested frequencies. (E) A random-walk model: x(t) = x(t-1) + ε(t), where ε(t) is the same white-noise input as above. This random-walk time series does have significant nested frequencies across many frequency pairs. The inset shows, for one example frequency pair, the higher-frequency amplitude averaged at different phases of the lower frequency. (F) A random-walk model: x(t) = x(t-1) + ε(t), where ε(t) is a white-noise time series following Gaussian distribution generated using random numbers from physical source (atmospheric noise). This random-walk model does not have nested frequencies.
Next, because the power-law exponent of the ECoG signals was close to 2, which is typical of a random-walk process (i.e., Brownian motion), we constructed a random-walk model by summing over a white noise time series: x(t) = x(t -1) + ε(t), where ε(t) is the same white noise time series as in Fig. 7A. To our surprise, this random-walk process contained statistically significant nested frequencies (Fig. 7E).
We then added a single parameter to the above random-walk model to change it into a first-order autoregressive (AR-1) process: x(t) = 0.9 x(t-1) + ε(t). The addition of this single parameter eliminated nested-frequency patterns (Fig. 7C). Despite the seemingly small change in the model, an important difference between this AR-1 process and the random-walk process in Fig. 7E is that the random-walk process has long-range temporal dependence (also called “long memory”) whereas the AR-1 process does not.
Next, we constructed a model of an aggregate of AR-1 processes (Fig. 7D). The approach of aggregating a few AR-1 processes to model scale-free dynamics (in a restricted frequency range) has been used extensively in economics (Erland and Greenwood, 2007; Granger, 1980), and has been applied with considerable success to modeling the power-law distribution of psychological data, such as the fluctuations of reaction times in a decision making task (Wagenmakers et al., 2004; Ward, 2002). Contrary to our initial conjecture, such a model did not contain any significant nested frequencies (Fig. 7D). Importantly, although a mixture of AR-1 processes could produce the appearance of “1/f noise”, such dynamics do not have genuine long-range temporal dependence that is present in a random-walk process (Wagenmakers et al., 2004).
It might be counterintuitive that a random-walk process contained structures. One possibility is that this is because of the higher-order statistical regularities present in the arithmetic pseudorandom number generator used for generating the white noise input, which are invisible in most applications but produce interesting patterns under the sensitive nested-frequency analysis and when the modeled process contains long memory. To verify this conjecture, we obtained true random numbers3 from physical source (atmospheric noise, www.random.org). These uniformly-distributed random numbers were transformed into a Gaussian-distributed random number series4, and used as the input ε(t) to the random-walk model x(t) = x(t-1) + ε(t). The resultant random-walk time series, with a 1/f2 power spectrum, did not have any nested frequencies (Fig. 7F), confirming the foregoing conjecture that the nested frequencies in Fig. 7E were a manifestation of the higher-order statistical regularities present in the pseudorandom number generator.
The above simulations suggest that the combination of even very weak structures in the underlying generative process and long-range temporal dependence are sufficient to produce nested frequencies in scale-free dynamics. However, we caution that the class of linear models constructed here constitutes only a subset of all models that can give rise to scale-free dynamics (for reviews see Bak, 1996; Frank, 2009; Mandelbrot, 1999; Ward and Greenwood, 2007; Weissman, 1988). It would be beyond the scope of the present paper to exhaustively investigate these models, but the current results should encourage future theoretical and modeling work to further explore the temporal structures of scale-free dynamics generated by different mechanisms.
DISCUSSION
In summary, we have shown that, contrary to common assumptions, arrhythmic, scale-free brain activity, which makes up a significant portion of the spontaneous electrical field potentials recorded from the brain, contains a rich temporal organization with the phase of lower frequencies modulating the amplitude of higher frequencies in an upward progression across the frequency spectrum. We further show that the power-law exponent of scale-free brain activity is modulated by task performance in a brain network-specific fashion, suggesting functional significance for this activity. Spontaneous fMRI signals are also scale-free, and its power-law exponent varies across brain regions, being largest in visual and default-network regions and smallest in cerebellum and hippocampus. Other scale-free dynamics in nature, such as earth seismic waves and stock market fluctuations, also contain extensive nested frequencies, whose exact patterns differ from those of brain activity. Hence, it appears that different mechanisms in a variety of systems can give rise to scale-free dynamics (Frank, 2009), but the fine temporal structures in these dynamics differ across systems, providing clues toward understanding the different underlying generative mechanisms (Fig. 8). These results suggest that investigations on scale-free dynamics should go beyond characterizing the gross 1/fβ power spectrum, and aim at revealing their fine spatiotemporal organization and functional significance.
Figure 8.

A general picture emerging from the present results. Different mechanisms in a variety of systems – including the human brain, earth seismic activity, stock market fluctuations, and simulated time series – can all give rise to scale-free activity exhibiting a 1/fβ power spectrum, but these different dynamics have different nested-frequency patterns. Hence, different nested-frequency patterns might be indicative of different underlying generative mechanisms, even when the gross power spectrum is similar.
The Interpretation of Nested Frequencies in Scale-Free Dynamics
Whereas the interpretation of nested brain oscillations is relatively straightforward (Jensen and Colgin, 2007; Schroeder and Lakatos, 2009), that of nested frequencies in arrhythmic brain activity is less intuitive. In general, nested frequencies in scale-free dynamics also means that at a particular phase of the lower-frequency fluctuation, such as its trough or peak, the amount of higher-frequency activity increases. For example, the trough of surface-recorded slow cortical potentials (SCPs), which constitute the low-frequency end of the 1/fβ power spectrum (He and Raichle, 2009; Monto et al., 2008), is associated with increased cortical excitability and increased amount of higher-frequency activities (Birbaumer et al., 1990; He and Raichle, 2009; Rockstroh et al., 1989; Vanhatalo et al., 2004). This is in line with comments on “1/f noise” in the physics field suggesting that perturbations at long wavelength cause energy dissipations at all length scales (Bak et al., 1987). Furthermore, the non-random distribution of preferred lowerfrequency phase in ECoG activity, which clustered around phase 0 and ±π, is indicative of specific underlying neurobiological mechanisms.
Nonetheless, as pointed out by Kramer et al. (2008), complex waveforms such as edges or triangular waves could also produce significant results in nested-frequency analysis. While artifacts in EEG/ECoG recordings can certainly create sharp edges, we emphasize that an artifact-free ECoG record (such as electrode #64 in Fig. 2C) is also full of complex waveforms that are non-sinusoidal, indeed waveforms that make up scale-free brain activity. These complex waveforms produced by the brain should not be considered artifacts or noise simply because they are non-oscillatory; their functional meanings deserve and demand future investigation. Our view is similar to that of Bullock et al. (2003), who suggested that “the wide-band, apparently stochastic background activity in the EEG may in part consist of structured events or sequences, as in speech or music”, and that “one is compelled to presume that the power spectrum is an inadequate descriptor, as it would be for speech or music”. We speculate that scale-free brain activity most likely plays an important role in the brain’s operation, and an important goal for future work is to crack the code contained therein. We would not be surprised if new mathematical tools will need to be developed before this goal is within reach. The present study, by showing that across different systems a similar 1/fβ power spectrum can mask unique nested-frequency patterns specific to a system, constitutes an initial, modest step toward this goal.
Linkage to Previous Work
This study follows from a recent line of research emphasizing the physiological significance of broadband LFP, EEG and ECoG activity (Belitski et al., 2008; Bressler et al., 1993; Henrie and Shapley, 2005; Manning et al., 2009; Miller et al., 2009a; Miller et al., 2009b; Montemurro et al., 2008; Onton and Makeig, 2009; Siegel and Konig, 2003; Young et al., 1992). In light of the present results, broadband phenomena could (at least in many cases) be re-interpreted as changes in arrhythmic, scale-free brain activity, which are only sometimes accompanied by brain oscillations (see, e.g., Fig. 4D herein and Henrie and Shapley, 2005; Siegel and Konig, 2003). The recently developed information-theoretic approach may be a promising tool for discerning the functional significance of broadband brain activity (Belitski et al., 2008; Montemurro et al., 2008; Panzeri et al., 2010).
Miller et al. (2009a) described an overall shift of power spectrum in >25 Hz range during a hand motor task, without any significant change in the power-law exponent. The conservation of the power-law exponent in the higher-frequency range is consistent with our finding (Figs. 4 & S4). By contrast, we did not find any overall increase of power in this frequency range. This is likely because we used a widely spaced task paradigm that is much less intensive than the paradigms used in Miller et al. (2009a) and other previous studies showing broadband power increase (e.g., Belitski et al., 2008; Henrie and Shapley, 2005; Manning et al., 2009; Siegel and Konig, 2003; Young et al., 1992). Our paradigm, especially the “cued” condition, is similar to a vigilance task, during which the low-frequency power/variance is reduced (Schroeder and Lakatos, 2009), which accounts for the decrease of power-law exponent that we observed (Figs. 4 & S4). Importantly, this does not mean that the SCP in this frequency range is suppressed. On the contrary, in such tasks, a negative shift of the SCP is expected to develop in activated brain regions, including the “Bereitschaft potential” in the motor cortex and the “contingent negative variation” in the anterior cingulate cortex, corresponding to motor performance and anticipatory attention respectively (Kornhuber and Deecke, 1965; Walter et al., 1964). Similar negative SCP shift can occur in any activated brain region with depolarization of superficial layers (He and Raichle, 2009). This negative SCP shift might be accompanied by a decrease of the fluctuation around the mean, giving rise to the decreased amount of power in the low-frequency range and thus the decreased power-law exponent.
Lastly, the relationship between scale-free brain activity and neuronal avalanches (Petermann et al., 2009) warrants future investigation. In line with our proposal that merely characterizing the power spectrum is insufficient for investigating scale-free dynamics and one has to dig deeper in search for the fine spatiotemporal structures (Fig. 8), these authors stress that a 1/fβ (β ≈ 2) power spectrum is not sufficient for the emergence of neuronal avalanches. Because neuronal avalanches consist of negative peaks of neural field potentials, and the raw waveform of field potentials is the scale-free brain activity giving rise to the 1/fβ power spectrum, a relationship between neuronal avalanches and scale-free brain activity is not only conceivable but indeed seems plausible. Since neuronal avalanches are specific to superficial layers of the cortex (Stewart and Plenz, 2006), a first step might be to investigate whether the 1/fβ power spectrum has any heterogeneity across cortical layers. Surprisingly, we are not aware of any published record on this, and urge such a systematic investigation, which would not only shed light onto the potential relationship between scale-free brain activity and neuronal avalanches, but would also be informative toward the mechanisms underlying scale-free brain activity itself.
The Genesis of Scale-Free Brain Activity
The power-law distribution is a common attractor distribution that can emerge out of many different generative mechanisms (Frank, 2009), and a variety of models have been built to simulate scale-free dynamics. Here we focus on potential neurobiological mechanisms that might underlie scale-free brain field potentials. One obvious candidate is the 1/fβ noise present in neurotransmitter release (Lowen et al., 1997) and neuronal spike trains (Gisiger, 2001; Gruneis et al., 1989; Takahashi et al., 2004; Yamamoto, 1991). However, since these phenomena remain isolated observations, they might not be sufficient to account for the ubiquitous scale-free dynamics in EEG or LFP recordings, and a brain-network perspective will likely also be important.
Notably, functional brain networks extracted from voxel-by-voxel spontaneous fMRI signal correlations have a connectivity distribution that follows power-law scaling with an exponent close to 2, suggesting a scale-free network topology (Eguiluz et al., 2005; van den Heuvel et al., 2008). Furthermore, the geometry of axonal and dendritic trees exhibits self-similarity and scale-invariance properties (Bok, 1959; Freeman, 2007), and simulations show that if axon diameter is dictated by the need to transport materials to the synaptic terminals they would be expected to follow a power-law distribution with an exponent of 2 (Chklovskii and Stepanyants, 2003). While an important future direction in complexity science concerns the bridging of complex networks with complex dynamics (Barabasi, 2009) and the relation between scale-free and small-world networks remains an area of active research (Bullmore and Sporns, 2009), we here tentatively propose that scale-free brain field potentials could be produced by Poisson-like spike trains propagating through scale-free brain networks composed of heterogeneous excitatory neurons, and that the addition of inhibitory neurons introduces a time constant to the network and thus produces periodic brain oscillations added to the scale-free brain activity (another mechanism of producing oscillations is via cellular pacemakers). In line with recent neurophysiological observations (Logothetis et al., 2007), this mechanism does not involve frequency-dependent cortical tissue filtering of field potentials. While our proposal remains to be tested explicitly, it is consistent with recent results from optogenetic manipulations showing that activation of fast-spiking interneurons selectively amplifies gamma oscillations, whereas activation of pyramidal neurons amplifies lower frequencies, the profile of which resembled 1/fβ power spectrum (see Fig. 3d in Cardin et al., 2009). This proposal is also consistent with recent simulations of brain networks (Freeman and Zhai, 2009; Thivierge and Cisek, 2008). In Freeman and Zhai (2009), Poisson-like spike trains were convolved with an impulse response function representing dendritic response and summed, the result of which was scale-free dynamics similar to that recorded by ECoG; the addition of inhibitory neurons introduced narrow-band oscillations that appeared as local peaks rising above the 1/fβ distribution in the power spectrum. Similarly, in Thivierge and Cisek (2008), arrhythmic network spikes were shown to be a direct result of heterogeneity among modeled pyramidal neurons, and the addition of inhibitory pathways introduced higher-frequency activities. This model also showed that global synchronization can emerge out of arrhythmic neuronal activity and that neuronal spikes have long memory – a hallmark of scale-free dynamics.
An influential model of “1/f noise” is the self-organized criticality (SOC) theory (Bak, 1996; Bak et al., 1987), which has been applied extensively to simulate brain networks (Shin and Kim, 2006), neuronal avalanches and “1/f noise” (de Arcangelis et al., 2006; Levina et al., 2007; Lin and Chen, 2005). Although the SOC theory might be more suited to describe neuronal avalanches (Petermann et al., 2009), in our view, convincing evidence suggesting that it is the underlying mechanism giving rise to the 1/fβ activity in raw EEG/LFP activity is still lacking. For example, the SOC theory emphasizes the power-law exponent being close to 1, whereas the power-law exponent of empirical electrophysiological recordings is usually close to 2 (see Fig. 1 herein and Freeman and Zhai, 2009; Miller et al., 2009a; Milstein et al., 2009). Nonetheless, recent extensions of the SOC theory to include a broader range of power-law exponents (De Los Rios and Zhang, 1999) might aid in expanding its explanatory power.
Implications for Psychology and Cognitive Sciences
Scale-free dynamics are widely present in the fluctuations of human cognitive and behavioral performance (Gilden, 2001) and even flight behaviors of Drosophila (Maye et al., 2007). Because the brain evolved through organisms’ struggles in coping with the external world and its main function is to proactively act upon the world through its sense and motor organs for the sake of the organism’s survival, it is hardly surprising that the statistical properties of the brain’s dynamics reflect the statistical properties of the environment and the universally present scaleinvariance thereof; and in turn it is hardly surprising that the cognition and behavior as well as music produced by the human brain follow the same statistical properties. Indeed, several well established psychophysical laws applicable across domains and species, including Weber’s law, can be derived simply from a scale-invariance principle (Buzsaki, 2006; Chater and Brown, 1999). In line with our results showing that the power-law exponent decreased during task performance in activated brain regions, it was found that the slope of the 1/fβ power spectrum in reaction time fluctuations varied parametrically with task difficulty, being steepest for easiest tasks and progressively shallower as task difficulty increased (Ward, 2002). Lastly, given that the power-law exponent of spontaneous ECoG signals is close to 2, it is of interest to note that the power spectra of some cartoons are approximately 1/f1, whereas those of realistic paintings and photographs are close to 1/f2, and impressionist paintings have spectra somewhere in between (Balboa and Grzywacz, 2003; Ward, 2002).
Conclusions
We have demonstrated a fine temporal structure and functional significance of arrhythmic, scalefree brain activity. These results should motivate further research into this hitherto elusive form of brain activity that resides behind the mask of the universal 1/fβ power spectrum observed across nature, and encourage future empirical and theoretical work to connect scale-free brain activity with the mainstream of electrophysiological brain research including brain oscillations, event-related potentials, and intrinsic network activity, and further explore its implications for cognitive psychology and brain disorders.
EXPERIMENTAL PROCEDURES
ECoG Data Collection and Power Spectral Calculation
Eight patients undergoing surgical treatment for intractable epilepsy participated in the study. To localize epileptogenic zones, patients underwent a craniotomy for subdural placement of electrode grids and strips followed by 1-2 weeks of continuous video and ECoG monitoring. The placement of electrodes and the duration of monitoring were determined solely by clinical considerations. All patients gave informed consent. ECoG signals were split and sent to both the clinical EEG system and a research EEG system (SynAmp2 RT, Neuroscan, DC-coupled recording). All data in the present study were from the research amplifier. For details on patient and data collection information see Supplementary Experimental Procedures and Supplementary Table 1.
fMRI Data Collection and Analyses
Resting-state fMRI data (with visual fixation) were collected from 17 normal healthy volunteers on a 3T Siemens Allegra MR scanner. Each subject completed 4 fMRI runs, each run lasting 7 min. Standard fMRI data pre-processing procedure was used. The normalized power spectra were derived from the lagged auto-correlation functions using a Bartlett smoothing procedure. For details see Supplementary Experimental Procedures.
Earth Seismic Wave and Stock Market Data Collection
Continuous natural seismic wave data (sampling rate 100 Hz) were collected by University of Nevada, Reno seismic network. The historical daily prices of Dow-Jones Industrial Average index from Oct 1, 1929 to Apr 9, 2009 were downloaded from Yahoo Finance website.
Nested-Frequency Analysis
To assess cross-frequency phase-amplitude coupling, an inverted entropy measure was used to yield a modulation index (MI), following Tort et al. (2008). The MI was then compared with shuffled data to obtain a Z-score measurement of cross-frequency coupling strength (MI Z-score). For details on the computation of the MI and the shuffling procedure see Supplementary Experimental Procedures.
Supplementary Material
Acknowledgments
We thank Bi Lihua for guidance on seismology, Eric Smith and David Krakauer for perspectives from complexity science. We thank Christoph Kayser, Olaf Sporns, Tim Holy, and two anonymous reviewers for comments on an earlier draft of the manuscript, Steve Bressler, Stanislas Dehaene, Mark McAvoy, J. M. Palva, Dietmar Plenz, and Steve Smith for helpful discussions. We thank our clinical colleagues, Matt Smyth, Eric Leuthardt and Ed Hogan for facilitating this study and the patients for participating. This research was supported by NIH grant 06833.
Footnotes
Throughout this article, we use “delta”, “theta”, “alpha”, “beta”, and “gamma” to denote their respective frequency ranges, applied to both periodic oscillations and arrhythmic brain activity. Although the word “oscillation” has often been used to refer to band-pass filtered arrhythmic brain activity, we herein use it exclusively to refer to periodic, rhythmic brain activities before artificial filtering.
Recent studies suggest that the “up-and-down states” (UDS) can also occur during wakefulness when quietly resting or when sleep pressure increases (Petersen et al., 2003; Vyazovskiy et al., 2009). For discussions on why UDS is different from SCP see Supplementary Note 3 in He et al. (2008). Moreover, in the current context, the surface positivity of EEG/ECoG slow waves (~0.8 Hz) corresponds to intracellular up-state and thus increased cortical excitability (Cash et al., 2009 and see Nested-Frequency Patterns across Brain Surface); whereas the surface negativity of EEG/ECoG SCP corresponds to increased depolarization at apical dendrites and thus increased cortical excitability (He and Raichle 2009).
It is theoretically impossible to prove that a random number generator is truly random, however, random numbers from trustable physical sources are generally much more random than arithmetic pseudorandom numbers, see www.random.org for further discussion.
The generation of Brownian random walks requires random number inputs to follow a Gaussian distribution.
Publisher's Disclaimer: This is a PDF file of an unedited manuscript that has been accepted for publication. As a service to our customers we are providing this early version of the manuscript. The manuscript will undergo copyediting, typesetting, and review of the resulting proof before it is published in its final citable form. Please note that during the production process errors may be discovered which could affect the content, and all legal disclaimers that apply to the journal pertain.
References
- Bak P. How nature works. New York: Springer; 1996. [Google Scholar]
- Bak P, Tang C, Wiesenfeld K. Self-organized criticality: An explanation of the 1/f noise. Phys Rev Lett. 1987;59:381–384. doi: 10.1103/PhysRevLett.59.381. [DOI] [PubMed] [Google Scholar]
- Balboa RM, Grzywacz NM. Power spectra and distribution of contrasts of natural images from different habitats. Vision Res. 2003;43:2527–2537. doi: 10.1016/s0042-6989(03)00471-1. [DOI] [PubMed] [Google Scholar]
- Barabasi AL. Scale-free networks: a decade and beyond. Science. 2009;325:412–413. doi: 10.1126/science.1173299. [DOI] [PubMed] [Google Scholar]
- Belitski A, Gretton A, Magri C, Murayama Y, Montemurro MA, Logothetis NK, Panzeri S. Low-frequency local field potentials and spikes in primary visual cortex convey independent visual information. J Neurosci. 2008;28:5696–5709. doi: 10.1523/JNEUROSCI.0009-08.2008. [DOI] [PMC free article] [PubMed] [Google Scholar]
- Berger H. Uber das Elektroenkephalogramm des Menschen. Arch Psyhiatr Nervenkr. 1929;87:527–570. [Google Scholar]
- Birbaumer N, Elbert T, Canavan AG, Rockstroh B. Slow potentials of the cerebral cortex and behavior. Physiol Rev. 1990;70:1–41. doi: 10.1152/physrev.1990.70.1.1. [DOI] [PubMed] [Google Scholar]
- Bok ST. Histonomy of the Cerebral Cortex. Amsterdam: Elsevier; 1959. [Google Scholar]
- Bragin A, Jando G, Nadasdy Z, Hetke J, Wise K, Buzsaki G. Gamma (40-100 Hz) oscillation in the hippocampus of the behaving rat. J Neurosci. 1995;15:47–60. doi: 10.1523/JNEUROSCI.15-01-00047.1995. [DOI] [PMC free article] [PubMed] [Google Scholar]
- Bressler SL, Coppola R, Nakamura R. Episodic multiregional cortical coherence at multiple frequencies during visual task performance. Nature. 1993;366:153–156. doi: 10.1038/366153a0. [DOI] [PubMed] [Google Scholar]
- Buiatti M, Papo D, Baudonniere PM, van Vreeswijk C. Feedback modulates the temporal scale-free dynamics of brain electrical activity in a hypothesis testing task. Neuroscience. 2007;146:1400–1412. doi: 10.1016/j.neuroscience.2007.02.048. [DOI] [PubMed] [Google Scholar]
- Bullmore E, Long C, Suckling J, Fadili J, Calvert G, Zelaya F, Carpenter TA, Brammer M. Colored noise and computational inference in neurophysiological (fMRI) time series analysis: resampling methods in time and wavelet domains. Hum Brain Mapp. 2001;12:61–78. doi: 10.1002/1097-0193(200102)12:2<61::AID-HBM1004>3.0.CO;2-W. [DOI] [PMC free article] [PubMed] [Google Scholar]
- Bullmore E, Sporns O. Complex brain networks: graph theoretical analysis of structural and functional systems. Nat Rev Neurosci. 2009;10:186–198. doi: 10.1038/nrn2575. [DOI] [PubMed] [Google Scholar]
- Bullock TH, Basar E. Comparison of ongoing compound field potentials in the brains of invertebrates and vertebrates. Brain Res. 1988;472:57–75. doi: 10.1016/0165-0173(88)90005-7. [DOI] [PubMed] [Google Scholar]
- Bullock TH, McClune MC, Achimowicz JZ, Iragui-Madoz VJ, Duckrow RB, Spencer SS. Temporal fluctuations in coherence of brain waves. Proc Natl Acad Sci U S A. 1995;92:11568–11572. doi: 10.1073/pnas.92.25.11568. [DOI] [PMC free article] [PubMed] [Google Scholar]
- Bullock TH, McClune MC, Enright JT. Are the electroencephalograms mainly rhythmic? Assessment of periodicity in wide-band time series. Neuroscience. 2003;121:233–252. doi: 10.1016/s0306-4522(03)00208-2. [DOI] [PubMed] [Google Scholar]
- Buzsaki G. Rhythms of the Brain. New York, NY: Oxford University Press; 2006. pp. 119–135. [Google Scholar]
- Canolty RT, Edwards E, Dalal SS, Soltani M, Nagarajan SS, Kirsch HE, Berger MS, Barbaro NM, Knight RT. High gamma power is phase-locked to theta oscillations in human neocortex. Science. 2006;313:1626–1628. doi: 10.1126/science.1128115. [DOI] [PMC free article] [PubMed] [Google Scholar]
- Cardin JA, Carlen M, Meletis K, Knoblich U, Zhang F, Deisseroth K, Tsai LH, Moore CI. Driving fast-spiking cells induces gamma rhythm and controls sensory responses. Nature. 2009;459:663–667. doi: 10.1038/nature08002. [DOI] [PMC free article] [PubMed] [Google Scholar]
- Cash SS, Halgren E, Dehghani N, Rossetti AO, Thesen T, Wang C, Devinsky O, Kuzniecky R, Doyle W, Madsen JR, et al. The human K-complex represents an isolated cortical down-state. Science. 2009;324:1084–1087. doi: 10.1126/science.1169626. [DOI] [PMC free article] [PubMed] [Google Scholar]
- Chater N, Brown GD. Scale-invariance as a unifying psychological principle. Cognition. 1999;69:B17–24. doi: 10.1016/s0010-0277(98)00066-3. [DOI] [PubMed] [Google Scholar]
- Chklovskii DB, Stepanyants A. Power-law for axon diameters at branch point. BMC Neurosci. 2003;4:18. doi: 10.1186/1471-2202-4-18. [DOI] [PMC free article] [PubMed] [Google Scholar]
- Cho A. Econophysics: still controversial after all these years. Science. 2009;325:408. doi: 10.1126/science.325_408. [DOI] [PubMed] [Google Scholar]
- de Arcangelis L, Perrone-Capano C, Herrmann HJ. Self-organized criticality model for brain plasticity. Phys Rev Lett. 2006;96:028107. doi: 10.1103/PhysRevLett.96.028107. [DOI] [PubMed] [Google Scholar]
- De Los Rios P, Zhang Y-C. Universal 1/f noise from dissipative self-organized criticality models. Physical Review Letters. 1999;82:472–475. [Google Scholar]
- Eckhorn R. Oscillatory and non-oscillatory synchronizations in the visual cortex and their possible roles in associations of visual features. Prog Brain Res. 1994;102:405–426. doi: 10.1016/S0079-6123(08)60556-7. [DOI] [PubMed] [Google Scholar]
- Eguiluz VM, Chialvo DR, Cecchi GA, Baliki M, Apkarian AV. Scale-free brain functional networks. Phys Rev Lett. 2005;94:018102. doi: 10.1103/PhysRevLett.94.018102. [DOI] [PubMed] [Google Scholar]
- Elbert T, Ulrich R, Rockstroh B, Lutzenberger W. The processing of temporal intervals reflected by CNV-like brain potentials. Psychophysiology. 1991;28:648–655. doi: 10.1111/j.1469-8986.1991.tb01009.x. [DOI] [PubMed] [Google Scholar]
- Erland S, Greenwood PE. Constructing 1/ωα noise from reversible Markov chains. Phys Rev E Stat Nonlin Soft Matter Phys. 2007;76:031114. doi: 10.1103/PhysRevE.76.031114. [DOI] [PubMed] [Google Scholar]
- Ermentrout GB, Galan RF, Urban NN. Reliability, synchrony and noise. Trends Neurosci. 2008;31:428–434. doi: 10.1016/j.tins.2008.06.002. [DOI] [PMC free article] [PubMed] [Google Scholar]
- Faisal AA, Selen LP, Wolpert DM. Noise in the nervous system. Nat Rev Neurosci. 2008;9:292–303. doi: 10.1038/nrn2258. [DOI] [PMC free article] [PubMed] [Google Scholar]
- Fox MD, Raichle ME. Spontaneous fluctuations in brain activity observed with functional magnetic resonance imaging. Nat Rev Neurosci. 2007;8:700–711. doi: 10.1038/nrn2201. [DOI] [PubMed] [Google Scholar]
- Fox MD, Snyder AZ, Vincent JL, Raichle ME. Intrinsic fluctuations within cortical systems account for intertrial variability in human behavior. Neuron. 2007;56:171–184. doi: 10.1016/j.neuron.2007.08.023. [DOI] [PubMed] [Google Scholar]
- Frank SA. The common patterns of nature. J Evol Biol. 2009;22:1563–1585. doi: 10.1111/j.1420-9101.2009.01775.x. [DOI] [PMC free article] [PubMed] [Google Scholar]
- Freeman WJ. Scale-free neocortical dynamics. Scholarpedia. 2007;2:1357. [Google Scholar]
- Freeman WJ, Zhai J. Simulated power spectral density (PSD) of background electrocorticogram (ECoG) Cogn Neurodyn. 2009;3:97–103. doi: 10.1007/s11571-008-9064-y. [DOI] [PMC free article] [PubMed] [Google Scholar]
- Gilden DL. Cognitive emissions of 1/f noise. Psychol Rev. 2001;108:33–56. doi: 10.1037/0033-295x.108.1.33. [DOI] [PubMed] [Google Scholar]
- Gisiger T. Scale invariance in biology: coincidence or footprint of a universal mechanism? Biol Rev Camb Philos Soc. 2001;76:161–209. doi: 10.1017/s1464793101005607. [DOI] [PubMed] [Google Scholar]
- Granger CWJ. Long memory relationships and the aggregation of dynamic models. Journal of Econometrics. 1980;14:227–236. [Google Scholar]
- Gruneis F, Nakao M, Yamamoto M, Musha T, Nakahama H. An interpretation of 1/f fluctuations in neuronal spike trains during dream sleep. Biol Cybern. 1989;60:161–169. doi: 10.1007/BF00207284. [DOI] [PubMed] [Google Scholar]
- He BJ, Raichle ME. The fMRI signal, slow cortical potential and consciousness. Trends Cogn Sci. 2009;13:302–309. doi: 10.1016/j.tics.2009.04.004. [DOI] [PMC free article] [PubMed] [Google Scholar]
- He BJ, Snyder AZ, Zempel JM, Smyth MD, Raichle ME. Electrophysiological correlates of the brain’s intrinsic large-scale functional architecture. Proc Natl Acad Sci U S A. 2008;105:16039–16044. doi: 10.1073/pnas.0807010105. [DOI] [PMC free article] [PubMed] [Google Scholar]
- Henrie JA, Shapley R. LFP power spectra in V1 cortex: the graded effect of stimulus contrast. J Neurophysiol. 2005;94:479–490. doi: 10.1152/jn.00919.2004. [DOI] [PubMed] [Google Scholar]
- Hsu KJ, Hsu A. Self-similarity of the “1/f noise” called music. Proc Natl Acad Sci U S A. 1991;88:3507–3509. doi: 10.1073/pnas.88.8.3507. [DOI] [PMC free article] [PubMed] [Google Scholar]
- Jensen O, Colgin LL. Cross-frequency coupling between neuronal oscillations. Trends Cogn Sci. 2007;11:267–269. doi: 10.1016/j.tics.2007.05.003. [DOI] [PubMed] [Google Scholar]
- Khader P, Schicke T, Roder B, Rosler F. On the relationship between slow cortical potentials and BOLD signal changes in humans. Int J Psychophysiol. 2008;67:252–261. doi: 10.1016/j.ijpsycho.2007.05.018. [DOI] [PubMed] [Google Scholar]
- Koch C. Computation and the single neuron. Nature. 1997;385:207–210. doi: 10.1038/385207a0. [DOI] [PubMed] [Google Scholar]
- Kornhuber HH, Deecke L. Changes in the Brain Potential in Voluntary Movements and Passive Movements in Man: Readiness Potential and Reafferent Potentials. Pflugers Arch Gesamte Physiol Menschen Tiere. 1965;284:1–17. [PubMed] [Google Scholar]
- Kramer MA, Tort AB, Kopell NJ. Sharp edge artifacts and spurious coupling in EEG frequency comodulation measures. J Neurosci Methods. 2008;170:352–357. doi: 10.1016/j.jneumeth.2008.01.020. [DOI] [PubMed] [Google Scholar]
- Lakatos P, Karmos G, Mehta AD, Ulbert I, Schroeder CE. Entrainment of neuronal oscillations as a mechanism of attentional selection. Science. 2008;320:110–113. doi: 10.1126/science.1154735. [DOI] [PubMed] [Google Scholar]
- Lakatos P, Shah AS, Knuth KH, Ulbert I, Karmos G, Schroeder CE. An oscillatory hierarchy controlling neuronal excitability and stimulus processing in the auditory cortex. J Neurophysiol. 2005;94:1904–1911. doi: 10.1152/jn.00263.2005. [DOI] [PubMed] [Google Scholar]
- Leopold DA, Murayama Y, Logothetis NK. Very slow activity fluctuations in monkey visual cortex: implications for functional brain imaging. Cereb Cortex. 2003;13:422–433. doi: 10.1093/cercor/13.4.422. [DOI] [PubMed] [Google Scholar]
- Levina A, Herrmann JM, Geisel T. Dynamical synapses causing self-organized criticality in neural networks. Nature Physics. 2007;3:857–860. [Google Scholar]
- Lin M, Chen T. Self-organized criticality in a simple model of neurons based on small-world networks. Phys Rev E Stat Nonlin Soft Matter Phys. 2005;71:016133. doi: 10.1103/PhysRevE.71.016133. [DOI] [PubMed] [Google Scholar]
- Linkenkaer-Hansen K, Nikouline VV, Palva JM, Ilmoniemi RJ. Long-range temporal correlations and scaling behavior in human brain oscillations. J Neurosci. 2001;21:1370–1377. doi: 10.1523/JNEUROSCI.21-04-01370.2001. [DOI] [PMC free article] [PubMed] [Google Scholar]
- Logothetis NK. The neural basis of the blood-oxygen-level-dependent functional magnetic resonance imaging signal. Philos Trans R Soc Lond B Biol Sci. 2002;357:1003–1037. doi: 10.1098/rstb.2002.1114. [DOI] [PMC free article] [PubMed] [Google Scholar]
- Logothetis NK, Kayser C, Oeltermann A. In vivo measurement of cortical impedance spectrum in monkeys: implications for signal propagation. Neuron. 2007;55:809–823. doi: 10.1016/j.neuron.2007.07.027. [DOI] [PubMed] [Google Scholar]
- Lowen SB, Cash SS, Poo M, Teich MC. Quantal neurotransmitter secretion rate exhibits fractal behavior. J Neurosci. 1997;17:5666–5677. doi: 10.1523/JNEUROSCI.17-15-05666.1997. [DOI] [PMC free article] [PubMed] [Google Scholar]
- Maimon G, Assad JA. Beyond Poisson: increased spike-time regularity across primate parietal cortex. Neuron. 2009;62:426–440. doi: 10.1016/j.neuron.2009.03.021. [DOI] [PMC free article] [PubMed] [Google Scholar]
- Mandelbrot BB. Multifractals and 1/f Noise. New York: Springer; 1999. [Google Scholar]
- Mandelbrot BB, Van Ness JW. Fractional Brownian motions, fractional noises and applications. SIAM Review. 1968;10:422–437. [Google Scholar]
- Manning JR, Jacobs J, Fried I, Kahana MJ. Broadband shifts in local field potential power spectra are correlated with single-neuron spiking in humans. J Neurosci. 2009;29:13613–13620. doi: 10.1523/JNEUROSCI.2041-09.2009. [DOI] [PMC free article] [PubMed] [Google Scholar]
- Maye A, Hsieh CH, Sugihara G, Brembs B. Order in spontaneous behavior. PLoS One. 2007;2:e443. doi: 10.1371/journal.pone.0000443. [DOI] [PMC free article] [PubMed] [Google Scholar]
- Maylor EA, Chater N, Brown GD. Scale invariance in the retrieval of retrospective and prospective memories. Psychon Bull Rev. 2001;8:162–167. doi: 10.3758/bf03196153. [DOI] [PubMed] [Google Scholar]
- Melloni L, Schwiedrzik CM, Rodriguez E, Singer W. (Micro)Saccades, corollary activity and cortical oscillations. Trends Cogn Sci. 2009;13:239–245. doi: 10.1016/j.tics.2009.03.007. [DOI] [PubMed] [Google Scholar]
- Miller KJ, Sorensen LB, Ojemann JG, den Nijs M. Power-law scaling in the brain surface electric potential. PLoS Comput Biol. 2009a;5:e1000609. doi: 10.1371/journal.pcbi.1000609. [DOI] [PMC free article] [PubMed] [Google Scholar]
- Miller KJ, Zanos S, Fetz EE, den Nijs M, Ojemann JG. Decoupling the cortical power spectrum reveals real-time representation of individual finger movements in humans. J Neurosci. 2009b;29:3132–3137. doi: 10.1523/JNEUROSCI.5506-08.2009. [DOI] [PMC free article] [PubMed] [Google Scholar]
- Milstein J, Mormann F, Fried I, Koch C. Neuronal shot noise and Brownian 1/f2 behavior in the local field potential. PLoS One. 2009;4:e4338. doi: 10.1371/journal.pone.0004338. [DOI] [PMC free article] [PubMed] [Google Scholar]
- Mitra PP, Pesaran B. Analysis of dynamic brain imaging data. Biophys J. 1999;76:691–708. doi: 10.1016/S0006-3495(99)77236-X. [DOI] [PMC free article] [PubMed] [Google Scholar]
- Montemurro MA, Rasch MJ, Murayama Y, Logothetis NK, Panzeri S. Phase-of-firing coding of natural visual stimuli in primary visual cortex. Curr Biol. 2008;18:375–380. doi: 10.1016/j.cub.2008.02.023. [DOI] [PubMed] [Google Scholar]
- Monto S, Palva S, Voipio J, Palva JM. Very slow EEG fluctuations predict the dynamics of stimulus detection and oscillation amplitudes in humans. J Neurosci. 2008;28:8268–8272. doi: 10.1523/JNEUROSCI.1910-08.2008. [DOI] [PMC free article] [PubMed] [Google Scholar]
- Nagai Y, Critchley HD, Featherstone E, Fenwick PB, Trimble MR, Dolan RJ. Brain activity relating to the contingent negative variation: an fMRI investigation. Neuroimage. 2004;21:1232–1241. doi: 10.1016/j.neuroimage.2003.10.036. [DOI] [PubMed] [Google Scholar]
- Onton J, Makeig S. High-frequency Broadband Modulations of Electroencephalographic Spectra. Front Hum Neurosci. 2009;3:61. doi: 10.3389/neuro.09.061.2009. [DOI] [PMC free article] [PubMed] [Google Scholar]
- Panzeri S, Brunel N, Logothetis NK, Kayser C. Sensory neural codes using multiplexed temporal scales. Trends Neurosci. 2010;33:111–120. doi: 10.1016/j.tins.2009.12.001. [DOI] [PubMed] [Google Scholar]
- Petermann T, Thiagarajan TC, Lebedev MA, Nicolelis MA, Chialvo DR, Plenz D. Spontaneous cortical activity in awake monkeys composed of neuronal avalanches. Proc Natl Acad Sci U S A. 2009;106:15921–15926. doi: 10.1073/pnas.0904089106. [DOI] [PMC free article] [PubMed] [Google Scholar]
- Petersen CC, Hahn TT, Mehta M, Grinvald A, Sakmann B. Interaction of sensory responses with spontaneous depolarization in layer 2/3 barrel cortex. Proc Natl Acad Sci U S A. 2003;100:13638–13643. doi: 10.1073/pnas.2235811100. [DOI] [PMC free article] [PubMed] [Google Scholar]
- Plenz D, Thiagarajan TC. The organizing principles of neuronal avalanches: cell assemblies in the cortex? Trends Neurosci. 2007;30:101–110. doi: 10.1016/j.tins.2007.01.005. [DOI] [PubMed] [Google Scholar]
- Rockstroh B, Elbert T, Canavan A, Lutzenberger W, Birbaumer N. Slow Brain Potentials and Behaviour II. 2. München, Germany: Urban & Schwarzenberg; 1989. [Google Scholar]
- Schroeder CE, Lakatos P. Low-frequency neuronal oscillations as instruments of sensory selection. Trends Neurosci. 2009;32:9–18. doi: 10.1016/j.tins.2008.09.012. [DOI] [PMC free article] [PubMed] [Google Scholar]
- Shin CW, Kim S. Self-organized criticality and scale-free properties in emergent functional neural networks. Phys Rev E Stat Nonlin Soft Matter Phys. 2006;74:045101. doi: 10.1103/PhysRevE.74.045101. [DOI] [PubMed] [Google Scholar]
- Siegel M, Konig P. A functional gamma-band defined by stimulus-dependent synchronization in area 18 of awake behaving cats. J Neurosci. 2003;23:4251–4260. doi: 10.1523/JNEUROSCI.23-10-04251.2003. [DOI] [PMC free article] [PubMed] [Google Scholar]
- Stam CJ, de Bruin EA. Scale-free dynamics of global functional connectivity in the human brain. Hum Brain Mapp. 2004;22:97–109. doi: 10.1002/hbm.20016. [DOI] [PMC free article] [PubMed] [Google Scholar]
- Stewart CV, Plenz D. Inverted-U profile of dopamine-NMDA-mediated spontaneous avalanche recurrence in superficial layers of rat prefrontal cortex. J Neurosci. 2006;26:8148–8159. doi: 10.1523/JNEUROSCI.0723-06.2006. [DOI] [PMC free article] [PubMed] [Google Scholar]
- Takahashi K, Koyama Y, Kayama Y, Nakamura K, Yamamoto M. Is statedependent alternation of slow dynamics in central single neurons during sleep present in the rat ventroposterior thalamic nucleus? Neurosci Res. 2004;48:203–210. doi: 10.1016/j.neures.2003.10.015. [DOI] [PubMed] [Google Scholar]
- Thivierge JP, Cisek P. Nonperiodic synchronization in heterogeneous networks of spiking neurons. J Neurosci. 2008;28:7968–7978. doi: 10.1523/JNEUROSCI.0870-08.2008. [DOI] [PMC free article] [PubMed] [Google Scholar]
- Tort AB, Kramer MA, Thorn C, Gibson DJ, Kubota Y, Graybiel AM, Kopell NJ. Dynamic cross-frequency couplings of local field potential oscillations in rat striatum and hippocampus during performance of a T-maze task. Proc Natl Acad Sci U S A. 2008;105:20517–20522. doi: 10.1073/pnas.0810524105. [DOI] [PMC free article] [PubMed] [Google Scholar]
- van den Heuvel MP, Stam CJ, Boersma M, Hulshoff Pol HE. Small-world and scale-free organization of voxel-based resting-state functional connectivity in the human brain. Neuroimage. 2008;43:528–539. doi: 10.1016/j.neuroimage.2008.08.010. [DOI] [PubMed] [Google Scholar]
- Vanhatalo S, Palva JM, Holmes MD, Miller JW, Voipio J, Kaila K. Infraslow oscillations modulate excitability and interictal epileptic activity in the human cortex during sleep. Proc Natl Acad Sci U S A. 2004;101:5053–5057. doi: 10.1073/pnas.0305375101. [DOI] [PMC free article] [PubMed] [Google Scholar]
- Voss RF, Clarke J. ‘1/f noise’ in music and speech. Nature. 1975;258:317–318. [Google Scholar]
- Vyazovskiy VV, Olcese U, Lazimy YM, Faraguna U, Esser SK, Williams JC, Cirelli C, Tononi G. Cortical firing and sleep homeostasis. Neuron. 2009;63:865–878. doi: 10.1016/j.neuron.2009.08.024. [DOI] [PMC free article] [PubMed] [Google Scholar]
- Wagenmakers EJ, Farrell S, Ratcliff R. Estimation and interpretation of 1/fα noise in human cognition. Psychon Bull Rev. 2004;11:579–615. doi: 10.3758/bf03196615. [DOI] [PMC free article] [PubMed] [Google Scholar]
- Walter WG, Cooper R, Aldridge VJ, McCallum WC, Winter AL. Contingent Negative Variation: An Electric Sign of Sensorimotor Association and Expectancy in the Human Brain. Nature. 1964;203:380–384. doi: 10.1038/203380a0. [DOI] [PubMed] [Google Scholar]
- Ward LM. Dynamical Cognitive Science. London: The MIT Press; 2002. [Google Scholar]
- Ward LM, Greenwood PE. 1/f noise. Scholarpedia. 2007;2:1537. [Google Scholar]
- Weissman MB. 1/f noise and other slow, nonexponential kinetics in condensed matter. Reviews of Modern Physics. 1988;60:537–571. [Google Scholar]
- Yamamoto M. Fluctuations observed in biological time series signals and their functional significance. Front Med Biol Eng. 1991;3:135–137. [PubMed] [Google Scholar]
- Yamamoto Y, Hughson RL. Coarse-graining spectral analysis: new method for studying heart rate variability. J Appl Physiol. 1991;71:1143–1150. doi: 10.1152/jappl.1991.71.3.1143. [DOI] [PubMed] [Google Scholar]
- Yamamoto Y, Hughson RL. Extracting fractal components from time series. Physica D. 1993;68:250–264. [Google Scholar]
- Young MP, Tanaka K, Yamane S. On oscillating neuronal responses in the visual cortex of the monkey. J Neurophysiol. 1992;67:1464–1474. doi: 10.1152/jn.1992.67.6.1464. [DOI] [PubMed] [Google Scholar]
- Yuval-Greenberg S, Tomer O, Keren AS, Nelken I, Deouell LY. Transient induced gamma-band response in EEG as a manifestation of miniature saccades. Neuron. 2008;58:429–441. doi: 10.1016/j.neuron.2008.03.027. [DOI] [PubMed] [Google Scholar]
- Zarahn E, Aguirre GK, D’Esposito M. Empirical analyses of BOLD fMRI statistics. I. Spatially unsmoothed data collected under null-hypothesis conditions. Neuroimage. 1997;5:179–197. doi: 10.1006/nimg.1997.0263. [DOI] [PubMed] [Google Scholar]
Associated Data
This section collects any data citations, data availability statements, or supplementary materials included in this article.