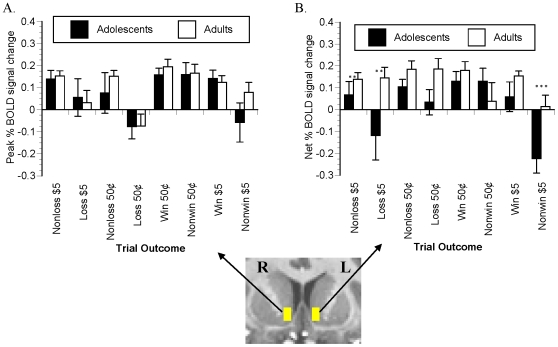
Figure 8. Notification-elicited signal change in NAcc VOI.
Trial-outcome-averaged time series data were extracted from each of the right and left NAcc masks (inset). Group mean modeled peak outcome-elicited signal changes (∼6 s post-cue) are presented here as signal change from baseline. * denotes P<.10 and ** denotes P<.05 per simple-effect t-test.

