Figure 1.
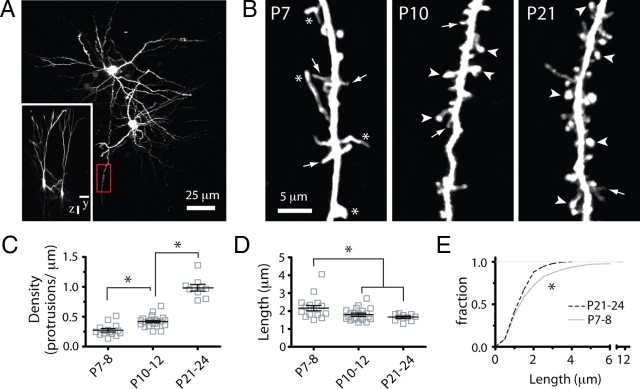
Developmental regulation of early dendritic protrusion density and length in wild-type mice. A, Low-magnification view of two L2/3 pyramidal cells in the somatosensory cortex of a P10 WT mouse that was sparsely labeled with GFP via in utero electroporation and imaged with two-photon microscopy in vivo. The image is a maximum intensity projection of ∼150 slices (3 μm apart). The inset shows the side view (yz projection) of the same cells. Scale bars, 25 μm. The boxed region in red (shown at higher magnification in B, middle panel) is an example of a dendritic region of interest from the apical tuft that was chosen for time-lapse imaging. B, High-magnification view of representative dendritic branches at the three postnatal ages examined. Images are best projections (∼5–7 optical sections, 1 μm apart). Throughout development, thin protrusions (arrows) are gradually replaced with larger spines (arrowheads), typical of mature dendrites. Note also the presence of long and very bright protrusions (asterisks) at P7–P8. C, Density of dendritic protrusions at different postnatal ages. Each square indicates a different dendrite. The largest increase in protrusion density occurs after P10–P12. *p < 0.05, one-way ANOVA followed by Tukey's multiple-comparison test in C and D. D, Length of dendritic protrusions changes only slightly during postnatal development and remains constant after P10–P12. E, Frequency distribution histogram of average protrusion length at P7–P8 and P21–P24 (*p < 0.05, Kolmogorov–Smirnov test). Very long protrusions (>4 μm) represent 8% of all protrusions at P7–P8 but are absent at P21–P24. The distribution of protrusion lengths at P10–P12 (data not shown) was also significantly different from that of P7–P8 and P21–P24 mice.

