
Figure 2.
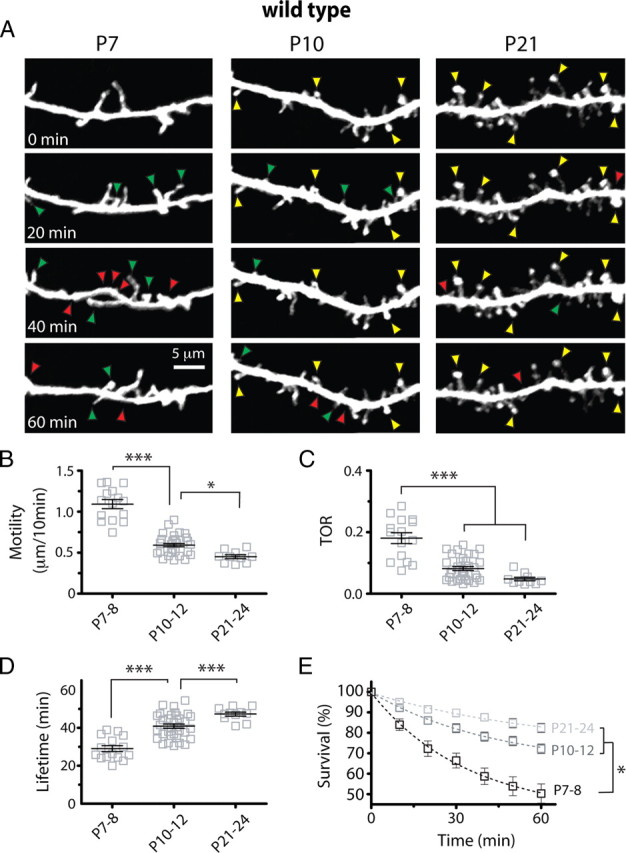
Downregulation of early protrusion dynamics between P7–P8 and P10–P12. A, High-resolution in vivo time-lapse two-photon imaging of dendritic protrusions. Images are best projections (∼6–14 optical sections, 1 μm apart) collected every 10 min (only one-half of the time points are shown for simplicity). Examples of gained (green arrowheads), lost (red arrowheads), and stable (yellow arrowheads) protrusions are indicated. B–D, Motility, TOR, and lifetime of dendritic protrusions at different postnatal ages (***p < 0.001, one-way ANOVA with Tukey's test). Protrusions stabilize quickly between P7–P8 and P10–P12. E, Survival graphs for dendritic protrusions over a 60 min time-lapse imaging session at different postnatal ages (t 1/2 = 53.6, 125.2, and 204.2 min at P7–P8, P10–P12, and P21–P24, respectively; *p < 0.05, two-way ANOVA with Bonferroni's posttest).