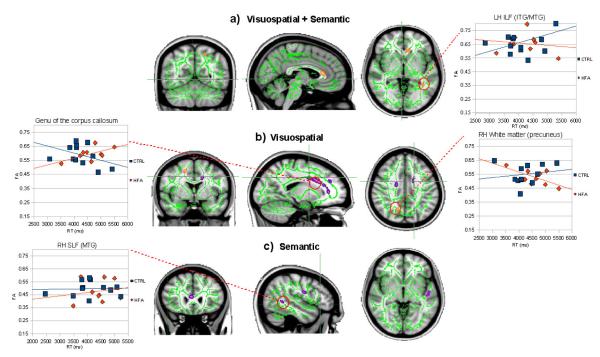
Figure 4.
Group differences in correlation between fractional anisotropy (FA) and response time on the V+S (a), V (b) and S (c) conditions, overlaid on white matter skeletonized template (green), and thickened and color-coded for visualization. Purple: increased RT-FA correlation in CTRL compared to HFA; Orange: increased RT-FA correlation in HFA compared to CTRL. Inserts show representative plot of FA versus response time within areas of interest in each group, to illustrate the direction of the effect. All statistics were significant at a fully-corrected level of p < 0.05.

