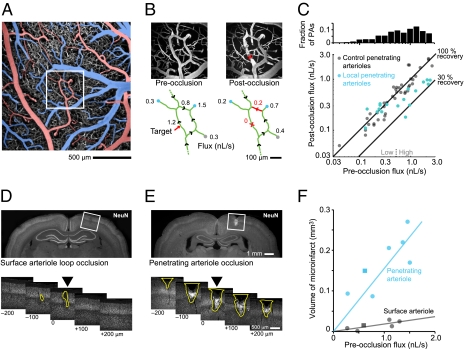
Fig. 5.
Preservation of flux through penetrating arterioles after single-point occlusion of a surface arteriole loop. (A) Maximal projection of a stack of images collected from the upper 300 μm of rat cortical vasculature using in vivo TPLSM. The pial arteriole network is pseudocolored in red and the venous network in blue. The inset highlights a small arteriole loop with three penetrating arteriole stubs. (B) A localized clot is formed in one segment of the surface arteriole loop using targeted photothrombosis (x in loop). Pre- and postocclusion measurements of the flux of RBCs in penetrating arterioles and surface arterioles were collected. Local penetrating arterioles were situated near the targeted surface arteriole, and distant penetrating arterioles were measured as controls. (C) Scatter plot of pre- and postocclusion flux through penetrating arterioles. The histogram of the baseline distribution of flux is derived from 399 arterioles. (D) Photomicrographs of serial sections, stained with αNeuN, from an animal with a surface occlusion that was killed after 1 week of survival. The box indicates the area photographed at higher magnification; arrow in lower set of photomicrographs. The volume of cortical infarction, highlighted by the dashed line, was determined by measuring loss of αNeuN staining across a contiguous set of serial sections. (E) Photomicrographs of serial sections, analyzed as in D, from an animal in which a penetrating arteriole was directly occluded by photothrombosis. Note the relatively large infarction. (F) Microinfarction volumes plotted as a function of the baseline flux of the target arteriole. The experiments shown in D and E are marked with square points.

