

Abstract
Objective
Significant collagen content and tensile properties are difficult to achieve in articular cartilage tissue engineering. This study investigated whether treating developing tissue engineered cartilage constructs with modulators of intracellular Na+ or Ca2+ could increase collagen concentration and tensile properties.
Methods
Inhibitors of Na+ ion transporters and increasers of intracellular Ca2+ were investigated for their ability to affect articular cartilage development in a scaffold-less, 3D chondrocyte culture. Using a systematic approach, ouabain (Na+/K+ ATPase inhibitor), bumetanide (Na+/K+/2Cl− tritransporter inhibitor), histamine (cAMP activator), and ionomycin (a Ca2+ ionophore) were applied to tissue engineered constructs for 1 hr per day on days 10–14 of culture and examined at 2 or 4 wks. Gross morphology, biochemical content, and compressive and tensile mechanical properties of the constructs were assayed.
Results
Analysis showed that 20 µM ouabain, 0.3 µM ionomycin, or their combination increased the tensile modulus by 40–95% compared to untreated controls and resulted in increased collagen normalized to wet weight. In constructs exposed to ouabain, the increased collagen per wet weight was secondary to decreased GAG production on a per cell basis. Treatment with 20 µM ouabain also increased the neo-tissue’s ultimate tensile strength 56–86% at 4 wks. Other construct properties, such as construct growth and collagen type I production, were affected differently by Na+ modulation with ouabain versus Ca2+ modulation with ionomycin.
Conclusions
These data are the first to show that treatments known to alter intracellular ion concentrations are a viable method for increasing the mechanical properties of engineered articular cartilage and identify potentially important relationships to hydrostatic pressure mechanotransduction. Ouabain and ionomycin may be useful pharmacological agents for increasing tensile integrity and directing construct maturation.
Because many cartilage injuries are permanent and irreversible, tissue replacement techniques are desirable (1, 2). Loading via hydrostatic pressure (HP) affects articular cartilage matrix synthesis (3, 4), and hydrostatic loading of chondrocytes alters intracellular ion concentrations by either stimulating or inhibiting the action of numerous ion transporters (3). Therefore, changing intracellular ion concentrations using agents known to affect specific ion transporters or signaling pathways could lead to new strategies to alter biochemical and mechanical properties of tissue engineered articular cartilage.
Two major controllers of Na+ transport in chondrocytes are the Na+/K+ pump and Na+/K+/2Cl− co-transporter. Application of HP to articular chondrocytes inhibits the action of these transporters (5). The Na+/K+ pump is an ATPase that pumps ions against a concentration gradient to keep intracellular K+ higher than Na+, so inhibition of this pump leads to increased intracellular Na+. The Na+/K+/2Cl− co-transporter is a homeostatic regulator of cell size that allows influx of these ions to prevent cell shrinkage in hyperosmotic conditions (3). Inhibition of this co-transporter diminishes the cell’s ability to regulate its volume and decreases intracellular Na+.
HP also causes release of intracellular Ca2+ in chondrocytes (6), suggesting that Ca2+ is involved in signal transduction pathways initiated by HP. Similarly, histamine stimulates Ca2+ release from intracellular stores within chondrocytes (7). For example, Taylor et al. (8) demonstrated dose dependent increases of cyclic AMP concentrations in chondrocytes treated with histamine, and cyclic AMP mobilizes intracellular Ca2+ (9). Additionally, Tomita et al. (10) showed that ionomycin induces chondrogenesis. Ionomycin is a calcium ionophore that increases intracellular calcium in a dose dependent fashion (11).
In a recent experiment from our laboratory, 10 MPa of HP was applied to developing articular cartilage constructs for 1 hr/day on days 10–14 of culture, with a resulting increase in sulfated glycosaminoglycan (sGAG) and collagen (12). Further, treated constructs had improved mechanical properties. The present study investigated whether chemically modulating intracellular sodium and calcium, akin to the effects of HP on ion transporters, would also change the biochemical composition and mechanical properties of articular cartilage constructs. Based on observations described above, ouabain and bumetanide were used to inhibit the Na+/K+ and Na+/K+/2Cl− transporters, respectively, while histamine and ionomycin were chosen to increase intracellular Ca2+. It was hypothesized that these treatments would lead to increased collagen concentration and tensile properties, two aspects of articular cartilage tissue engineering notably difficult to achieve (13–15). This hypothesis was tested through a series of experiments conducted in sequential phases. First, intracellular Na+ and Ca2+ were altered individually. Then, based on the results from the individual experiments, constructs were treated with ouabain and ionomycin simultaneously.
Materials and Methods
Chondrocyte isolation and construct self-assembly, culture, and processing
Bovine chondrocytes were isolated and self-assembled as previously described (1, 12, 16). Separate cell harvests were used for each experiment. Constructs were formed by seeding 5.5×10⁶ live cells in 150 µL media into 5 mm diameter non-adherent, cylindrical wells made of 2% agarose, with an additional 350 µL of media added 4 hrs later. The 500 µL of media were changed 24 hrs after seeding and once per day throughout experiments. Chemically defined medium consisting of DMEM with 4.5 mg/mL glucose and L-glutamine (Biowhittaker/Cambrex, Walkersville, MD) 100 nM dexamethasone (Sigma, St. Louis, MO), 1% fungizone, 1% penicillin/streptomycin, 1% ITS+ (BD Scientific, Franklin Lakes, NJ), 50 µg/mL ascorbate-2-phosphate, 40 µg/mL L-proline, and 100 µg/mL sodium pyruvate (Fisher Scientific, Pittsburgh, PA) buffered at pH=7.3 by 10 mM HEPES was used. This medium formulation has 151 mM Na+, 5.2 mM K+, and 1.7 mM Ca2+, which are near physiological serum concentrations (17). Medium osmolarity was ~346 mOsm. All culture took place at 37°C, 10% CO2, 19% O2, and 71% N2.
Figure 1 shows the different phases of experiments performed in this study. For all experiments, constructs were randomly assigned across treatment groups. In any given experiment, constructs were unconfined (18) on day 10 and transferred to tissue culture plates having only the well bottoms coated with agarose. On days 10–14 constructs were treated with their respective agents. During treatment constructs (including controls) were cultured in petri dishes for 1 hr with ~4 mL of chemically defined media containing the appropriate concentration of agent. Treatment was followed by a 30 min wash step in media without agent before returning constructs to their wells. Treatment occurred at the same time every day over the course of five days. In Phase 1 experiments, effects of a high and low concentration of ouabain, bumetanide, ionomycin, and histamine (all from Sigma) were examined at 14 days to ascertain the immediate response to treatment. Concentrations were chosen based on prior literature (5, 8, 11). Phase II experiments were 4 wks in duration. In one experiment, the Na+ modulators were examined. In the other, effects of continual treatment with 0.3 µM ionomycin from days 10–14 were compared to treating only 1 hr/day on days 10–14. The Phase III experiment was also 4 wks in duration. In this experiment, combined treatment with 0.3 µM ionomycin and 20 µM ouabain for 1 hr/day on days 10–14 of culture was compared to individual treatment with these agents. These two treatment regimens were chosen based on the results of Phase I and Phase II experiments.
Fig 1.
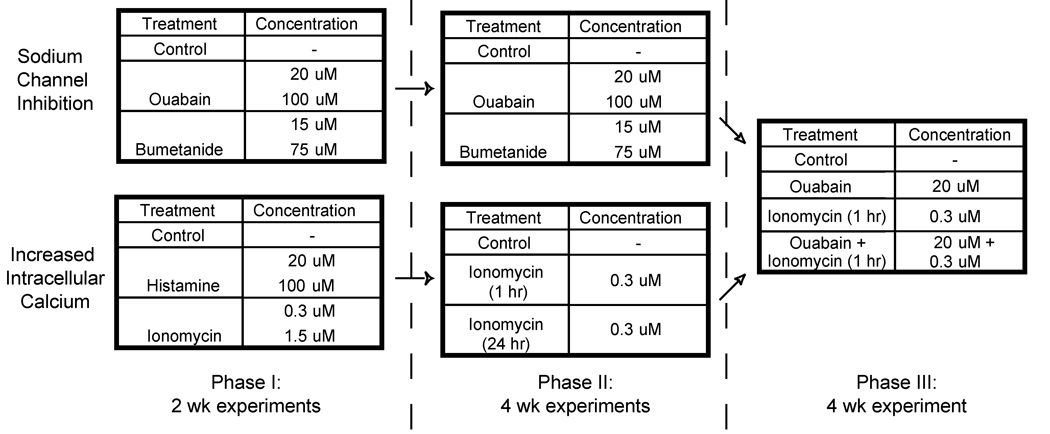
Experimental designs for each phase in this study. In Phase I, a low and high concentration of several intracellular Na+ and Ca2+ modulators (ouabain, bumetanide, ionomycin, and histamine) were examined at 14 days. In Phase II, effects of the Na+ modulators were examined at 4 wks, and the effects of continuous treatment with 0.3 µM ionomycin from days 10–14 were compared to treating only 1 hr per day on days 10–14. Phase III experiments were also 4 wks in duration. Based on Phase II results, combined treatment with 0.3 µM ionomycin and 20 µM ouabain for 1 hr per day on days 10–14 of culture was compared to individual treatment with these agents.
Depending on the Phase, at either 2 or 4 wks constructs were processed for quantitative biochemistry, mechanical testing, and immunohistochemistry (IHC). From culture, constructs were photographed, weighed wet, and portioned for analysis. A 3 mm diameter punch was taken for creep indentation from the construct’s center. The remaining outer ring was portioned ~60% for biochemical analysis and ~40% for tensile testing. Immunohistochemistry samples were prepared from separate constructs.
Gross morphology and IHC
Construct diameter was measured using ImageJ (National Institutes of Health, Bethesda, MD). For IHC, constructs were cryoembedded and sectioned at 14 µm. Samples were fixed with chilled acetone, rinsed with IHC buffer, quenched of peroxidase activity with hydrogen peroxide/methanol, and blocked with horse serum (Vectastain ABC kit, Vector Labs, Burlingame, CA). Sections were then incubated with either mouse anti-collagen type I diluted 1:1000 (Accurate Chemicals, Westbury, NY) or rabbit anti-collagen type II diluted 1:300 (Cedarlane Labs, Burlington, NC). The secondary antibody (anti-mouse or anti-rabbit IgG, Vectastain ABC kit) was then applied, and color was developed using the Vectastain ABC reagent and DAB. In addition to IHC staining of experimental groups, bovine articular cartilage was used as a positive control for collagen type II and as a negative control for type I collagen, while bovine tendon was used as a positive control for collagen type I and as a negative control for type II collagen. Additional controls consisted of tissue stained as described, but without application of the primary antibody. Slides were examined with a light microscope.
Biochemical analysis
Samples were digested in pepsin-elastase as previously described (16). Cell number was determined with the Quant-iT™ PicoGreen® dsDNA Assay Kit (Invitrogen, Carlsbad, CA) assuming 7.8 pg DNA/cell (19). sGAG content was tested for using the Blyscan™ Sulfated GAG Assay kit (Accurate Chemicals). Following hydrolyzation of the digest by 2 N NaOH for 20 min at 110°C, samples were assayed for collagen content using a chloramine-T hydroxyproline assay (20). SIRCOL collagen assay standard (Accurate Chemicals) was used, such that the standard curve was reflective of collagen amount.
Compressive testing
As previously described (14), compressive mechanical properties were determined by creep indentation testing assuming a linear biphasic model (21). A creep indentation apparatus was used to determine the compressive creep and recovery behavior of constructs (22), using a 0.2 g tare load and 0.7 g test load applied through a 0.8 mm diameter, flat-ended, porous, rigid tip. Specimen thickness was measured using a micrometer. To calculate specimen material properties (aggregate modulus, Poisson’s ratio, and permeability), a semi-analytical, semi-numeric, linear biphasic model was used, followed by finite element optimization (22, 23).
Tensile testing
Samples were cut into a dog-bone shape and affixed to paper tabs for gripping (24). ImageJ was used to determine sample gauge length and width from photographs. Gauge length was defined as the distance between paper tabs. Thickness was measured with a micrometer. Tensile tests were performed to failure at a strain rate of 1% of gauge length s−1 on an electromechanical materials testing system (Instron Model 5565, Canton, MA). The apparent Young’s modulus (EY) was determined by least squares fitting the linear region of the stress-strain curve. Ultimate tensile strength (UTS) was determined as the maximum stress reached during a test.
Tensile Poisson’s ratio was determined in Phase II and III experiments. Poisson’s ratio is the negative of the ratio of lateral to axial strain. Axial strain data were acquired via the Instron. Lateral strain was acquired via digital image analysis as follows. First, CHDK, a free firmware add-on for Canon (http://chdk.wikia.com/wiki/CHDK) was installed onto a Cannon SD600 six megapixel digital camera to enable time-lapse videography. The software script was set so the camera would take a photograph at 2 s, and every 4.5 s thereafter. Settings were validated by running the script while photographing a digital timer. Just before a test, a photograph of the specimen loaded into the Instron was taken. This image defined time zero (t=0). The camera script and tensile test were then begun simultaneously, such that acquired images corresponded to the Instron data temporally. During data analysis, pictures were matched in time to the linear portion of the stress-strain curve. In the example of figure 2A, the linear portion begins at t=15.5 s and ends at 38 s. Lateral strain was determined using ImageJ. The width of the specimen in pixels from the t=0 picture determined the “lateral gauge length.” Width in pixels was measured in subsequent pictures (Fig. 2B) corresponding to the linear portion of the stress-strain curve, allowing lateral strain to be calculated. Figure 2C shows a plot of axial strain versus –(lateral strain). Linear regression of this plot gives Poisson’s ratio.
Fig 2.

Representative data from construct tensile testing. A) Stress versus axial strain, B) digital images taken during the test for determination of Poisson’s ratio, and C) linear regression of axial strain versus the negative of lateral strain. In B, note the subtle decrease in the lateral dimension of the construct. “Time-stamps” are provided in each subfigure to demonstrate the way in which lateral strain was matched in time to axial strain.
Statistical analysis
Five to seven samples were used for each experimental group in this study. For all assays, a 1-way ANOVA was run (StatView, Abacus Concepts, Berkeley, CA). If significance (p<0.05) was found, a post-hoc test was performed. For Phase I and Phase II Na+ experiments, a Dunnett’s post-hoc test was used. The Dunnett’s test compares each experimental group to control, but does not compare experimental groups to each other. For the Phase II ionomycin experiment and Phase III, a Student-Newman-Keuls post-hoc was performed. This test allows comparisons among all groups to be made. All data are presented as mean ± S.D.
Results
Phase I
In this Phase, treatment of tissue engineered articular cartilage constructs with low and high concentrations of Na+ transport inhibitors (ouabain and bumetanide) and intracellular Ca2+ modulators (histamine and ionomycin) was examined at 2 wks (Fig. 1). This time point was chosen to immediately follow treatment on days 10–14.
Tables I and II show the growth metrics (diameter, thickness, and wet weight), biochemical content, and mechanical properties for Phases I and II. The only significant differences found for the Na+ transport inhibitors experiment were an increase in cell number/construct for all treatment groups and a decrease in GAG production/cell for the 75 µM bumetanide treatment group. Control constructs had 6.0±0.7 million cells, while treatment with Na+ transport inhibitors caused a 32–35% increase in cell number. For the intracellular Ca2+ modulators experiment, the only significant difference found was that treatment with 0.3 µM ionomycin resulted in a 30% increase in collagen/wet weight (WW) compared to control constructs. This increase was similar to what has been observed at 2 wks following 10 MPa of static HP applied to self-assembled cartilage constructs for 1 hr/day on days 10–14 (12).
Table 1.
Construct Growth Metrics and Biochemical Content for Phase I and II Experiments
| Group | Diameter (mm) |
Thickness (mm) |
Wet Weight (mg) |
Collagen (% WW) |
GAG (% WW) |
Collagen (µg/106 cells) |
GAG (µg/106 cells) |
|
|---|---|---|---|---|---|---|---|---|
| Phase I 2 wks |
Control | 5.1 ± 0.1 | 0.26 ± 0.03 | 5.4 ± 0.3 | 15 ± 3.5 | 1.9 ± 0.2 | 136 ± 35 | 17.7 ± 3.6 |
| 20 µM ouabain | 5.1 ± 0.1 | 0.24 ± 0.01 | 4.9 ± 0.7 | 20.6 ± 5.4 | 2.4 ± 0.3 | 122 ± 13 | 14.3 ± 1.6 | |
| 100 µM ouabain | 4.9 ± 0.1 | 0.24 ± 0.02 | 5.0 ± 0.1 | 17.8 ± 5.4 | 2.4 ± 0.5 | 112 ± 31 | 15.1 ± 3.5 | |
| 15 µM bumetanide | 5.0 ± 0.1 | 0.25 ± 0.04 | 5.3 ± 0.4 | 18.8 ± 5.7 | 2.1 ± 0.4 | 120 ± 18 | 14.1 ± 3.5 | |
| 75 µM bumetanide | 5.1 ± 0.1 | 0.24 ± 0.01 | 5.3 ± 0.3 | 17.4 ± 2.8 | 1.5 ± 0.1 | 119 ± 21 | 10.4 ± 1.3* | |
| Control | 5.3 ± 0.1 | 0.26 ± 0.03 | 7.1 ± 0.1 | 13.7 ± 2.1 | 2.2 ± 0.4 | 242 ± 63 | 39.3 ± 10.0 | |
| 20 µM histamine | 5.3 ± 0.1 | 0.28 ± 0.02 | 7.6 ± 0.5 | 15.3 ± 2.8 | 2.9 ± 0.3 | 239 ± 21 | 46.3 ± 9.3 | |
| 100 µM histamine | 5.3 ± 0.1 | 0.30 ± 0.03 | 7.5 ± 0.5 | 12.6 ± 2.0 | 2.8 ± 0.6 | 209 ± 35 | 46.5 ± 13.9 | |
| 0.3 µM ionomycin | 5.3 ± 0.1 | 0.29 ± 0.02 | 7.4 ± 0.3 | 17.8 ± 2.5* | 2.7 ± 0.7 | 274 ± 35 | 41.3 ± 8.0 | |
| 1.5 µM ionomycin | 5.5 ± 0.2 | 0.31 ± 0.02 | 7.3 ± 0.4 | 15.3 ± 2.2 | 2.2 ± 0.3 | 258 ± 42 | 36.9 ± 4.6 | |
| Phase II 4 wks |
Control | 7.4 ± 0.3 | 0.76 ± 0.04 | 39.9 ± 3.0 | 6.3 ± 1.0 | 6.3 ± 0.3 | 403 ± 62 | 409 ± 83 |
| 20 µM ouabain | 6.5 ± 0.2* | 0.69 ± 0.09 | 24.9 ± 2.5* | 9.0 ± 2.0* | 6.8 ± 1.0 | 345 ± 44 | 267 ± 60* | |
| 100 µM ouabain | 6.3 ± 0.2* | 0.56 ± 0.05* | 19.6 ± 1.2* | 12 ± 1.6* | 6.8 ± 0.6 | 426 ± 77 | 236 ± 38* | |
| 15 µM bumetanide | 7.1 ± 0.2 | 0.73 ± 0.05 | 34.2 ± 2.3 | 8.2 ± 2.5 | 6.7 ± 0.3 | 412 ± 167 | 335 ± 86 | |
| 75 µM bumetanide | 7.1 ± 0.4 | 0.73 ± 0.10 | 36.0 ± 3.7 | 7.7 ± 0.7 | 6.8 ± 0.4 | 484 ± 120 | 426 ± 88 | |
| Control | 5.9 ± 0.2 | 0.54 ± 0.04 | 15.6 ± 1.3 | 8.3 ± 1.0 | 9.2 ± 0.5 | 319 ± 25 | 354 ± 23 | |
| 0.3 µM ionomycin (1 hr) | 6.0 ± 0.2 | 0.52 ± 0.04 | 15.3 ± 1.7 | 8.0 ± 0.4 | 8.8 ± 0.6 | 311 ± 32 | 345 ± 52 | |
| 0.3 µM ionomycin (24 hr) | 5.9 ± 0.1 | 0.47 ± 0.05 | 13.1 ± 1.7 | 8.9 ± 1.6 | 9.3 ± 0.4 | 297 ± 35 | 313 ± 36 | |
Indicates significantly different from control by post-hoc testing
WW = wet weight
Table 2.
Construct Compressive and Tensile Properties for Phase I and II Experiments
| Tension | Compression | ||||||
|---|---|---|---|---|---|---|---|
| Group | Young's Modulus (kPa) |
UTS (kPa) | Poisson's Ratio |
Aggregate modulus (kPa) |
Permeability† | Poisson's Ratio |
|
| Phase I 2 wks |
Control | 592 ± 199 | 260 ± 81 | - | 66 ± 10 | 3.8 ± 1.0 | 0.01 ± 0.01 |
| 20 µM ouabain | 628 ± 398 | 372 ± 159 | - | 64 ± 17 | 9.0 ± 8.6 | 0.01 ± 0.01 | |
| 100 µM ouabain | 543 ± 222 | 271 ± 82 | - | 76 ± 25 | 6.6 ± 5.1 | 0.04 ± 0.08 | |
| 15 µM bumetanide | 644 ± 328 | 270 ± 100 | - | 71 ± 22 | 8.0 ± 3.6 | 0.01 ± 0.01 | |
| 75 µM bumetanide | 481 ± 258 | 234 ± 41 | - | 69 ± 27 | 5.9 ± 3.2 | 0.04 ± 0.07 | |
| Control | 421 ± 145 | 337 ± 93 | - | 65 ± 20 | 5.4 ± 3.3 | 0.09 ± 0.11 | |
| 20 µM histamine | 425 ± 110 | 313 ± 97 | - | 66 ± 17 | 4.6 ± 2.4 | 0.07 ± 0.07 | |
| 100 µM histamine | 477 ± 269 | 265 ± 92 | - | 82 ± 31 | 5.3 ± 2.5 | 0.09 ± 0.06 | |
| 0.3 µM ionomycin | 423 ± 179 | 288 ± 90 | - | 63 ± 13 | 10.9 ± 14.9 | 0.15 ± 0.12 | |
| 1.5 µM ionomycin | 354 ± 184 | 287 ± 89 | - | 61 ± 19 | 2.6 ± 0.6 | 0.03 ± 0.03 | |
| Phase II 4 wks |
Control | 485 ± 150 | 228 ± 132 | 0.23 ± 0.06 | 129 ± 65 | 19 ± 14 | 0.11 ± 0.08 |
| 20 µM ouabain | 733 ± 140* | 356 ± 101 | 0.38 ± 0.14* | 191 ± 53 | 16 ± 11 | 0.12 ± 0.09 | |
| 100 µM ouabain | 738 ± 127* | 364 ± 66 | 0.34 ± 0.09 | 157 ± 73 | 14 ± 14 | 0.06 ± 0.09 | |
| 15 µM bumetanide | 527 ± 117 | 216 ± 65 | 0.29 ± 0.08 | 136 ± 72 | 43 ± 47 | 0.09 ± 0.11 | |
| 75 µM bumetanide | 574 ± 253 | 225 ± 125 | 0.33 ± 0.11 | 165 ± 51 | 42 ± 36 | 0.12 ± 0.10 | |
| Control | 977 ± 266 | 273 ± 87 | 0.54 ± 0.19 | 286 ± 160 | 64 ± 60 | 0.22 ± 0.13 | |
| 0.3 µM ionomycin (1 hr) | 1372 ± 304* | 402 ± 106 | 0.51 ± 0.15 | 399 ± 95 | 24 ± 22 | 0.26 ± 0.07 | |
| 0.3 µM ionomycin (24 hr) | 1409 ± 262* | 425 ± 108 | 0.45 ± 0.12 | 357 ± 30 | 40 ± 24 | 0.22 ± 0.13 | |
Indicates significantly different from control by post-hoc testing.
Permeability units are 10−15 m4/N˙s.
Phase II
Based on results from Phase I, Phase II experiments of 4 wks duration were designed (Fig. 1). None of the Na+ transport inhibitors showed a distinct advantage over the others at 2 wks, so it was decided to study each again. It was hypothesized that the increased cell number seen at 2 wks would translate to beneficial increases in biochemical and mechanical properties over the subsequent 2 wks. Table I shows that treatment with ouabain yielded increased collagen normalized to WW compared to control. There were 43% and 90% increases in collagen/WW for treatment with 20 µM and 100 µM ouabain, respectively, suggesting a dose dependence. There was also an ~50% increase in Young’s modulus for both the 20 µM and 100 µM ouabain treatment groups compared to control (Table II), while tensile Poisson’s ratio only increased with 20 µM ouabain treatment. Again, these changes are tantamount to those observed at 4 wks following 10 MPa of HP applied to self-assembled cartilage constructs. Additionally, treatment with either 20 µM or 100 µM ouabain significantly decreased construct diameter, WW, and GAG production/cell. Treatment with 100 µM ouabain also decreased construct thickness compared to control, but 20 µM ouabain did not yield constructs significantly thinner than control. There were no significant differences following ouabain treatment in cells/construct, GAG/WW or compressive mechanical properties. Further, there were no significant differences in any parameter assessed following bumetanide treatment.
With respect to intracellular Ca2+ modulators, results from Phase I showed that 0.3 µM ionomycin deserved further study. It was hypothesized that the significant increase in collagen/WW would lead to a delayed increase in tensile properties. Additionally, the effects of treatment for 1 hr/day on days 10–14 were compared to continuous treatment over days 10–14. Table II shows that both of these treatment regimens resulted in at least a 40% increase in Young’s modulus compared to control, but there was no significant difference comparing the treatment regimens to each other. There were no significant differences in any of the other parameters assessed following these two treatment regimens.
Phase III
Based on results from Phases I and II, Phase III compared individual treatment with 20 µM ouabain or 0.3 µM ionomycin for 1 hr to a combined treatment with these two agents (Fig. 1). As before, treatment was for 1 hr/day on days 10–14 of culture. Biochemical assays, mechanical testing, and IHC staining for collagens type I and II were performed at 4 wks.
Figure 3 shows gross morphological pictures and IHC staining for collagens I and II for the four groups studied. Note the grossly appreciable decrease in diameter of ouabain treated sample compared to control. Collagen II was present in all groups. Collagen I was absent from the control and ouabain groups, but stained weakly in ionomycin and combined treatment groups. Congruent with gross morphological observations, diameters of constructs treated with ouabain or the combination of ouabain and ionomycin were significantly less than diameters of controls or ionomycin treated constructs. Diameters measured 6.77±0.27, 6.18±0.14, 6.71±0.28, and 6.40±0.18 mm for control, ouabain, ionomycin, and combined treatments, respectively. Similarly, for construct WWs, treatment with ouabain or the combination of ouabain and ionomycin resulted in constructs with significantly less WW than controls or ionomycin treated constructs. WWs were 28.7±6.0, 17.8±1.1, 30.0±2.7, and 19.7±1.8 mg for control, ouabain, ionomycin, and combined treatments, respectively. For construct thickness, ouabain and combined treatment constructs were significantly thinner than ionomycin treated constructs, but not significantly different from control construct thickness. Construct thicknesses measured 0.74±0.08, 0.62±0.04, 0.84±0.14, and 0.62±0.13 mm for control, ouabain, ionomycin, and combined treatments, respectively. These growth metric findings recapitulate Phase II results.
Fig 3.

Gross morphological (A–D) and immunohistochemistry (IHC) images for type II collagen (E–H) and type I collagen (I–L) from the Phase III experiment. Note the smaller size of ouabain treated constructs. All groups stained for type II collagen, while groups treated with ionomycin also showed trace collagen type I staining. The scale Bar in L = 100 µm and applies to all IHC images.
Looking at construct biochemical composition, there were no significant differences in the number of cells/construct or GAG normalized to WW. GAG/WW was 8.0±0.7, 8.0±0.5, 7.3±0.6, and 7.2±0.3 % for control, ouabain, ionomycin, and combined treatments, respectively. Figure 4B shows results for total collagen normalized to WW. Treatment with ouabain or the combination of ouabain and ionomycin resulted in constructs with significantly increased collagen concentration compared to controls or ionomycin treated constructs. There was an ~30% increase over control in collagen normalized to WW for both ouabain and combination treatment groups. When normalized to construct cellular content, treatment with ouabain or the combination of ouabain and ionomycin resulted in significantly less GAG production/cell compared to controls or ionomycin treated constructs. The amount of GAG produced/106 cells was 429±39, 324±19, 418±23, and 305±18 µg for control, ouabain, ionomycin, and combined treatments, respectively. As measured by hydroxyproline, there were no differences in collagen production/cell. Collagen produced/106 cells was 346±41, 328±51, 373±23, and 343±57 µg for control, ouabain, ionomycin, and combined treatments, respectively.
Fig 4.

Phase III A) tensile stiffness and B) total collagen normalized to construct wet weight. All three treatment groups resulted in an ~95% increase in tensile stiffness compared to control, while groups treated with ouabain contained significantly more total collagen per wet weight than controls.
In terms of construct mechanical properties, as seen in Phase II, there were no significant differences in compressive properties. Construct aggregate moduli measured 174±120, 132±71, 130±54, and 186±105 kPa for control, ouabain, ionomycin, and combined treatments, respectively. Permeabilities were 42±20, 49±27, 51±35, and 43±48×10−15 m4/N˙s, while compressive Poisson’s ratios were 0.16±0.14, 0.18±0.10, 0.22±0.07, and 0.21±0.09 for control, ouabain, ionomycin, and combined treatments, respectively. Figure 4A shows construct tensile stiffness. All treatment groups had significantly increased Young’s moduli compared to control. There was at least a 95% increase in tensile stiffness over control for all treatments. For UTS, only ouabain had significantly greater strength than control. UTSs measured 258±78, 479±74, 340±144, and 407±192 kPa for control, ouabain, ionomycin, and combined treatments, respectively. In terms of tensile Poisson’s ratios, there were no significant differences among groups, though there was a trend for increased Poisson’s ratio compared to control (p=0.12) in ouabain treated constructs. Tensile Poisson’s ratios were 0.38±0.14, 0.55±0.16, 0.43±0.10, and 0.45±0.19 for control, ouabain, ionomycin, and combined treatments, respectively.
Discussion
In this study, a series of experiments identified 20 µM ouabain, an inhibitor of the Na+/K+ pump, and 0.3 µM ionomycin, a calcium ionophore, as modulators of intracellular ion concentration that led to increased tensile properties in developing articular cartilage constructs. Specifically, 20 µM ouabain, 0.3 µM ionomycin, or their combination increased the tensile modulus 40–95% compared to untreated controls. Moreover, 20 µM ouabain increased construct UTS and trended towards an increased tensile Poisson’s ratio. Results of this study suggest that chemically modulating intracellular ion concentrations may be useful for functional tissue engineering of articular cartilage.
Though achieving similar functional improvement at 4 wks, intracellular Na+ and Ca2+ modulation showed differential behavior over the course of these experiments. First, growth metrics of developing constructs were affected by intracellular Na+ modulation with ouabain, but not by intracellular Ca2+ modulation with ionomycin. Ouabain treatment resulted in decreased diameter and WW, with 100 µM causing a greater decrease in both metrics than 20 µM. Ionomycin treatment, whether for 1 hr/day for 5 days or 5 days continuous, did not significantly alter construct WW or thickness. These changes in growth metrics reflect the fact that ouabain treatment significantly reduced GAG production on a per cell basis, whereas ionomycin treatment did not. Lower GAG levels are associated with decreased WW and size. Second, the tensile propertey increase for ouabain was related to an increase in collagen/WW at the same time point, while the increase in collagen/WW for ionomycin was at 2 wks, with increased tensile stiffness at 4 wks. A delay in tensile stiffness compared to increased collagen has been previously seen following HP application (12), with the delay likely due to the relatively slow rate of collagen remodeling within the matrix. Finally, ionomycin caused trace collagen type I staining, while ouabain treatment did not. The effects of Ca2+ have previously been related to chondrocyte phenotype (9), where it was suggested that increased intracellular Ca2+ may induce collagen type I production. These findings demonstrate that Na+ and Ca2+ modulation have different effects on developing articular cartilage constructs. Further understanding of these differences will contribute to improved control over articular cartilage tissue engineering processes.
It has been suggested that continued matrix deposition with relative maintenance of construct or tissue explant size represents maturational growth (16, 25). Thus, ouabain may be a pharmacological method for directing maturation of engineered cartilage. Articular cartilage tissue engineering efforts suffer from poor collagen content (15, 26–28), whereas attainment of GAG levels in the range of native tissue values is readily accomplished (16, 27, 29–32). This imbalance results in engineered constructs with reasonable compressive properties but poor tensile integrity. Though GAG production on a per cell basis was decreased following ouabain treatment, there was net positive GAG deposition between 2 and 4 wks (compare %WW of GAG multiplied by construct WW at these times). However, net deposition was less than for controls. The decrease in GAG deposition between ouabain and control constructs likely allows for a more appropriate balance between GAG and collagen, resulting in increased tensile integrity.
Engineering articular cartilage with increased tensile stiffness is a recognized hurdle (26–28). Results from this study show 20 µM ouabain and 0.3 µM ionomycin are effective towards this goal. Further experiments should investigate whether these treatments can be combined with other known methods of increasing tensile properties of tissue engineered articular cartilage (13, 14, 16, 33). Moreover, while measurement of tensile stiffness is becoming more common in articular cartilage tissue engineering (12–14, 16, 31, 34–38), to our knowledge, data presented in this study are the first measurements of tensile Poisson’s ratio in engineered articular cartilage, let alone that this material property may change in response to altered intracellular Na+. These data may be useful in growth mixture models of articular cartilage and the collagen network (39), which are aided by experimentally measured biomechanical properties.
Literature on effects of intracellular ion regulators in cartilage tissue engineering has been sparse. For example, gadolinium, an inhibitor of stretch activated Ca2+ channels, was shown to abrogate proteoglycan synthesis that occurred in response to dynamic compression of chondrocyte embedded agarose constructs (40). Mouw et al. (41) have also examined the relationship of ion channels and compression induced mechanotransduction. Chondrocyte seeded agarose gels treated with different ion channel modulators were subjected to dynamic compression. In the presence of nifedipine (a Ca2+ channel blocker) or thapsigargin (a releaser of intracellular Ca2+), compression significantly increased collagen synthesis, while gadolinium presence led to an increase in both collagen and sGAG synthesis. For the first time, the present study demonstrates that directed manipulation of intracellular ion concentrations can result in changes in functional properties of developing neo-tissue.
Downstream mechanisms for how alteration of ion concentrations results in changes in matrix synthesis and mechanical properties should be deciphered in future studies now that a direct effect has been shown. Notable here are other stimuli known or suspected to function via changes in intracellular ion concentrations, such as dynamic compression (42), fluid induced shear loading (11, 43–45), and HP (3, 5, 6). Results from this study may be related to mechanotransduction occurring during static HP application. Supporting this idea, the intracellular Na+ and Ca2+ modulators chosen for systematic study were based on known effects of HP application to chondrocytes (3, 5, 6). These chemical agents were also applied following the same regimen used for HP treatment of developing engineered articular cartilage, a regimen known to alter the biochemical composition and mechanical properties of constructs formed in the same system used in the present study (12, 31). Several findings of Elder and Athanasiou (12) are paralleled in the present study, such as increased collagen/WW at 2 wks (with 0.3 µM ionomycin) and 4 wks (with 20 µM ouabain or the combination), and increased tensile properties at 4 wks (20 µM ouabain, 0.3 µM ionomycin, or their combination).
The fact that only some of the findings of HP application were recapitulated by treatment with ouabain, ionomycin, or their combination, is not surprising given that HP is known to do more than inhibit the Na+/K+ pump and alter intracellular Ca2+. For example, HP has known effects on the Na+/H+ exchanger (46), glucose carrier (47), and stretch-activated channels (48). The treatments used in this study are not known to directly affect these proteins. Additionally, effects of bumetanide may have been mitigated in the present experiment due to the culture media used, as activity of the Na+/K+/2Cl− co-transporter is affected by osmolarity (3). Since the media osmolarity is not isotonic with chondrocytes in situ, the co-transporter is relatively inactive in the experimental environment. Bumetanide could not be expected to inhibit an already quiescent transporter. Further, the present study did not assess whether changes in intracellular ion concentrations under 10 MPa of static HP and treatment with 20 µM ouabain or 0.3 µM ionomycin are similar. It could be that the doses of ouabain or ionomycin studied do not produce similar changes to what occurs during HP in our 3D chondrocyte culture. These are potential reasons for why there were no changes in GAG/WW or compressive properties with the treatments investigated in this study, and they suggest a plethora of future experiments to be performed.
It is not yet known how oubain or ionomycin treatment leads to increased tensile properties, the minimal duration of treatment necessary to effect these changes, or what the optimal culture conditions are for their usage. In this study, treatment was applied for 1 hr/day. It is possible that the observed effects may be dominated by processes initiated early during treatment, as prolonged alteration of ionic concentrations can lead to changes in membrane transport proteins. For example, the ionic and osmotic environment of chondrocytes is known to alter Na+/K+ pump abundance (49, 50). Further, as ion transporter activity is influenced by extracellular ionic and osmotic conditions, experiments using these treatments in different medium formulations could lead to enhanced effects. Despite these unanswered questions, treatment with 20 µM ouabain and 0.3 µM ionomycin for 1 hr/day in the present medium formulation improved construct tensile integrity.
In summary, this study investigated whether chemically modulating intracellular sodium and calcium would alter articular cartilage construct development. Through a series of experiments, 20 µM ouabain and 0.3 µM ionomycin were found to increase collagen/WW and tensile properties of tissue engineered constructs. The data presented provide insight into potentially important aspects of mechanotransduction during HP application and demonstrate that it may be possible to find chemical equivalents to some forms of mechanical stimulation.
Acknowledgements
The authors gratefully acknowledge funding support from NIAMS R01AR053286. K. A. Athanasiou has contributed to OsteoBiologics (now part of Smith & Nephew), Diabetica Solutions, and VidaCare. He is now working with Rice University to develop technologies related to cartilage repair. Other authors have no competing interests to declare.
References
- 1.Hu JC, Athanasiou KA. A self-assembling process in articular cartilage tissue engineering. Tissue Eng. 2006;12(4):969–979. doi: 10.1089/ten.2006.12.969. [DOI] [PubMed] [Google Scholar]
- 2.Elder BD, Athanasiou KA. Hydrostatic pressure in articular cartilage tissue engineering: from chondrocytes to tissue regeneration. Tissue Eng Part B Rev. 2009;15(1):43–53. doi: 10.1089/ten.teb.2008.0435. [DOI] [PMC free article] [PubMed] [Google Scholar]
- 3.Wilkins RJ, Browning JA, Urban JP. Chondrocyte regulation by mechanical load. Biorheology. 2000;37(1–2):67–74. [PubMed] [Google Scholar]
- 4.Hall AC, Urban JP, Gehl KA. The effects of hydrostatic pressure on matrix synthesis in articular cartilage. J Orthop Res. 1991;9(1):1–10. doi: 10.1002/jor.1100090102. [DOI] [PubMed] [Google Scholar]
- 5.Hall AC. Differential effects of hydrostatic pressure on cation transport pathways of isolated articular chondrocytes. J Cell Physiol. 1999;178(2):197–204. doi: 10.1002/(SICI)1097-4652(199902)178:2<197::AID-JCP9>3.0.CO;2-3. [DOI] [PubMed] [Google Scholar]
- 6.Browning JA, Saunders K, Urban JP, Wilkins RJ. The influence and interactions of hydrostatic and osmotic pressures on the intracellular milieu of chondrocytes. Biorheology. 2004;41(3–4):299–308. [PubMed] [Google Scholar]
- 7.Horwitz ER, Higgins TM, Harvey BJ. Histamine-induced cytosolic calcium increase in porcine articular chondrocytes. Biochim Biophys Acta. 1996;1313(2):95–100. doi: 10.1016/0167-4889(96)00057-2. [DOI] [PubMed] [Google Scholar]
- 8.Taylor DJ, Yoffe JR, Brown DM, Woolley DE. Histamine H2 receptors on chondrocytes derived from human, canine and bovine articular cartilage. Biochem J. 1985;225(2):315–319. doi: 10.1042/bj2250315. [DOI] [PMC free article] [PubMed] [Google Scholar]
- 9.Deshmukh K, Sawyer BD. Synthesis of collagen by chondrocytes in suspension culture: modulation by calcium, 3':5'-cyclic AMP, and prostaglandins. Proc Natl Acad Sci U S A. 1977;74(9):3864–3868. doi: 10.1073/pnas.74.9.3864. [DOI] [PMC free article] [PubMed] [Google Scholar]
- 10.Tomita M, Reinhold MI, Molkentin JD, Naski MC. Calcineurin and NFAT4 induce chondrogenesis. J Biol Chem. 2002;277(44):42214–42218. doi: 10.1074/jbc.C200504200. [DOI] [PubMed] [Google Scholar]
- 11.Alford AI, Yellowley CE, Jacobs CR, Donahue HJ. Increases in cytosolic calcium, but not fluid flow, affect aggrecan mRNA levels in articular chondrocytes. J Cell Biochem. 2003;90(5):938–944. doi: 10.1002/jcb.10715. [DOI] [PubMed] [Google Scholar]
- 12.Elder BD, Athanasiou KA. Effects of temporal hydrostatic pressure on tissue-engineered bovine articular cartilage constructs. Tissue Eng Part A. 2009;15(5):1151–1158. doi: 10.1089/ten.tea.2008.0200. [DOI] [PMC free article] [PubMed] [Google Scholar]
- 13.Bian L, Crivello KM, Ng KW, Xu D, Williams DY, Ateshian GA, et al. Influence of Temporary Chondroitinase ABC-Induced Glycosaminoglycan Suppression on Maturation of Tissue-Engineered Cartilage. Tissue Eng Part A. 2009;15(8):2065–2072. doi: 10.1089/ten.tea.2008.0495. [DOI] [PMC free article] [PubMed] [Google Scholar]
- 14.Natoli R, Revell CM, Athanasiou K. Chondroitinase ABC Treatment Results in Increased Tensile Properties of Self-Assembled Tissue Engineered Articular Cartilage. Tissue Eng Part A. 2009 doi: 10.1089/ten.tea.2008.0478. [DOI] [PMC free article] [PubMed] [Google Scholar]
- 15.Responte DJ, Natoli RM, Athanasiou KA. Collagens of articular cartilage: structure, function, and importance in tissue engineering. Crit Rev Biomed Eng. 2007;35(5):363–411. doi: 10.1615/critrevbiomedeng.v35.i5.20. [DOI] [PubMed] [Google Scholar]
- 16.Natoli RM, Responte DJ, Lu BY, Athanasiou KA. Effects of multiple chondroitinase ABC applications on tissue engineered articular cartilage. J Orthop Res. 2009;27(7):949–956. doi: 10.1002/jor.20821. [DOI] [PMC free article] [PubMed] [Google Scholar]
- 17.Hall AC, Horwitz ER, Wilkins RJ. The cellular physiology of articular cartilage. Exp Physiol. 1996;81(3):535–545. doi: 10.1113/expphysiol.1996.sp003956. [DOI] [PubMed] [Google Scholar]
- 18.Elder BD, Athanasiou KA. Effects of confinement on the mechanical properties of self-assembled articular cartilage constructs in the direction orthogonal to the confinement surface. J Orthop Res. 2008;26(2):238–246. doi: 10.1002/jor.20480. [DOI] [PMC free article] [PubMed] [Google Scholar]
- 19.Kim YJ, Sah RL, Doong JY, Grodzinsky AJ. Fluorometric assay of DNA in cartilage explants using Hoechst 33258. Anal Biochem. 1988;174(1):168–176. doi: 10.1016/0003-2697(88)90532-5. [DOI] [PubMed] [Google Scholar]
- 20.Woessner JF., Jr The determination of hydroxyproline in tissue and protein samples containing small proportions of this imino acid. Arch Biochem Biophys. 1961;93:440–447. doi: 10.1016/0003-9861(61)90291-0. [DOI] [PubMed] [Google Scholar]
- 21.Mow VC, Kuei SC, Lai WM, Armstrong CG. Biphasic creep and stress relaxation of articular cartilage in compression? Theory and experiments. J Biomech Eng. 1980;102(1):73–84. doi: 10.1115/1.3138202. [DOI] [PubMed] [Google Scholar]
- 22.Athanasiou KA, Agarwal A, Muffoletto A, Dzida FJ, Constantinides G, Clem M. Biomechanical properties of hip cartilage in experimental animal models. Clin Orthop. 1995;316:254–266. [PubMed] [Google Scholar]
- 23.Mow VC, Gibbs MC, Lai WM, Zhu WB, Athanasiou KA. Biphasic indentation of articular cartilage--II. A numerical algorithm and an experimental study. J Biomech. 1989;22(8–9):853–861. doi: 10.1016/0021-9290(89)90069-9. [DOI] [PubMed] [Google Scholar]
- 24.Aufderheide AC, Athanasiou KA. Assessment of a bovine co-culture, scaffold-free method for growing meniscus-shaped constructs. Tissue Eng. 2007;13(9):2195–2205. doi: 10.1089/ten.2006.0291. [DOI] [PubMed] [Google Scholar]
- 25.Asanbaeva A, Masuda K, Thonar EJ, Klisch SM, Sah RL. Mechanisms of cartilage growth: modulation of balance between proteoglycan and collagen in vitro using chondroitinase ABC. Arthritis Rheum. 2007;56(1):188–198. doi: 10.1002/art.22298. [DOI] [PubMed] [Google Scholar]
- 26.Kafienah W, Cheung FL, Sims T, Martin I, Miot S, Ruhland CV, et al. Lumican inhibits collagen deposition in tissue engineered cartilage. Matrix Biol. 2008;27(6):526–534. doi: 10.1016/j.matbio.2008.04.002. [DOI] [PubMed] [Google Scholar]
- 27.Ng KW, Saliman JD, Lin EY, Statman LY, Kugler LE, Lo SB, et al. Culture duration modulates collagen hydrolysate-induced tissue remodeling in chondrocyte-seeded agarose hydrogels. Ann Biomed Eng. 2007;35(11):1914–1923. doi: 10.1007/s10439-007-9373-z. [DOI] [PubMed] [Google Scholar]
- 28.Wong M, Siegrist M, Gaschen V, Park Y, Graber W, Studer D. Collagen fibrillogenesis by chondrocytes in alginate. Tissue Eng. 2002;8(6):979–987. doi: 10.1089/107632702320934074. [DOI] [PubMed] [Google Scholar]
- 29.Bastiaansen-Jenniskens YM, Koevoet W, de Bart AC, van der Linden JC, Zuurmond AM, Weinans H, et al. Contribution of collagen network features to functional properties of engineered cartilage. Osteoarthritis Cartilage. 2008;16(3):359–366. doi: 10.1016/j.joca.2007.07.003. [DOI] [PubMed] [Google Scholar]
- 30.Waldman SD, Couto DC, Grynpas MD, Pilliar RM, Kandel RA. A single application of cyclic loading can accelerate matrix deposition and enhance the properties of tissue-engineered cartilage. Osteoarthritis Cartilage. 2006;14(4):323–330. doi: 10.1016/j.joca.2005.10.007. [DOI] [PubMed] [Google Scholar]
- 31.Elder BD, Athanasiou KA. Synergistic and additive effects of hydrostatic pressure and growth factors on tissue formation. PLoS ONE. 2008;3(6):e2341. doi: 10.1371/journal.pone.0002341. [DOI] [PMC free article] [PubMed] [Google Scholar]
- 32.Revell CM, Reynolds CE, Athanasiou KA. Effects of initial cell seeding in self assembly of articular cartilage. Ann Biomed Eng. 2008;36(9):1441–1448. doi: 10.1007/s10439-008-9524-x. [DOI] [PMC free article] [PubMed] [Google Scholar]
- 33.Elder BD, Athanasiou KA. Systematic assessment of growth factor treatment on biochemical and biomechanical properties of engineered articular cartilage constructs. Osteoarthritis Cartilage. 2009;17(1):114–123. doi: 10.1016/j.joca.2008.05.006. [DOI] [PMC free article] [PubMed] [Google Scholar]
- 34.Gemmiti CV, Guldberg RE. Fluid flow increases type II collagen deposition and tensile mechanical properties in bioreactor-grown tissue-engineered cartilage. Tissue Eng. 2006;12(3):469–479. doi: 10.1089/ten.2006.12.469. [DOI] [PubMed] [Google Scholar]
- 35.Gratz KR, Wong VW, Chen AC, Fortier LA, Nixon AJ, Sah RL. Biomechanical assessment of tissue retrieved after in vivo cartilage defect repair: tensile modulus of repair tissue and integration with host cartilage. J Biomech. 2006;39(1):138–146. doi: 10.1016/j.jbiomech.2004.10.016. [DOI] [PubMed] [Google Scholar]
- 36.Huang AH, Yeger-McKeever M, Stein A, Mauck RL. Tensile properties of engineered cartilage formed from chondrocyte- and MSC-laden hydrogels. Osteoarthritis Cartilage. 2008;16(9):1074–1082. doi: 10.1016/j.joca.2008.02.005. [DOI] [PMC free article] [PubMed] [Google Scholar]
- 37.Ofek G, Revell CM, Hu JC, Allison DD, Grande-Allen KJ, Athanasiou KA. Matrix development in self-assembly of articular cartilage. PLoS ONE. 2008;3(7):e2795. doi: 10.1371/journal.pone.0002795. [DOI] [PMC free article] [PubMed] [Google Scholar]
- 38.Williams GM, Klein TJ, Sah RL. Cell density alters matrix accumulation in two distinct fractions and the mechanical integrity of alginate-chondrocyte constructs. Acta Biomater. 2005;1(6):625–633. doi: 10.1016/j.actbio.2005.07.009. [DOI] [PubMed] [Google Scholar]
- 39.Klisch SM, Asanbaeva A, Oungoulian SR, Masuda K, Thonar EJ, Davol A, et al. A cartilage growth mixture model with collagen remodeling: validation protocols. J Biomech Eng. 2008;130(3) doi: 10.1115/1.2907754. 031006. [DOI] [PMC free article] [PubMed] [Google Scholar]
- 40.Chowdhury TT, Knight MM. Purinergic pathway suppresses the release of.NO and stimulates proteoglycan synthesis in chondrocyte/agarose constructs subjected to dynamic compression. J Cell Physiol. 2006;209(3):845–853. doi: 10.1002/jcp.20768. [DOI] [PubMed] [Google Scholar]
- 41.Mouw JK, Imler SM, Levenston ME. Ion-channel regulation of chondrocyte matrix synthesis in 3D culture under static and dynamic compression. Biomech Model Mechanobiol. 2007;6(1–2):33–41. doi: 10.1007/s10237-006-0034-1. [DOI] [PubMed] [Google Scholar]
- 42.Hunter CJ, Mouw JK, Levenston ME. Dynamic compression of chondrocyte-seeded fibrin gels: effects on matrix accumulation and mechanical stiffness. Osteoarthritis Cartilage. 2004;12(2):117–130. doi: 10.1016/j.joca.2003.08.009. [DOI] [PubMed] [Google Scholar]
- 43.Edlich M, Yellowley CE, Jacobs CR, Donahue HJ. Cycle number and waveform of fluid flow affect bovine articular chondrocytes. Biorheology. 2004;41(3–4):315–322. [PubMed] [Google Scholar]
- 44.Edlich M, Yellowley CE, Jacobs CR, Donahue HJ. Oscillating fluid flow regulates cytosolic calcium concentration in bovine articular chondrocytes. J Biomech. 2001;34(1):59–65. doi: 10.1016/s0021-9290(00)00158-5. [DOI] [PubMed] [Google Scholar]
- 45.Yellowley CE, Jacobs CR, Donahue HJ. Mechanisms contributing to fluid-flow-induced Ca2+ mobilization in articular chondrocytes. J Cell Physiol. 1999;180(3):402–408. doi: 10.1002/(SICI)1097-4652(199909)180:3<402::AID-JCP11>3.0.CO;2-4. [DOI] [PubMed] [Google Scholar]
- 46.Browning JA, Walker RE, Hall AC, Wilkins RJ. Modulation of Na+ × H+ exchange by hydrostatic pressure in isolated bovine articular chondrocytes. Acta Physiol Scand. 1999;166(1):39–45. doi: 10.1046/j.1365-201x.1999.00534.x. [DOI] [PubMed] [Google Scholar]
- 47.Wilkins RJ, Browning JA, Ellory JC. Surviving in a matrix: membrane transport in articular chondrocytes. J Membr Biol. 2000;177(2):95–108. doi: 10.1007/s002320001103. [DOI] [PubMed] [Google Scholar]
- 48.Mizuno S. A novel method for assessing effects of hydrostatic fluid pressure on intracellular calcium: a study with bovine articular chondrocytes. Am J Physiol Cell Physiol. 2005;288(2):C329–C337. doi: 10.1152/ajpcell.00131.2004. [DOI] [PubMed] [Google Scholar]
- 49.Mobasheri A. Regulation of Na+, K+-ATPase density by the extracellular ionic and osmotic environment in bovine articular chondrocytes. Physiol Res. 1999;48(6):509–512. [PubMed] [Google Scholar]
- 50.Mobasheri A, Hall AC, Urban JP, France SJ, Smith AL. Immunologic and autoradiographic localisation of the Na+, K(+)-ATPase in articular cartilage: upregulation in response to changes in extracellular Na+ concentration. Int J Biochem Cell Biol. 1997;29(4):649–657. doi: 10.1016/s1357-2725(96)00150-1. [DOI] [PubMed] [Google Scholar]