Figure 6.
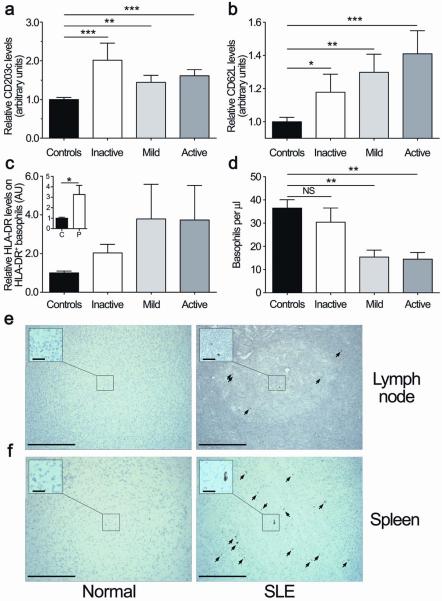
Basophils in SLE patients are active, upregulate CD62L and HLA-DR, and home to secondary lymphoid organs. (a) Flow cytometric analysis of CD203c expression levels on blood basophils from healthy controls and inactive/mild/active SLE patients ((n=13/15/15) as described in Fig. 5a) relative to controls (n=41). Data are the ratio of CD203c mean fluorescence intensity (MFI) normalized to controls. (b) Same as in (a) showing expression of CD62L. Data are means ± s.e.m (healthy controls: n=14; SLE patients: inactive/moderate/active, n=4/6/6). (c) Flow cytometric analysis of relative HLA-DR levels on HLA-DR+ blood basophils compared to healthy controls. Data are means ± s.e.m (healthy controls: n=13; SLE patients: inactive/mild/active n=4/6/6). (d) Absolute number of blood basophils in healthy controls (n=41) or inactive/mild/active SLE patients (n=13/15/15) as determined by flow cytometry. Data are means ± s.e.m. (a–d) Statistical analysis was by a two tailed unpaired student t test; *: p<0.05; **: p<0.01; ***: p<0.001; NS: not significant. (e, f) Immunohistochemistry (with the 2D7 monoclonal antibody) of basophils in the lymph nodes (e) or spleen (f) of healthy (normal) controls or SLE patients (n=2). Basophils were found in the B cell zone of lymph node germinal centers for SLE patients only (e). A spleen biopsy from healthy (normal) controls or SLE patient shows the localization of basophils in the germinal centers of patients but not normals (f). Similar results were obtained with a second basophil specific antibody (BB1). Original magnification x20. Scale bar, 200 μm. (inset) Original magnification x40. Scale bar, 25 μm.

