

Abstract
Herein, we exploit the use of microfluidics and optimized Taylor cones for improved intrasource separation/selective ionization of lipid classes during electrospray ionization. Increased differential ionization of multiple phospholipid classes was achieved through microfluidics with chip-based ionization resulting in substantial enhancement of intrasource separation/selective ionization of phospholipid classes in comparison to the conventional ion source. For example, using myocardial lipid extracts, 3-fold improvements in intrasource separation/selective ionization of myocardial phospholipid classes were routinely realized in the negative-ion mode in the absence of LiOH or other basic modifiers in the infused sample solutions. Importantly, the relative ratios of ions corresponding to individual molecular species in each lipid class to a selected internal standard from myocardial extracts were nearly identical between the chip-based interface and the syringe-pump-driven capillary interface. Therefore, quantitation of individual lipid molecular species directly from biological extracts through comparisons with internal standards in each lipid class was readily accomplished with an accuracy and dynamic range nearly identical to those documented using the well-established direct syringe-pump-driven capillary interface. Collectively, the use of microfluidics and robotic sample handling substantially enhances intrasource separation of lipids in comparison to routine capillary interfaces and greatly facilitates the use of multi-dimensional mass spectrometry using shotgun lipidomics, thereby providing an automated and high-throughput platform for global analyses of cellular lipidomes.
Lipidomics, defined as the large-scale study of the pathways and networks of cellular lipids in biological systems, is an emerging and rapidly expanding research field.1–3 Although lipidomics has only emerged as a distinct field within the past few years,1–3 numerous new discoveries and advances have already been made.3–12 Among them, multidimensional mass spectrometry (MS)-based shotgun lipidomics13–15 has distinguished itself as a robust and highly informative analytical platform for MS analyses of individual lipid molecular species directly from biological lipid extracts. The current platform for shotgun lipidomics includes a series of simple steps such as multiplexed extractions/reactions during sample preparation, intrasource separation/selective ionization, identification of individual lipid molecular species using building block-based multi-dimensional MS (MDMS), and quantitation of the identified individual lipid molecular species using a two-step ratiometric method.4,15–17 MDMS is totally analogous to multi-dimensional nuclear magnetic resonance spectroscopy except that axes of mass instead of frequency are routinely used and structural information is obtained from fragment ion reconstruction and array analysis. From the cross peaks of the scanned fragment ions (i.e., lipid building blocks) with any given molecular ion, array reconstruction allows determination of the molecular identities of ions without individual fragmentation of each ion.7,13 The underlying principles of MDMS-based shotgun lipidomics are to maximally exploit the differences in the (physico)chemical properties of different lipid classes in conjunction with the unique chemistries of a specific lipid class. By taking advantage of both the unique structural and physical properties of lipids, MDMS-based shotgun lipidomics has greatly extended the capability of lipidomics for the analysis of low and extremely low-abundance lipid molecular species, increased the dynamic range of lipid analyses, and has provided a robust platform for quantitative analyses of cellular lipids.
Recently, a nanomate device for automated sample injection equipped with a microfluidics-based ion source for electrospray ionization (ESI) has become commercially available and integrated into quadrupole time-of-flight (QqTOF) mass spectrometers for the profiling of lipid molecular species.12,18–20 Multiple advantages inherent in the nanomate device were observed in those analyses which used a pulsed technique with subsequent TOF analysis and computer-assisted molecular ion reconstruction for profiling. Moreover, since the original sample inlet connection and the ionization tube are replaced by a disposable tip and an individual nozzle in the nanomate device, potential cross contamination is essentially eliminated. Furthermore, substantially smaller volumes of samples are used by microfluidics-based chip generated ionization in comparison to a syringe-pump-driven interface, thereby greatly reducing instrument maintenance due to decreased accumulation of undesirable contaminants and facilitating lipid analysis of a small quantity of biological samples. Traditionally, triple quadrupole (QqQ) systems have been used for quantitation where the difficulties inherent in simultaneously identifying the position and the momentum of the examined ions are not present in direct linear scanning modes.
In this report, we describe the use of microfluidics-based ionization to improve the intrasource separation/selective ionization and power of MDMS to enhance our original shotgun lipidomics platform developed using a syringe-pump-driven capillary interface. Moreover, we compared the accuracy of measurements of lipid analyses examined through utilization of a nanomate device in comparison to the prior syringe-pump-based direct infusion and capillary ionization approach. Collectively, the utilization of a nanomate device greatly improved the performance of MDMS-based shotgun lipidomics as an automated and high-throughput platform for global analysis of cellular lipidomes.
EXPERIMENTAL
Materials
Synthetic phospholipids (including 1,2-dimyristoleoyl-sn-glycero-3-phosphocholine (14:1-14:1 PtdCho), 1,2-dipalmitoleyl-sn-glycero-3-phosphoethanolamine (16.1-16.1 PtdEtn), 1,2-dipentadecanoyl-sn-glycero-3-phosphoglycerol (15:0-15:0 PtdGro), 1,2-dimyristoyl-sn-glycero-3-phosphoserine (14:0- 14:0 PtdSer)), and N-lauroryl sphingomyelin (N12:0 SM)) were purchased from Avanti Polar Lipids, Inc. (Alabaster, AL, USA). All the solvents were obtained from Burdick and Jackson (Honeywell International Inc., Burdick and Jackson, Muskegon, MI, USA). All other chemicals were purchased from Sigma-Aldrich (St. Louis, MO, USA).
Preparation of lipid extracts from biological samples
Mice (male, C57 BL/J background, 4 months of age) were purchased from The Jackson Laboratory (Bar Harbor, ME, USA). All animal procedures were performed in accordance with the Guide for the Care and Use of Laboratory Animals and were approved by the Animals Studies Committee at Washington University. Mice were anesthetized by asphyxiation with CO2 and tissue samples were immediately harvested and freeze-clamped at the temperature of liquid nitrogen. The tissue wafers were pulverized into a fine powder with a stainless-steel mortar and pestle. A sample (approximately 10 mg) from each powdered tissue sample was weighed and homogenized in 1 mL of ice-cooled diluted (0.1×) phosphate-buffered saline with a Potter-Elvehjem tissue grinder. Protein assays on each individual homogenate were performed using a bicinchoninic acid protein assay kit (Pierce, Rockford, IL, USA) with bovine serum albumin as a standard. After a certain amount of homogenate (~1 mL) from each sample had been transferred to a disposable culture borosilicate glass tube (16 × 100 mm), 4 mL of CHCl3/MeOH (1:1, v/v) and the proper volume of LiCl solution to make up to 1.8 mL of final LiCl solution (50 mM) were added to each individual test tube. Internal standards in a pre-mixed solution containing one species of a class of interest for quantitative global lipid analysis of individual molecular species of lipid classes were also added to each tissue sample based on protein concentration prior to extraction of lipids. Thus, the lipid content could be normalized to the protein content and quantified directly through ion intensity comparison relative to that of a selected internal standard (i.e., ratiometric comparison). The selection of the proper internal standards for quantitation has been extensively discussed previously.4 The selected internal standards only represent ≪ 1% of endogenous cellular lipid molecular species present as demonstrated by ESI-MS lipid analysis without addition of these internal standards. Each individual lipid extract was reconstituted with a volume of 500 μL/mg of tissue protein in 1:1 CHCl3/MeOH. The lipid extracts were finally flushed with nitrogen, capped, and stored at −20°C for ESI-MS (typically analyzed within 1 week) as previously described.21
Mass spectrometric analysis of lipids
A TSQ Quantum Ultra Plus triple-quadrupole mass spectrometer (Thermo Fisher Scientific, San Jose, CA, USA) equipped with an automated nanospray apparatus (i.e., Nanomate HD, Advion Bioscience Ltd., Ithaca, NY, USA) and Xcalibur system software were utilized in the study. Ionization voltages of −1.1, −0.95, and +1.2 kV and gas pressures of 0.3, 0.15, and 0.3 psi on the nanomate apparatus were employed for the analyses of anionic lipids, PtdEtn, and PtdCho, respectively. The nanomate was controlled by Chipsoft 7.2.0 software. Each lipid extract solution prepared above was properly diluted to less than 50 pmol of total lipids/μL with chloroform/methanol/isopropanol (1:2:4, v/v/v) prior to infusion into the mass spectrometer. This procedure was used to guarantee that no lipid aggregation occurred during analysis and to minimize any effects of residual inorganic components carried over during lipid extraction on ion suppression and/or chemical noise.
The first and third quadrupoles were used as independent mass analyzers with a mass resolution setting of 0.7 Thomson while the second quadrupole served as a collision cell for tandem mass spectrometry (MS/MS). Typically, a 1-min period of signal averaging in the profile mode was employed for each mass spectrum. For MS/MS, a collision gas pressure was set at 1.0 mTorr but the collision energy varied with the classes of lipids as described previously.4,15 For each MS/MS spectrum, a 2- to 5-min period of signal averaging in the profile mode was employed. All the MS spectra and MS/MS spectra were automatically acquired by a customized sequence subroutine operated under Xcalibur software. Data processing of MDMS analyses including ion peak selection, baseline correction, data transfer, peak intensity comparison, 13C de-isotoping, and quantitation were conducted using custom programmed Microsoft Excel macros, as outlined previously.15
Miscellaneous
Data from biological samples were normalized to the protein content and all data are presented as the mean ± standard deviation (SD) of multiple separated sample preparation from different animals. Statistical differences between mean values were determined by using Student’s t-test and a value of p <0.05 was considered as significant.
RESULTS AND DISCUSSION
Utilization of microfluidics-based ionization facilitates intrasource separation and selective ionization of different lipid classes
Recently, we have demonstrated the differential ionization efficiency of lipid classes based on their inherent electrical propensities.4,22 This ion source separation and/or selective ionization of different lipids are now referred to as ‘intrasource separation’.22 For example, an approximately 40-fold selective ionization of anionic phospholipids (represented with PtdGro) over weakly anionic phospholipids (represented with PtdEtn) has been demonstrated.22 The chemical mechanisms underlying intrasource separation include the differential transfer and selective affinity of ions of each lipid class based on its formal charge and its stereoelectronic propensity for ionization.22 We have also demonstrated that intrasource separation depends on the achievement of a minimal flow rate of infusion and that intrasource separation was diminished at a flow rate lower than 0.5 μL/min.22 Following this line of reasoning, we suspected that intrasource separation would be diminished in nanospray ionization MS using traditional capillary-based interfaces. Accordingly, we explored the potential use of microfluidics for enhanced intrasource separation.
Surprisingly, by using microfluidics chips engineered to provide optimized Taylor cones for efficient ionization, microfluidics-based separation/selective ionization of discrete lipid classes was markedly enhanced in comparison to the conventional syringe-pump-driven interface (Fig. 1). Four fundamental observations regarding the use of microfluidics-based ionization were made. First, the mass spectrum of a diluted solution of mouse myocardial lipid extract acquired in the negative-ion mode through a nanomate device shows abundant ions corresponding to anionic phospholipids as identified by MDMS as previously described.15 For example, the intensities of the ions at m/z 678.5 and 834.5, corresponding to 14:0-14:0 PtdSer (C34H65O10PN) (an internal standard for quantitation of PtdSer molecular species) and 18:0-22:6 PtdSer (C46H77O10PN), respectively, were substantially enhanced in the mass spectrum acquired using the nanomate device (Fig. 1(B)).
Figure 1.
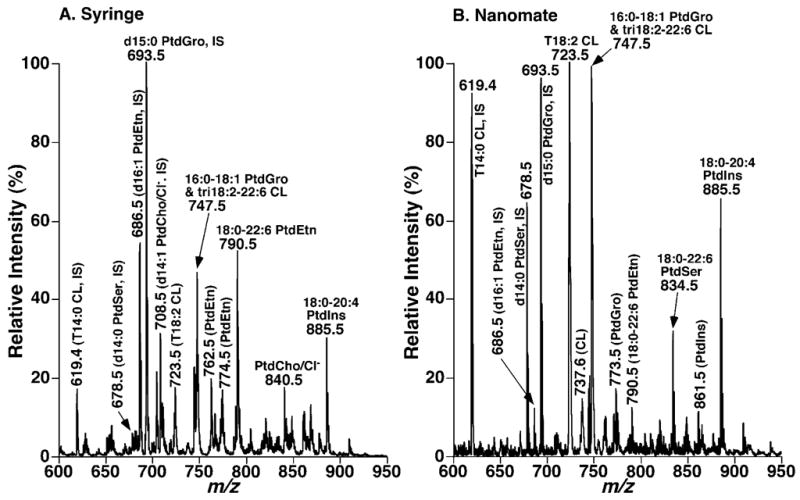
Comparisons of ESI mass spectra of mouse myocardial lipids acquired from an ion source coupled to a syringe-pump-driven interface to that obtained using a nanomate interface. Mass spectrum in (A) was acquired in the negative-ion mode directly from a diluted lipid extract (<50 pmol of total lipids/μL in 1:1 CHCl3/MeOH) infused with a syringe-pump-driven interface. The mass spectrum in (B) was acquired in the negative-ion mode directly from a diluted mouse myocardial lipid extract (<50 pmol of total lipids/μL in chloroform/methanol/isopropanol (1:2:4, v/v/v)) infused with a nanomate interface. ‘IS’ denotes internal standard. CL, PtdCho, PtdEtn, PtdGro, PtdIns, and PtdSer stand for cardiolipin, choline glycerophospholipid, ethanolamine glycerophospholipid, phosphatidylglycerol, phosphatidylinositol, and phosphatidylserine, respectively.
Second, the ionization efficiency of the ions corresponding to cardiolipin molecular species which are doubly charged in this mass region relative to other anionic phospholipids were greatly increased with a microfluidics-based ionization in comparison to those ionized in an ionspray source coupled with a syringe-pump-driven interface (Fig. 1). For example, the ionization of the ions at m/z 619.4, 723.5, 737.6, 747.5, corresponding to tetra14:0 (C65H124O17P2), tetra18:2 (C81H140O17P2), tri18:2-20:2/18:2-18:2-18:1-20:3 (C83H144O17P2), and tri18:2-22:6 (C85H140O17P2) doubly charged cardiolipin, respectively, was apparently enhanced (Fig. 1). This is likely facilitated by the increased interactions of the doubly charged ions with the higher charge density within the optimized Taylor cone in the microfluidic chip in comparison to the singly charged ions.
Third, the ions corresponding to PtdEtn molecular species which were present in the mass spectra acquired with a syringe-pump-driven interface (Fig. 1(A)) were markedly reduced in mass spectra acquired using the nanomate device (Fig. 1(B)). For example, the reduction of ions at m/z 790.6 (18:0-22:6 PtdEtn, C45H77O8PN, a predominant molecular species in mouse myocardial ethanolamine glycerophospholipids) and at m/z 686.5 (16:1-16:1 PtdEtn, C37H69O8PN, an internal standard for quantitation of PtdEtn molecular species) were apparent (Fig. 1) in comparison to PtdGro. More specifically, the peak intensity ratio of ions at m/z 693.5 and 686.5, corresponding to 15:0-15:0 PtdGro (C36H70O10P) and 16:1-16:1 PtdEtn (C37H69O8PN), respectively, is approximately three times higher in the mass spectrum acquired with a nanomate device (Fig. 1(A)) in comparison to that acquired with the syringe-pump-driven interface (Fig. 1(B)). This observation indicates that the intrasource separation using chip-based ionization was markedly enhanced in comparison to that with a syringe-pump-driven capillary interface.
Finally, the ions corresponding to the chlorine adducts of PtdCho and SM (e.g., the ions at m/z 708.5 and 840.5, corresponding to the chlorinated 14:1-14:1 PtdCho (C36H68O8PNCl, an internal standard for the quantitation of PtdCho molecular species) and chlorinated 16:0-22:6 PtdCho (C46H80O8PNCl), respectively), were abundant in the mass spectra acquired with an ion source coupled with a syringe-pump-driven interface (Fig. 1(A)). These ions were in very low abundance in mass spectra acquired using the nanomate device, thereby resulting in a much clearer spectrum for anionic phospholipid analysis (Fig. 1(B)). Accordingly, these results demonstrate that the microfluidics chip in the nanomate device engineered for optimization of the geometry of the Taylor cone facilitates the intrasource separation/selective ionization of lipid classes and particularly improves ionization with doubly charged molecular species (e.g., cardiolipin).
Microfluidics-based ionization is suitable for quantitative analyses of individual lipid molecular species
Next, we determined whether the microfluidic interface is useful for quantitative analyses of lipid molecular species in the low-concentration region using methods we have established and independently validated utilizing ion sources coupled with a syringe-pump-driven interface.13,23,24 We quantitatively determined the levels of numerous lipid molecular species in lipid extracts of many different biological samples including tissue samples from mouse brain, heart, liver, and kidney, body fluids such as human and mouse plasma and human cerebrospinal fluid, and cell pellets and compared results from microfluidics-based ionization to those obtained using a syringe-pump-driven interface. We demonstrated that the levels of all examined lipid molecular species obtained from the nanomate device were essentially identical within experimental errors (5 to 10 mol% for analyses of biological samples) to those determined with a syringe-pump-driven interface (see below).
For example, the ratios of mouse myocardial anionic phospholipid molecular species to their corresponding internal standards did not change although the ion intensities corresponding to the lipid molecular species of some specific lipid classes were different in the mass spectra acquired by using these two different ion sources (Fig. 1). It should be pointed out that the ratio of peak intensities of the ion at m/z 747.5 in the mass spectrum acquired with the nanomate device relative to PtdGro internal standard (i.e., the ion at m/z 693.5) (Fig. 1(B)) is much higher in comparison to the ratio of this pair of ions in the mass spectrum acquired with a syringe-pump-driven interface (Fig. 1(A)). This was due to that the ion at m/z 747.5 contained isobaric molecular species of 16:0-18:1 PtdGro (C40H76O10P) and tri18:2-22:6 cardiolipin (C85H140O17P2) while the ionization efficiency of the latter species as a doubly charged ion as stated above was substantially enhanced in the MS analysis with a nanomate device. The component of the tri18:2-22:6 cardiolipin was quantitated based on the [M+1–2H]2− 13C isotopologue intensity of this species by comparison to the intensity of the internal standard of cardiolipin at m/z 619.4 when a high resolution setting was applied to acquire the mass spectrum as previously described.25 The content of 16:0-18:1 PtdGro was determined from the intensity of the ion by comparison to its internal standard at m/z 693.5 after subtracting the intensity of isobaric tri18:2-22:6 cardiolipin which was calculated from the intensity of its doubly charged M+1 13C isotopologue (i.e., [M+1–2H]2−).
The ion peak intensity ratios of individual PtdCho and PtdEtn molecular species of mouse myocardium to their respective internal standards were indistinguishable between the mass spectra that were acquired by using either the nanomate device or the syringe-pump-driven interface (Fig. 2). The contents of each individual molecular species of PtdCho and PtdEtn were quantitated employing a two-step procedure as previously described16,26 (Tables 1 and 2). Figure 3 shows the detail comparison of the determined levels of the individual PtdCho and PtdEtn molecular species present in the lipid extracts of mouse myocardium from an ion source (the error of <5% in reproducibility) and a nanomate (which is also an error of <5% in reproducibility) (Tables 1 and 2). These data indicate that the differences in these determined levels were essentially identical within the experimental error of biological samples (i.e., 5 to 10 mol%) under the experimental conditions employed.
Figure 2.
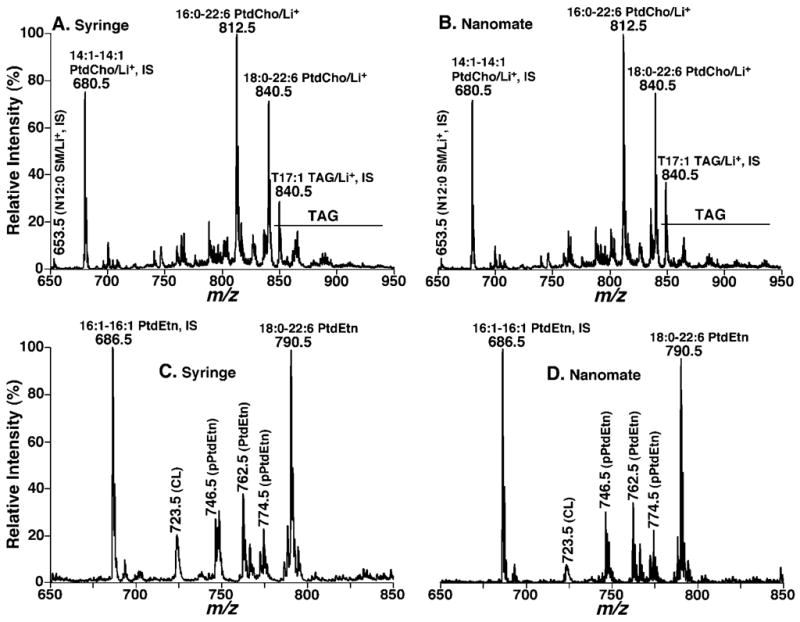
Mass spectrometric analyses of mouse myocardial lipid extracts infused by either a syringe-pump-driven interface or a nanomate interface. The lipid extracts were appropriately diluted to less than 50 pmol of total lipids/μL with either 1:1 CHCl3/MeOH or chloroform/methanol/isopropanol (1:2:4, v/v/v) in the presence of approximately 25 pmol of LiOH/μL prior to infusion with a syringe-pump-driven interface (A, C) or a nanomate interface (B, D), respectively, in the positive (A, B) or negative (C, D) mode. ‘IS’ denotes internal standard. CL, PtdCho, PtdEtn, and TAG stand for cardiolipin, choline glycerophospholipid, ethanolamine glycerophospholipid, and triacylglycerol, respectively.
Table 1.
Contents of choline glycerophospholipid molecular species of an identical lipid extract determined using both an ion source interface and a nanomatea
| No. | Molecular species | Formula | Monoisotopic mass of [M+Li]+ | Content determined using ion source | Content determined using nanomate |
|---|---|---|---|---|---|
| 1 | P16:0-16:1/P16:1-16:0/P18:1-14:0 | C40H78O7PN | 722.57 | 0.0051 ± 0.0001 | 0.0049 ± 0.0002 |
| 2 | A16:0-18:3 | C42H80O7PN | 748.58 | 0.018 ± 0.001 | 0.018 ± 0.001 |
| 3 | A16:0-16:1 | C40H80O7PN | 724.58 | 0.022 ± 0.001 | 0.022 ± 0.001 |
| 4 | A16:0-20:4 | C44H82O7PN | 774.60 | 0.045 ± 0.001 | 0.044 ± 0.001 |
| 5 | P18:0-20:4 | C46H84O7PN | 800.61 | 0.046 ± 0.001 | 0.044 ± 0.001 |
| 6 | P18:1-18:1 | C44H84O7PN | 776.61 | 0.046 ± 0.001 | 0.043 ± 0.001 |
| 7 | P18:2-18:2/P16:0-20:4/P20:4-16:0 | C44H80O7PN | 772.58 | 0.047 ± 0.001 | 0.045 ± 0.001 |
| 8 | A16:0-16:0 | C40H82O7PN | 726.60 | 0.059 ± 0.001 | 0.058 ± 0.001 |
| 9 | P16:0-18:0/P18:0-16:0/A18:1-16:0 | C42H84O7PN | 752.61 | 0.062 ± 0.001 | 0.064 ± 0.001 |
| 10 | P18:1-16:0 | C42H82O7PN | 750.60 | 0.071 ± 0.001 | 0.070 ± 0.001 |
| 11 | D16:1-16:0/D14:1-18:0 | C40H78O8PN | 738.56 | 0.072 ± 0.001 | 0.070 ± 0.001 |
| 12 | P18:2-20:1/P20:1-18:2/A18:0-20:4 | C46H86O7PN | 802.63 | 0.117 ± 0.002 | 0.120 ± 0.001 |
| 13 | P18:0-22:6/P18:1-22:5 | C48H84O7PN | 824.61 | 0.202 ± 0.005 | 0.209 ± 0.012 |
| 14 | D16:1-18:2 | C42H78O8PN | 762.56 | 0.205 ± 0.001 | 0.216 ± 0.001 |
| 15 | P18:1-22:6 | C46H90O8PN | 822.66 | 0.211 ± 0.001 | 0.221 ± 0.005 |
| 16 | D16:0-18:0 | C42H84O8PN | 768.61 | 0.260 ± 0.003 | 0.221 ± 0.005 |
| 17 | D18:0-20:3 | C46H86O8PN | 818.63 | 0.328 ± 0.006 | 0.273 ± 0.010 |
| 18 | P18:1-18:0 | C44H86O7PN | 778.63 | 0.347 ± 0.005 | 0.316 ± 0.008 |
| 19 | D18:2-18:3/D16:1-20:4 | C44H78O8PN | 786.56 | 0.359 ± 0.005 | 0.337 ± 0.007 |
| 20 | D18:0-18:1 | C44H86O8PN | 794.63 | 0.746 ± 0.003 | 0.758 ± 0.005 |
| 21 | D18:1-18:2/D16:0-20:3 | C44H82O8PN | 790.59 | 0.953 ± 0.013 | 0.808 ± 0.020 |
| 22 | D18:1-22:6/D18:2-22:5 | C48H82O8PN | 838.59 | 1.21 ± 0.02 | 1.18 ± 0.04 |
| 23# | D16:0-16:0 | C40H80O8PN | 740.58 | 1.65 ± 0.01 | 1.81 ± 0.01 |
| 24# | D18:0-18:2/D18:1-18:1 | C44H84O8PN | 792.61 | 2.37 ± 0.02 | 2.19 ± 0.03 |
| 25# | D16:0-18:1 | C42H82O8PN | 766.59 | 2.55 ± 0.02 | 2.59 ± 0.04 |
| 26# | D16:0-18:2 | C42H80O8PN | 764.58 | 3.07 ± 0.01 | 2.99 ± 0.01 |
| 27# | D18:2-20:2/D18:0-20:4 | C46H84O8PN | 816.61 | 4.59 ± 0.01 | 4.71 ± 0.04 |
| 28# | D18:2-18:2/D16:0-20:4 | C44H80O8PN | 788.58 | 4.68 ± 0.02 | 4.54 ± 0.02 |
| 29# | D18:2-22:6 | C48H80O8PN | 836.58 | 5.26 ± 0.01 | 4.95 ± 0.02 |
| 30# | D14:1-14:1 (IS) | C36H68O8PN | 680.48 | 24.00 | 24.00 |
| 31# | D18:0-22:6 | C48H84O8PN | 840.61 | 22.78 ± 0.05 | 23.52 ± 0.12 |
| 32# | D16:0-22:6/D18:2-20:4 | C46H80O8PN | 812.58 | 28.86 ± 0.10 | 28.64 ± 0.11 |
The molecular species of PtdCho are listed in the ascending order of their contents in a lipid extract of mouse myocardium. The identities were identified using multi-dimensional mass spectrometric analyses as described.15,16 The prefix “A”, “D”, and “P” stand for alkyl-acyl (i.e., plasmanyl-), diacyl (i.e., phosphatidyl-), alkenyl-acyl (plasmenyl-) species, respectively. “IS” denotes internal standard. The symbol # indicates those which were quantitated by using a survey scan and were used as standards in the second step of quantitation. The results are expressed in nmol/mg of protein and represent the mean ± SD from five different injections of an identical sample.
Table 2.
Contents of ethanolamine glycerophospholipid molecular species of an identical lipid extract determined using both an ion source interface and a nanomatea
| No. | Molecular species | Formula | Monoisotopic mass of [M−H]− | Content determined using ion source | Content determined using nanomate |
|---|---|---|---|---|---|
| 1 | A18:0-18:1 | C41H82O7PN | 730.58 | 0.0043 ± 0.0002 | 0.0045 ± 0.0003 |
| 2 | D16:1-18:2 | C39H72O8PN | 712.49 | 0.0056 ± 0.0004 | 0.0061 ± 0.0005 |
| 3 | P18:0-22:2 | C45H86O7PN | 782.61 | 0.0067 ± 0.0003 | 0.0058 ± 0.0004 |
| 4 | D16:0-18:1 | C39H76O8PN | 716.52 | 0.0082 ± 0.0003 | 0.0074 ± 0.0004 |
| 5 | D18:0-20:3/D18:1-20:2/D16:0-22:3 | C43H80O8PN | 768.55 | 0.0093 ± 0.0004 | 0.0088 ± 0.0003 |
| 6 | P20:1-18:1/P18:1-20:1 | C43H82O7PN | 754.58 | 0.0098 ± 0.0003 | 0.0092 ± 0.0004 |
| 7 | D20:0-20:3/D18:0-22:3 | C45H84O8PN | 796.59 | 0.0103 ± 0.0002 | 0.0100 ± 0.0003 |
| 8 | D14:1-22:6 | C41H68O8PN | 732.46 | 0.0108 ± 0.0003 | 0.0105 ± 0.0003 |
| 9 | P20:0-18:0/P18:0-20:0 | C43H86O7PN | 758.48 | 0.0112 ± 0.0004 | 0.0108 ± 0.0003 |
| 10 | D18:1-18:2/D16:0-20:3 | C41H76O8PN | 740.52 | 0.0124 ± 0.0003 | 0.0126 ± 0.0004 |
| 11 | P18:0-20:3 | C43H80O7PN | 752.56 | 0.0171 ± 0.0060 | 0.0386 ± 0.0062 |
| 12 | P18:0-18:1/P16:0-20:1 | C41H80O7PN | 728.56 | 0.0454 ± 0.0047 | 0.0385 ± 0.0061 |
| 13 | D16:1-20:4 | C41H72O8PN | 736.49 | 0.0473 ± 0.0007 | 0.0357 ± 0.0008 |
| 14 | P18:1-16:0/P16:0-18:1 | C39H76O7PN | 700.53 | 0.0483 ± 0.0006 | 0.0508 ± 0.0006 |
| 15 | A20:0-20:4/P18:0-22:3 | C45H84O7PN | 780.59 | 0.0499 ± 0.0006 | 0.0536 ± 0.0006 |
| 16 | P16:1-20:4/P14:0-22:5 | C41H72O7PN | 720.50 | 0.0713 ± 0.0074 | 0.0654 ± 0.0057 |
| 17 | P14:0-22:6 | C41H70O7PN | 718.48 | 0.101 ± 0.008 | 0.132 ± 0.011 |
| 18 | P18:0-22:4/P20:0-20:4/P18:1-22:3 | C45H82O7PN | 778.58 | 0.112 ± 0.004 | 0.129 ± 0.006 |
| 19 | D16:0-20:4/D18:2-18:2 | C41H74O8PN | 738.51 | 0.132 ± 0.013 | 0.151 ± 0.013 |
| 20 | P18:1-18:1/P18:0-18:2/P16:0-20:2 | C41H78O7PN | 726.54 | 0.145 ± 0.003 | 0.133 ± 0.003 |
| 21 | D16:2-20:4/D14:1-22:5 | C41H70O8PN | 734.48 | 0.181 ± 0.004 | 0.181 ± 0.004 |
| 22 | P16:0-20:3/P18:1-18:2 | C41H76O7PN | 724.53 | 0.228 ± 0.002 | 0.223 ± 0.004 |
| 23 | P16:0-18:2 | C39H74O7PN | 698.51 | 0.326 ± 0.008 | 0.318 ± 0.009 |
| 24 | P18:0-20:4/P16:0-22:4/P18:1-20:3 | C43H78O7PN | 750.54 | 0.424 ± 0.014 | 0.480 ± 0.018 |
| 25 | P18:2-22:6/D18:1-20:1 | C45H74O7PN | 770.51 | 0.648 ± 0.006 | 0.760 ± 0.016 |
| 26 | D18:1-20:4/D16:0-22:5 | C43H76O8PN | 764.52 | 0.683 ± 0.011 | 0.725 ± 0.014 |
| 27* | D18:0-18:2/D18:1-18:1/D16:0-20:2 | C41H78O8PN | 742.54 | 0.735 ± 0.008 | 0.690 ± 0.013 |
| 28* | D18:0-18:1/D16:0-20:1 | C41H80O8PN | 744.55 | 0.809 ± 0.023 | 0.712 ± 0.040 |
| 29 | P18:0-22:5/P18:1-22:4 | C45H80O7PN | 776.56 | 0.868 ± 0.014 | 0.780 ± 0.022 |
| 30** | P16:0-20:4 | C41H74O7PN | 722.51 | 1.04 ± 0.02 | 0.956 ± 0.018 |
| 31 | D16:1-22:6 | C43H72O8PN | 760.49 | 1.89 ± 0.03 | 1.36 ± 0.03 |
| 32 | P18:1-20:4/P16:0-22:5 | C43H76O7PN | 748.53 | 2.49 ± 0.03 | 1.98 ± 0.03 |
| 33 | D18:2-22:6 | C45H74O8PN | 786.51 | 4.22 ± 0.03 | 4.06 ± 0.06 |
| 34** | P18:1-22:6/D18:0-20:1 | C45H76O7PN | 772.53 | 4.32 ± 0.05 | 3.59 ± 0.03 |
| 35 | D18:0-22:5/D18:1-22:4 | C45H80O8PN | 792.55 | 4.48 ± 0.05 | 4.10 ± 0.06 |
| 36* | D18:0-20:4/D16:0-22:4 | C43H78O8PN | 766.54 | 5.02 ± 0.05 | 4.14 ± 0.07 |
| 37* | D18:1-22:6 | C45H76O8PN | 788.52 | 5.50 ± 0.03 | 5.61 ± 0.03 |
| 38** | P18:0-22:6/P18:1-22:5/D18:0-20:0 | C45H78O7PN | 774.54 | 6.25 ± 0.03 | 5.70 ± 0.05 |
| 39** | P16:0-22:6/D18:0-18:0/P18:2-20:4 | C43H74O7PN | 746.51 | 8.68 ± 0.07 | 7.89 ± 0.04 |
| 40* | D16:0-22:6 | C43H74O8PN | 762.51 | 11.26 ± 0.06 | 11.18 ± 0.08 |
| 41 | D16:1-16:1 (IS) | C37H70O8PN | 686.48 | 24.00 | 24.00 |
| 42* | D18:0-22:6/D18:1-22:5 | C45H78O8PN | 790.54 | 25.92 ± 0.16 | 26.06 ± 0.14 |
The molecular species of PtdEtn are listed in the ascending order of their contents in a lipid extract of mouse myocardium. The identities were determined using multi-dimensional mass spectrometric analyses as described.15,16 The prefixes ‘A’, ‘D’, and ‘P’ stand for alkyl-acyl (i.e., plasmanyl-), diacyl (i.e., phosphatidyl-), alkenyl-acyl (plasmenyl-) species, respectively. ‘IS’ denotes internal standard.
The asterisk indicates the diacyl PtdEtn molecular species which were quantitated by using a survey scan and were used as standards in the second step of quantitation of low-abundance and/or overlapping diacyl PtdEtn molecular species.
The asterisks indicates the plasmalogen PtdEtn molecular species which were quantitated by using a survey scan and were used as standards in the second step of quantitation of low-abundance and/or overlapping plasmalogen PtdEtn molecular species. The results are expressed in nmol/mg of protein and represent the mean ± SD from five different injections of an identical sample.
Figure 3.
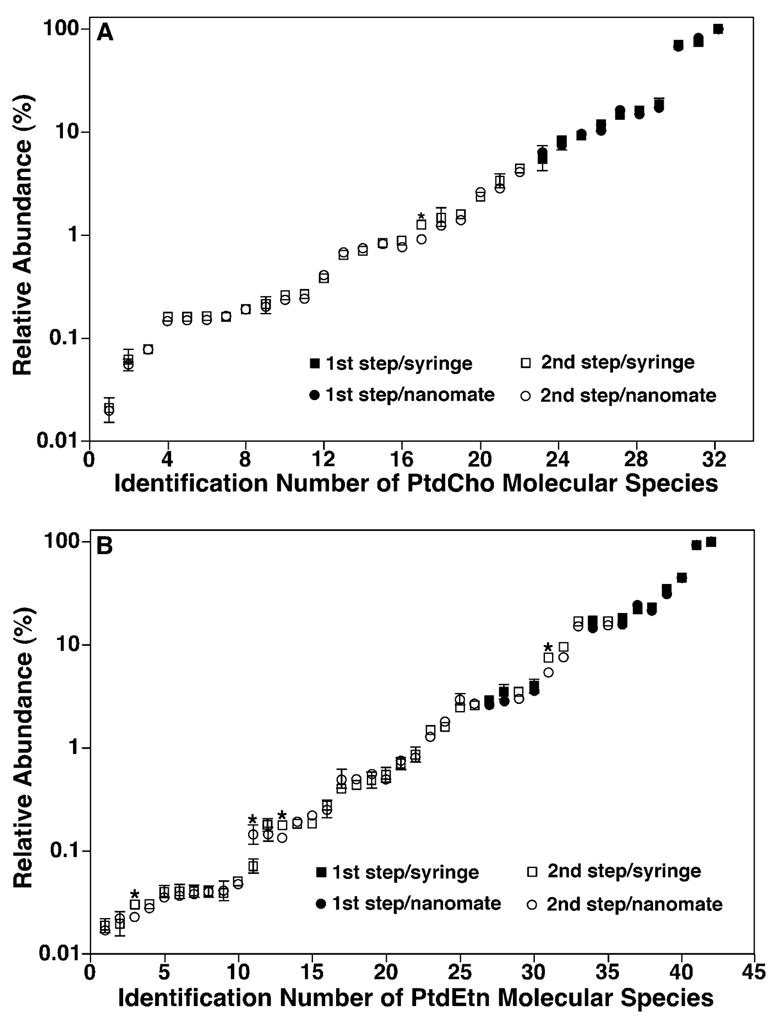
Comparison of the relative contents of individual molecular species of choline and ethanolamine glycerophospholipids present in the lipid extracts of mouse myocardium using either a syringe-pump-driven interface or a nanomate device. The levels of individual PtdCho (A) and PtdEtn (B) molecular species in the lipid extracts of mouse myocardium were determined by using either a nanomate device (circles) or a syringe-pump-driven interface (squares). The levels of the relatively abundant molecular species of both lipid classes (solid symbols) were determined from the survey scans in the positive- and negative-ion modes, respectively, in the presence of a small amount of LiOH (i.e., the first step of quantitation) by comparison to their respective internal standards. The levels of the low-abundance molecular species of both lipid classes (open symbols) were determined using ratiometric comparisons in the second step by employing endogenous molecular species whose contents were determined in the first step as standards (solid symbols). Note that some error bars are within the symbols. *p <0.05 indicating the significant differences of the determined levels between the interfaces. The numbers on the x-axis correspond to those used in Tables 1 and 2, respectively.
Specifically, the levels of the relatively abundant and non-overlapping molecular species of both lipid classes were directly determined from the survey scans shown in Fig. 2 in comparison to their respective internal standard (i.e., the first step of quantitation). The levels of the low-abundance and/ or overlapping molecular species of both lipid classes were determined with a second step by using selected molecular species that were determined in the first step as internal standards, as indicated in Tables 1 and 2. A neutral loss scan of 183 u (corresponding to phosphocholine) was used to determine the low-abundance PtdCho molecular species in the second step of quantitation as previously described4 by using original internal standard (i.e., di14:1 PtdCho) as well as other determined molecular species as standards (Fig. 3 and Table 1). Similarly, a neutral loss scan of 222 u (corresponding to the Fmoc moiety) from Fmoc-derived PtdEtn molecular species was used to determine the low-abundance and/or overlapping PtdEtn molecular species in the second step of quantitation as previously described.27 It should be emphasized that the fragmentation kinetics of ether-containing subclasses is very different from their diacyl counterparts after collision-induced dissociation (CID). The effects of this factor on accurate quantitation of a lipid class that contains multiple subclasses must be considered in the second step of quantitation. We employed subclass-specific standards (Fig. 3 and Table 2) to determine the content of low-abundance molecular species of each subclass after the standards were quantitated in the first step using a survey scan in which the ionization efficiency of molecular species in the different subclasses of a class was essentially identical. Specifically, the content of plasmalogen molecular species was determined by using abundant plasmalogen molecular species as standards in the second step (Table 2).
Previous studies from different laboratories have demonstrated that the ionization efficiency of individual lipid molecular species of a class at the low concentration region is essentially identical after correction for the different 13 C-isotopic distribution.13,24,28–30 However, for quantitative analysis of individual lipid molecular species by using selected internal standards, it is necessary to determine the linear dynamic range which defines the concentration range in which the determined variable is linearly correlated with concentration. There exist multiple types of linear dynamic range comparisons. The first type is the dynamic range within which the concentration of each individual species of interest is linearly correlated with the absolute value of a determined variable. For the mass spectrometric analysis of lipids, the dynamic range defines the relationship between ion counts of a species and the concentration of this species. This linear dynamic range is present in over a 1000-fold in the low-concentration region in lipid analysis of appropriately diluted extracts as confirmed by multiple studies.24,28–32
Another measure of dynamic range is the relative peak intensity (or area) ratio of an internal standard vs. the individual molecular species of interest. A ratio is determined by direct comparison between ion peak intensities in a mass spectrum or in the extracted ion peak area ratio in the case of MS analysis coupled with a chromatograph. Due to the presence of background noise (e.g., chemical noise) and baseline drift (i.e., instrument stability) in some cases, an approximately 100-fold linear dynamic range (from 0.1 to 10 of the ratio) of this measure can be obtained.33 However, with the second step of quantitation as described above, this linear dynamic range can be further extended to over 1000-fold.15,33
Since the levels of individual lipid molecular species in a lipid class of interest in a variety of lipid extracts of biological samples were varied, the nearly identical ratios of these multiple individual lipid molecular species and their constant ratio to their class-specific internal standard determined with both ionization modalities indicate that: (1) quantitation could be achieved using a microfluidics-chip-based ion source with a comparable accuracy of that obtained with a syringe-pump-driven interface; (2) the linear dynamic range of shotgun lipidomics with both interfaces was robust; and (3) the reproducibility of lipid analysis by shotgun lipidomics was very high using either microfluidic injection into the mass analyzer or syringe-pump-driven capillary interfaces.
Microfluidics-based ionization extends the utility of multi-dimensional MS-based shotgun lipidomics
It is well known that introduction of a nanospray can greatly enhance the ionization efficiency of many types of compounds.34 Nanospray ionization MS has been successfully employed for lipid analyses35 and the nanomate device has also been used for other types of shotgun lipidomics approaches.12,19,20 However, intrasource separation and MDMS-based shotgun lipidomics employing a nanospray ion source has been hindered since the presence of LiOH (which is essential for intrasource separation/selective ionization as discussed previously in detail4) frequently clogs the capillary tubes in the sample inlet and/or the spray tip. Moreover, stable ionization is also required during the period of the entire MDMS data accumulation array. Prominent examples include the quantitative analyses of triacylglycerol molecular species4,14 and the determination of the regiospecificity of phospholipids through comparisons of the ion intensities of fatty acyl carboxylates13,36 in a MDMS analytic approach. Therefore, we examined whether the ionization produced from a chip-based ion source was sufficiently stable to allow accurate quantitative analyses of lipid molecular species during the time frame required for shotgun lipidomics.
We examined the stability of ionization during direct infusion of a diluted mouse myocardial lipid extract (<50 pmol total lipids/μL) in the presence of a small amount of LiOH (approximately 25 pmol/μL) in both positive- and negative-ion modes through a nanomate device. We also examined the suitability of different chip types available for the nanomate device for lipid analysis. The results demonstrated that a D-chip, which possesses a relatively smaller nozzle diameter than that of an A-chip (which is commonly used for proteomic analysis), was most useful for lipid analysis under the conditions employed. Figure 4 shows the total ion chromatograms each of which was obtained from a 5 μL diluted lipid solution in the presence of LiOH for the duration of the 50-min experiment. The chromatograms demonstrated that (1) the effects of the presence of LiOH on clogging were very minimal under experimental conditions; (2) the ionization stability after an initial equilibration period was excellent for the entire period of the analysis; and (3) ionization from a small volume of a lipid solution (i.e., 5 μL) through a nanomate device was stable for at least 50 min. Therefore, this study indicates that (1) a nanomate device is suitable for the intrasource separation/selective ionization and MDMS-based shotgun lipidomics; (2) global lipidomics analyses can be achieved with diminutive amounts of material using microfluidics-based ionization; and (3) quantitative analyses of lipids can be accomplished using the device in a QqQ instrument since the stable ionization in the absence of pulsed ionization methods provides a solid foundation for quantitative analyses of lipids in theory and in practice.
Figure 4.

ESI mass spectrometric total ion chromatograms of diluted extracts of mouse myocardial lipids in both positive-and negative-ion modes. Total ion counts of the ionized lipid solution in both positive (A) and negative (B) ion modes were acquired in the mass range of m/z 400–1000 at a scan rate of 1 s/scan for a total of 50 min.
CONCLUSIONS
The utility of microfluidics and chip-based ionization in intrasource separation and MDMS-based shotgun lipidomics has been demonstrated using multiple criteria. The microfluidics-based ionization improved the intrasource separation/selective ionization and quantitative analysis with a smaller sample size relative to the conventional syringe-pump-driven interface employing MDMS-based shotgun lipidomics. In practice, the utilization of microfluidics and chip-based ionization in the nanomate device greatly facilitated the automated performance of MDMS-based shotgun lipidomics and establishes a foundation for the automated high-throughput platform for global analysis of cellular lipidomes.
Acknowledgments
This work was supported by National Institutes of Health Grant P01 HL57278 and National Institute on Aging/National Institute for Diabetes and Digestive Diseases Grant R01 AG31675. The authors are grateful to Ms Zhongdan Zhao for her technical help.
Contract/grant sponsor: National Institutes of Health; contract/grant number: P01 HL57278.
Contract/grant sponsor: National Institute on Aging and National Institute for Diabetes and Digestive Diseases; contract/grant number: R01 AG31675.
References
- 1.Han X, Gross RW. J Lipid Res. 2003;44:1071. doi: 10.1194/jlr.R300004-JLR200. [DOI] [PubMed] [Google Scholar]
- 2.Lagarde M, Geloen A, Record M, Vance D, Spener F. Biochim Biophys Acta. 2003;1634:61. doi: 10.1016/j.bbalip.2003.11.002. [DOI] [PubMed] [Google Scholar]
- 3.Wenk MR. Nat Rev Drug Discov. 2005;4:594. doi: 10.1038/nrd1776. [DOI] [PubMed] [Google Scholar]
- 4.Han X, Gross RW. Mass Spectrom Rev. 2005;24:367. doi: 10.1002/mas.20023. [DOI] [PubMed] [Google Scholar]
- 5.Walker JM, Krey JF, Chen JS, Vefring E, Jahnsen JA, Bradshaw H, Huang SM. Prostaglandins Other Lipid Mediat. 2005;77:35. doi: 10.1016/j.prostaglandins.2004.09.017. [DOI] [PubMed] [Google Scholar]
- 6.Serhan CN. Prostaglandins Other Lipid Mediat. 2005;77:4. doi: 10.1016/j.prostaglandins.2004.09.016. [DOI] [PubMed] [Google Scholar]
- 7.Han X. Front Biosci. 2007;12:2601. doi: 10.2741/2258. [DOI] [PMC free article] [PubMed] [Google Scholar]
- 8.Ivanova PT, Milne SB, Forrester JS, Brown HA. Mol Interv. 2004;4:86. doi: 10.1124/mi.4.2.6. [DOI] [PubMed] [Google Scholar]
- 9.Welti R, Shah J, Li W, Li M, Chen J, Burke JJ, Fauconnier ML, Chapman K, Chye ML, Wang X. Front Biosci. 2007;12:2494. doi: 10.2741/2250. [DOI] [PubMed] [Google Scholar]
- 10.Schiller J, Suss R, Fuchs B, Muller M, Zschornig O, Arnold K. Front Biosci. 2007;12:2568. doi: 10.2741/2255. [DOI] [PubMed] [Google Scholar]
- 11.Albert CJ, Anbukumar DS, Monda JK, Eckelkamp JT, Ford DA. Front Biosci. 2007;12:2750. doi: 10.2741/2269. [DOI] [PMC free article] [PubMed] [Google Scholar]
- 12.Ejsing CS, Duchoslav E, Sampaio J, Simons K, Bonner R, Thiele C, Ekroos K, Shevchenko A. Anal Chem. 2006;78:6202. doi: 10.1021/ac060545x. [DOI] [PubMed] [Google Scholar]
- 13.Han X, Gross RW. Expert Rev Proteomics. 2005;2:253. doi: 10.1586/14789450.2.2.253. [DOI] [PubMed] [Google Scholar]
- 14.Han X, Gross RW. Anal Biochem. 2001;295:88. doi: 10.1006/abio.2001.5178. [DOI] [PubMed] [Google Scholar]
- 15.Han X, Yang J, Cheng H, Ye H, Gross RW. Anal Biochem. 2004;330:317. doi: 10.1016/j.ab.2004.04.004. [DOI] [PubMed] [Google Scholar]
- 16.Cheng H, Jiang X, Han X. J Neurochem. 2007;101:57. doi: 10.1111/j.1471-4159.2006.04342.x. [DOI] [PMC free article] [PubMed] [Google Scholar]
- 17.Jiang X, Cheng H, Yang K, Gross RW, Han X. Anal Biochem. 2007;371:135. doi: 10.1016/j.ab.2007.08.019. [DOI] [PMC free article] [PubMed] [Google Scholar]
- 18.Ejsing CS, Moehring T, Bahr U, Duchoslav E, Karas M, Simons K, Shevchenko A. J Mass Spectrom. 2006;41:372. doi: 10.1002/jms.997. [DOI] [PubMed] [Google Scholar]
- 19.Schwudke D, Oegema J, Burton L, Entchev E, Hannich JT, Ejsing CS, Kurzchalia T, Shevchenko A. Anal Chem. 2006;78:585. doi: 10.1021/ac051605m. [DOI] [PubMed] [Google Scholar]
- 20.Schwudke D, Hannich JT, Surendranath V, Grimard V, Moehring T, Burton L, Kurzchalia T, Shevchenko A. Anal Chem. 2007;79:4083. doi: 10.1021/ac062455y. [DOI] [PubMed] [Google Scholar]
- 21.Han X, Yang J, Yang K, Zhao Z, Abendschein DR, Gross RW. Biochemistry. 2007;46:6417. doi: 10.1021/bi7004015. [DOI] [PMC free article] [PubMed] [Google Scholar]
- 22.Han X, Yang K, Yang J, Fikes KN, Cheng H, Gross RW. J Am Soc Mass Spectrom. 2006;17:264. doi: 10.1016/j.jasms.2005.11.003. [DOI] [PubMed] [Google Scholar]
- 23.Han X, Gubitosi-Klug RA, Collins BJ, Gross RW. Biochemistry. 1996;35:5822. doi: 10.1021/bi952927v. [DOI] [PubMed] [Google Scholar]
- 24.Hermansson M, Uphoff A, Kakela R, Somerharju P. Anal Chem. 2005;77:2166. doi: 10.1021/ac048489s. [DOI] [PubMed] [Google Scholar]
- 25.Han X, Yang K, Yang J, Cheng H, Gross RW. J Lipid Res. 2006;47:864. doi: 10.1194/jlr.D500044-JLR200. [DOI] [PMC free article] [PubMed] [Google Scholar]
- 26.Han X, Cheng H, Mancuso DJ, Gross RW. Biochemistry. 2004;43:15584. doi: 10.1021/bi048307o. [DOI] [PubMed] [Google Scholar]
- 27.Han X, Yang K, Cheng H, Fikes KN, Gross RW. J Lipid Res. 2005;46:1548. doi: 10.1194/jlr.D500007-JLR200. [DOI] [PMC free article] [PubMed] [Google Scholar]
- 28.Han X, Gross RW. Proc Natl Acad Sci USA. 1994;91:10635. doi: 10.1073/pnas.91.22.10635. [DOI] [PMC free article] [PubMed] [Google Scholar]
- 29.DeLong CJ, Baker PRS, Samuel M, Cui Z, Thomas MJ. J Lipid Res. 2001;42:1959. [PubMed] [Google Scholar]
- 30.Koivusalo M, Haimi P, Heikinheimo L, Kostiainen R, Somerharju P. J Lipid Res. 2001;42:663. [PubMed] [Google Scholar]
- 31.Kim HY, Wang TC, Ma YC. Anal Chem. 1994;66:3977. doi: 10.1021/ac00094a020. [DOI] [PubMed] [Google Scholar]
- 32.Lehmann WD, Koester M, Erben G, Keppler D. Anal Biochem. 1997;246:102. doi: 10.1006/abio.1996.9941. [DOI] [PubMed] [Google Scholar]
- 33.Han X, Cheng H. J Lipid Res. 2005;46:163. doi: 10.1194/jlr.D400022-JLR200. [DOI] [PubMed] [Google Scholar]
- 34.Warriner RN, Craze AS, Games DE, Lane SJ. Rapid Commun Mass Spectrom. 1998;12:1143. [Google Scholar]
- 35.Brugger B, Erben G, Sandhoff R, Wieland FT, Lehmann WD. Proc Natl Acad Sci USA. 1997;94:2339. doi: 10.1073/pnas.94.6.2339. [DOI] [PMC free article] [PubMed] [Google Scholar]
- 36.Han X, Gross RW. J Am Soc Mass Spectrom. 1995;6:1202. doi: 10.1016/1044-0305(95)00568-4. [DOI] [PubMed] [Google Scholar]