Fig. 4.
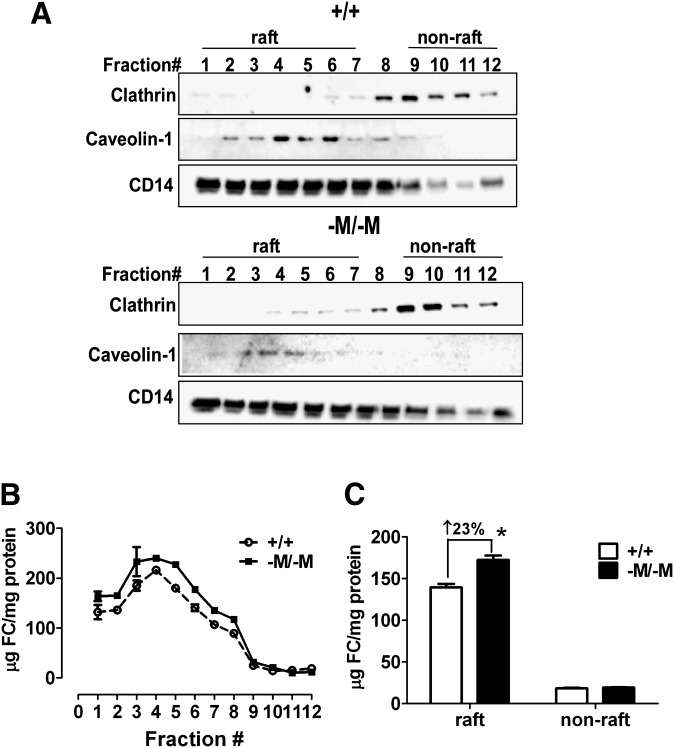
Macrophage ABCA1 deficiency results in an increase in lipid raft FC. A: Lipid raft and nonraft fractions were isolated using a nondetergent method. Each fraction was analyzed by Western blotting for the indicated proteins. B: FC and protein concentrations in each fraction in panel A were measured and the results were plotted as µg cholesterol/mg protein. Mean ± range (n = 2). Results are representative of two independent experiments. C: Data from panel B are presented as raft (fractions 1–7) and nonraft (fractions 9–12) cholesterol content for each genotype. * P < 0.05, compared with WT. +/+: WT; -M/-M: Abca1-M/-M.

