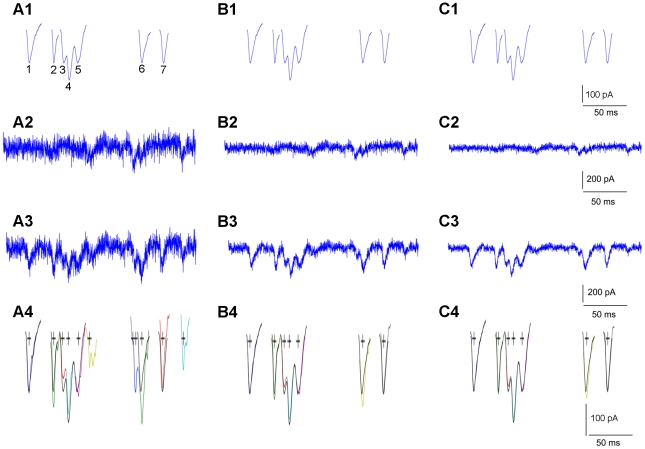
Figure 3. Simulated neural data and detection examples.
A1, B1 and C1 are the same set of test templates (EPSC examples) acquired from experimental recordings, normalized to their peak amplitudes. Within this set of templates, simulated EPSCs of 1, 2, 6 and 7 are distributed as individual, non-overlapping events, while simulated EPSCs of 3, 4 and 5 overlap and take place as one complex and overlapping response. A2, B2 and C2 are the baseline spontaneous activity (noise) trace, with noise variances scaled to the test template amplitude with different SNRs. A3, B3 and C3 are simulated data traces by superimposing the template events with different degrees of noise. A4, B4 and C4 show EPSC detection results (color coded, with the estimated arrival time marked as ‘+’) through convolving the simulated data traces in A3, B3 and C3 with 10 matched filters, respectively. The original EPSC template events (black, as shown in A1, B1, C1), are plotted for evaluating software detection. The detection procedure uses a detection threshold at μ+3σ (3 standard deviations from the mean of the maximal template convolution values of the filters), and uses an amplitude cutoff of 60 pA, which is about 25% of the peak values of the individual test templates.

