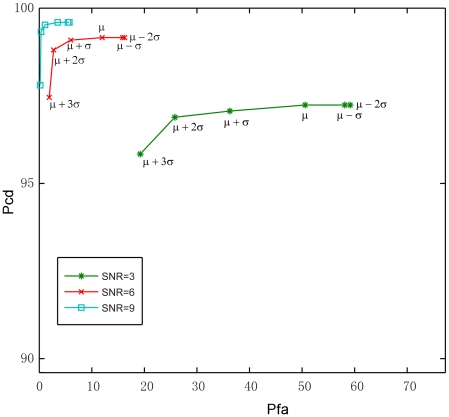
Figure 4. Detection performance evaluation on simulated data by using Receiver Operating Characteristic (ROC) curve analysis.
The horizontal axis shows the probability of false alarm (Pfa), and the vertical axis shows the probability of correct detection (Pcd). Each ROC curve represents the software PSC detection performance at a fixed SNR (3, 6 or 9) with different detection thresholds. The detection thresholds ranges from −2σ to 3σ from the mean of the maximal template convolution values. The ROC curve for each combination of the detection threshold and SNR was calculated by averaging the performance over 200 trials.

