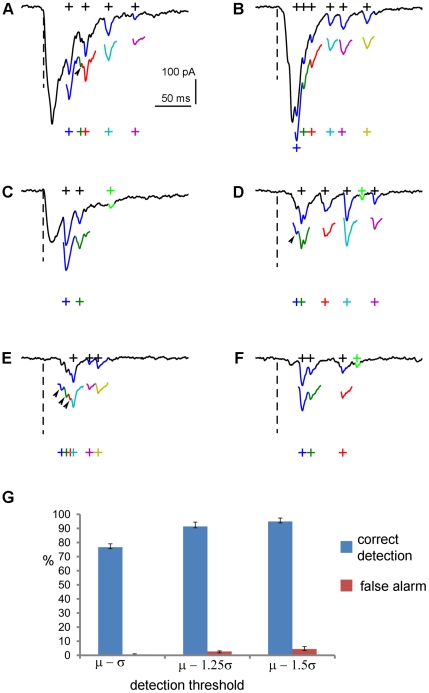
Figure 5. Analysis of experimental data through matched filtering.
A–F: Typical examples of detection and extraction of photostimulation-evoked EPSCs, in comparison with human visual detection. The raw data traces were shown in solid back, with the overlaying segments of EPSCs (blue) identified by an experienced human operator. The black crosses indicate the center of the human selected EPSCs. The color-coded segments shown below the raw data traces are detected and individually extracted EPSCs through matched filtering, with the respective crosses indicating the detected EPSC centers. The arrows and arrow heads point to the extra events correctly detected by the software, but missed by the human. The weak EPSCs (with the amplitudes of <20 pA, about the spontaneous EPSC level) (green) identified by the human are missed by the automated detection, because of the pre-set amplitude cutoff (20 pA). G: the bar graph summarizing the percentage of correct detection and percentage of false alarm of the automated detection of EPSCs across different data sets (N = 3), using the same filter bank at multiple detection thresholds (μ−1σ, μ−1.25σ and μ−1.5σ). The values are presented as mean ± SE. Each data set contained more than 200 photostimulation-evoked EPSCs, and the detection results were inspected and verified by a human operator.

