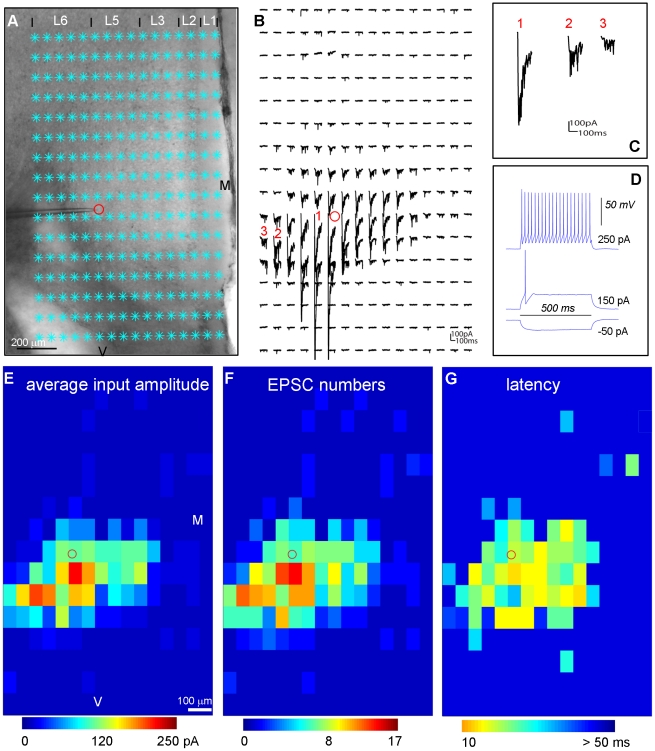
Figure 7. Excitatory input of local circuits to a fast-spiking (FS) inhibitory cell.
A–D are similarly formatted as in Figure 1. A shows a mouse prefrontal cortical slice image with the superimposed photostimulation sites (cyan stars) across all the cortical layers 1, 2, 3, 5 and 6, with a glass electrode recording from a fast spiking inhibitory interneuron in the border of layers 5 and 6 of the prelimbic area in prefrontal cortex. The red circle indicates the cell body location. M denotes medial, and V denotes ventral. B shows an array of photostimulation-evoked response traces from the locations shown in A, with the cell held at −70 mV in voltage clamp mode to detect inward excitatory synaptic input. Examples of photostimulation-evoked responses are illustrated by the traces of 1, 2 and 3, which are expanded and separately shown in C. Trace 1 is an example of direct response with over-riding synaptic responses. Traces 2 and 3 are typical examples of synaptic input responses of FS cells. D shows the FS cell's intrinsic firing pattern with its voltage response traces to current injections at different amplitudes of −50, 150 and 250 pA, respectively. E, F and G present the color-coded maps of average input amplitude, the EPSC numbers, and the first detected EPSC latency per site, respectively, for the data set shown in B.

