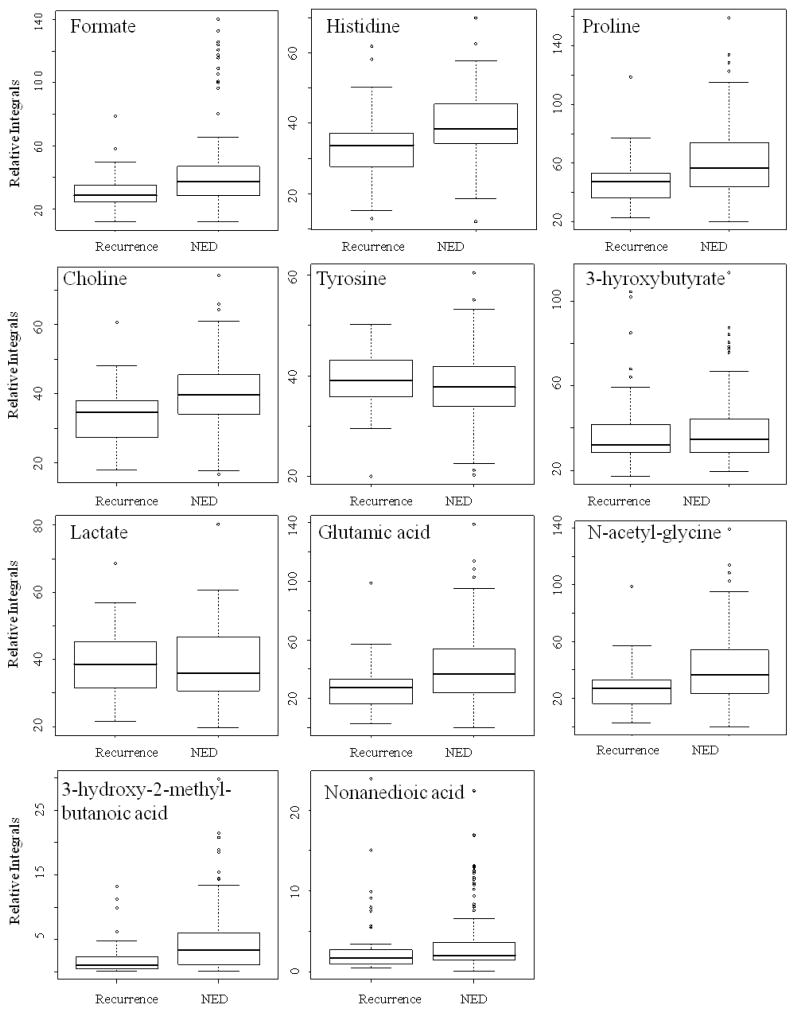
Figure 1.
Box and whisker plots illustrating the discrimination between Post and Within recurrence versus NED patients for all samples for the 7 NMR and the 4 GCxGC-MS markers. The horizontal line in the mid portion of the box represents the mean while the bottom and top boundaries of the boxes represent 25th and 75th percentiles, respectively. The lower and upper whiskers represent the 5th and 95th percentiles respectively, while the open circles represent outliers.

