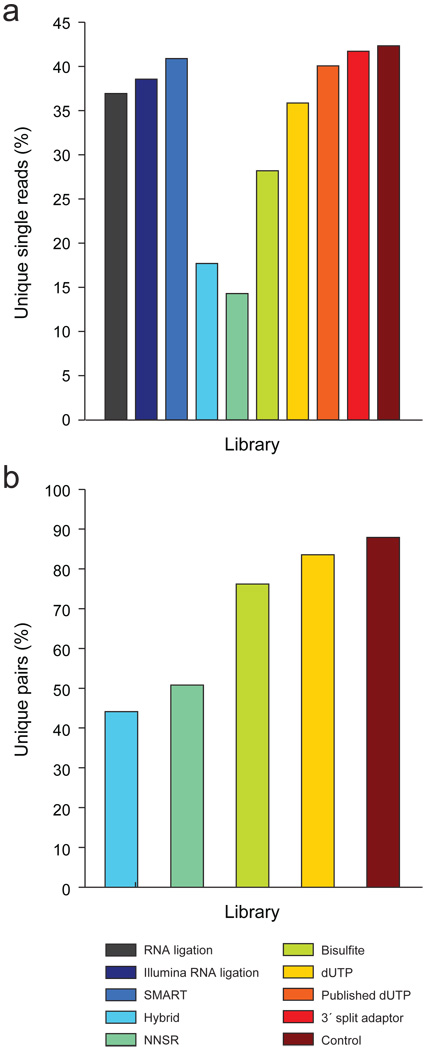
Figure 3. Complexity of single- and paired-end libraries.
Bar graphs comparing library complexity by the fraction of unique reads mapping out of the total number of mapped reads, when considering only single-mapped reads (a, all libraries) or uniquely mapped pairs (b, only paired-end libraries). Libraries are ordered as in Figure 1. Full data for all library variations are presented in Supplementary Table 2.

