

Abstract
It is important to gain a physical understanding of ion transport through the voltage-dependent anion channel (VDAC) because this channel provides primary permeation pathways for metabolites and electrolytes between the cytosol and mitochondria. We performed grand canonical Monte Carlo/Brownian dynamics (GCMC/BD) simulations to explore the ion transport properties of human VDAC isoform 1 (hVDAC1; PDB:2K4T) embedded in an implicit membrane. When the MD-derived, space-dependent diffusion constant was used in the GCMC/BD simulations, the current-voltage characteristics and ion number profiles inside the pore showed excellent agreement with those calculated from all-atom molecular-dynamics (MD) simulations, thereby validating the GCMC/BD approach. Of the 20 NMR models of hVDAC1 currently available, the third one (NMR03) best reproduces both experimental single-channel conductance and ion selectivity (i.e., the reversal potential). In addition, detailed analyses of the ion trajectories, one-dimensional multi-ion potential of mean force, and protein charge distribution reveal that electrostatic interactions play an important role in the channel structure and ion transport relationship. Finally, the GCMC/BD simulations of various mutants based on NMR03 show good agreement with experimental ion selectivity. The difference in ion selectivity between the wild-type and the mutants is the result of altered potential of mean force profiles that are dominated by the electrostatic interactions.
Introduction
The voltage-dependent anion channel (VDAC, also known as mitochondrial porin) in the outer membrane of mitochondria provides a permeation pathway for metabolites and mobile ions between the cytosol and mitochondria intermembrane region (1). VDACs are also involved in cell death by interacting with apoptotic proteins (2) and releasing apoptotic metabolites to the cytosol (3). Isoforms of VDAC have been found in eukaryotic cells of many different plant, yeast, and mammal species. As the name itself indicates, the gating and transport properties of VDAC are dependent on the transmembrane (TM) potential (4), in that it opens at low TM potential (|Vmp| < 30 mV) and is partially closed above the threshold. The open channel shows anion selectivity with higher ion conductance than the cation-selective (partially) closed channel. The average single-channel conductance of open-state VDACs in plant, yeast, mice, and human cells ranges from 0.4 nS to 0.6 nS in 0.1 M KCl solution, and from 3.9 nS to 4.5 nS in 1.0 M KCl solution (4). The permeability ratio (anion over cation) of the open-state VDAC is ∼2.0, as determined by the reversal potential of ∼12.0 mV measured in 1.0:0.1 M KCl asymmetric solution (4–6).
There are three isoforms of VDAC in mitochondria of human cells, which share 68–75% sequence identity (6). hVDAC1, the prototype of VDAC in human cells, forms an aqueous TM β-barrel pore whose inner diameter varies from 20 Å to 30 Å (7), and shares the common electrophysiological properties found in VDAC1 isoforms from other species. The three-dimensional structures of hVDAC1 have been determined by means of NMR (PDB:2K4T) (6) and a hybrid technique combining NMR and x-ray (PDB:2JK4) (8), and both structures show a TM β-barrel pore with 19 β-strands. The anion selectivity of hVDAC1 can be attributed to net positive charges in the pore-lining residues (17 acidic and 20 basic residues). Although all 20 NMR models (hereafter termed NMR01–NMR20 according to the model number in PDB:2K4T) satisfy the NMR observables, the reported NMR structures show quite different conformations. For example, the N-terminal region (residues 1–23), which includes a small α-helix (residues 6–10) that is believed to play a key role in channel gating as a voltage sensor (4), is located inside the pore, but its position in each model varies.
In this study, we aimed to characterize the relationship between the VDAC structure and its electrophysiological properties by calculating the ion conductance and selectivity of each NMR structure and the ensemble of the structures. Considering that several contradicting structural features can be observed by comparing the reported structures and models based on previous biochemical/functional studies (7,9), such a theoretical/computational characterization should be useful for validating the VDAC structures.
Computer simulations are useful tools for examining the detailed structure-function relationship of channel proteins. Although it is still challenging to study the ion permeation and selectivity of biological channels computationally, previous studies have successfully applied various computational techniques (10–12). In particular, using the x-ray structure of mouse VDAC (13), Choudhary et al. (14) recently performed Poisson-Nernst-Planck (PNP) continuum electrodiffusion calculations, and rationalized the VDAC anion selectivity in terms of ion transfer free energy across the channel. However, the PNP calculation resulted in an ∼2-fold larger conductance (1.06 nS in 0.1 M KCl) than the experimental data, which was attributed to the fact that the finite ion size effects and the direct ion-ion interactions were not included in the PNP calculation (15).
Therefore, to investigate ion transport through hVDAC1 NMR structures in both symmetric and asymmetric solutions, in this work, we used grand canonical Monte Carlo/Brownian dynamics (GCMC/BD) simulation (16,17), which includes direct ion-ion interactions with finite ion sizes and has been successfully applied to β-barrel pores such as OmpF (15) and α-Hemolysin (18). We first validated the GCMC/BD simulation by comparing the current-voltage characteristics and ion number profiles with those obtained from all-atom molecular dynamics (MD) simulations (19) under the same conditions. We then performed GCMC/BD simulations for all 20 hVDAC1 NMR structures and statistically analyzed electrophysiological properties such as the single-channel conductance and permeability ratio of individual NMR models and their ensemble. From the BD trajectories, we also characterized the ion permeation process in terms of free-energy barriers in the pore resulting from the ion-ion interactions, the charged residue distribution, and the pore size variation. Finally, we performed GCMC/BD simulations of single-point mutants to examine the structure-function relationship by determining the effect of mutation on the ion selectivity.
Materials and Methods
GCMC/BD simulation system setup
The GCMC/BD simulation system (Fig. 1) was constructed as follows: A 40-Å-thick implicit membrane with its normal along the Z axis was placed in the middle of an 80 × 80 × 90 Å3 box centered at the origin. Each hVDAC1 NMR structure was oriented with its pore axis parallel to the Z axis, its center of mass at Z = 0 Å, and its N- and C-termini facing the cis-side (cytosol, Z < 0). hVDAC1 spans from −20 Å to 20 Å in the Z-direction, with an outer diameter of ∼35 Å and inner diameter of ∼20 Å. The 5-Å-thick buffer regions were included at the top and bottom of the simulation box to mimic the constant concentration baths for mobile ions (K+ and Cl− in this work). The system consisted of three different dielectric regions: an ion-accessible solvent (water) region, a protein region, and a membrane region. The latter two are inaccessible to mobile ions. The dielectric constants for water, protein, and lipid were set to 80, 2, and 2, respectively (15,18,20). The bulk water dielectric constant was assigned in the pore region because of the relatively large pore size of hVDAC1. Although the protein dielectric constant may affect the macroscopic transport properties, as pointed out in other coarse-grained simulation studies (21,22), we used the most common protein dielectric constant of 2 (15,18,20), and there were negligible effects on ion conductance and ion distribution with the protein dielectric constant of 4 (data not shown). The reference of the TM potential (Vmp) is the cis-side (Z < 0), and thus the TM potential in this work is defined as Vmp = Vtrans − Vcis.
Figure 1.

BD simulation system, taken from a snapshot in a symmetric 0.1 M KCl solution. The hVDAC1 structure is aligned parallel to the Z direction and placed at the center of an implicit lipid membrane. The top trans bath (Z > 0) represents the intermembrane region (inside mitochondria), and the bottom cis one (Z < 0) represents the cytosol. K+ (magenta) and Cl− (green) are represented as spheres.
GCMC/BD simulation
We used the open-source GCMC/BD simulation program (16,17), which is freely available at http://thallium.bsd.uchicago.edu/RouxLab/gcmc.html. In GCMC/BD, only mobile ions are explicitly simulated. Water and membrane are treated as structureless continuum dielectric regions, and the channel protein atoms are modeled as fixed charges with finite atomic radii. Taking into account the spatial variation of the diffusion constant (Dα), the ion movement is described by the BD equation (23):
| (1) |
where rα, {rα}, W, and ζα are the position of ion α, the position of all ions in the system, the multi-ion potential of mean force (PMF), and the random Gaussian noise representing the frequent bombardment of water molecules, respectively. The multi-ion PMF is expressed as:
| (2) |
where ϕsf is the electrostatic potential from the fixed protein charges and Vmp, ϕrf is the reaction field potential arising from dielectric heterogeneity, Ucore is the core-repulsive steric potential to prevent ions from moving into ion-inaccessible regions, and uαγ describes the ion-ion interactions between ions α and γ, including the dielectric-screened Coulombic electrostatic interaction, van der Waals interaction, and water-mediated short-range interaction (15). Using the Poisson-Boltzmann (PB)/PNP program (available at http://thallium.bsd.uchicago.edu/RouxLab/pbeq.html), we calculated ϕsf, the parameters for ϕrf (20), and Ucore, and tabulated them on a rectangular grid with a grid spacing of 0.5 Å before running the main GCMC/BD simulation. Thus, we were able to efficiently calculate the multi-ion PMF in Eq. 2 and the corresponding force on each ion at each BD time step of 10 fs. In the buffer regions, we performed one GCMC step at every BD step to maintain the specified ion concentration according to the ion creation and annihilation probability. A detailed description of the GCMC/BD approach and its application to biological systems can be found in elsewhere (16,17). Because the conformation change during the voltage gating process of VDAC cannot be captured with the present GCMC/BD simulation using a fixed channel structure, a study of the voltage gating mechanism is beyond the scope of this work.
Diffusion constant
One of the most important physical parameters in the theoretical study of ion transport is the diffusion constant, which directly affects the ion transport rate in coarse-grained approaches such as BD (see Eq. 1) and PNP calculations. Several different approaches can be used to model the space-dependent diffusion constant of mobile ions in a physically restricted pore, including hydrodynamic ion-solvent modeling (18), fitting of measured current-voltage (I/V) curves (24), and direct calculation from MD trajectory (15).
We used the diffusion constant profile obtained from the MD simulations of NMR01 in 1.0 M KCl solution (see Fig. S1 in the Supporting Material; for further details, see Rui et al. (19)). The average scaling factor of the diffusion constant inside the pore (i.e., the diffusion constant inside the pore normalized by the bulk value) is 0.55 for both K+ and Cl−. However, the calculated bulk diffusion constants for both K+ and Cl− from the MD simulations are 0.30 Å2/ps and 0.29 Å2/ps, which are ∼1.5 times larger than experimental values (0.20 Å2/ps for both K+ and Cl−). The higher bulk diffusion constants resulted from the modified TIP3P water model used in the MD simulation with the particle mesh Ewald method (25), which is known to underestimate the solvent viscosity and hence overestimate the particle diffusion constants in solution (26). Therefore, we used MD-derived bulk diffusion constants in the comparison of BD and MD simulations, and the experimental bulk diffusion constants in the comparison of the BD simulations and experimental data, assuming the same scaling profile along the Z direction. A third-order polynomial function with a switching length of 17 Å was employed to approximate the diffusion constant between the bulk and pore regions (15).
Calculation of channel conductance and ion selectivity
The channel conductance (G = I/Vmp) can be calculated directly by counting the number of ions that cross the XY plane at Z = 0 at a given TM potential. In this work, we consider two symmetric KCl concentrations for conductance calculation: 1.0 M for comparison of BD and MD simulations (19), and 0.1 M for comparison of the BD simulations and experimental data. The simulation times were 100 ns for 1.0 M KCl and 400 ns for 0.1 M KCl.
Both the ratio of ion currents (e.g., ICl/IK) from a symmetric KCl solution and the permeability ratio from an asymmetric solution can be a measure of ion selectivity. Because it is still technically challenging to maintain an asymmetric bath condition in MD simulations and it is impractical to separate ion current components from the total current in experiments, the current (conductance) ratios from BD simulations were compared with those from MD simulations, and the permeability ratios (or the reversal potential) from BD simulations were compared with experimental data. The reversal potential (Vrev) was measured from an I/V curve as the potential at which the total current becomes zero. With the bath concentrations and reversal potential, the permeability ratio (p) can be estimated by the Goldman-Hodgkin-Katz equation (27):
| (3) |
We used a 10-fold KCl concentration gradient between cis- and trans-side baths (Ccis = 1.0 M and Ctrans = 0.1 M) for permeability calculations with the BD simulation time of 200 ns.
Results and Discussion
We performed GCMC/BD simulations (hereafter referred to as BD simulations for simplicity) of 1) the hVDAC1 NMR01 model in a symmetric 1.0 M KCl solution to compare with the MD simulation results (19); 2) all 20 NMR models in a symmetric 0.1 M KCl solution and an asymmetric 1.0:0.1 M KCl solution to calculate the single-channel conductance and ion selectivity, respectively; and 3) seven single-point mutants in an asymmetric 1.0:0.1 M KCl solution to explore the relationship between specific mutations and changes in ion selectivity. The BD simulation lengths were chosen to obtain statistically sufficient ion crossing events. We performed 10 independent BD runs at each condition to improve the statistics of the results by reducing the possibility of an anomalous initial condition as well as enhancing the simulation efficiency.
Comparison of BD and MD
Our BD simulation uses a hierarchical approach to closely reproduce key microscopic properties of ion transport, such as ion diffusion constant profiles and ion-ion interactions observed in MD simulation. Nonetheless, it is important to assess the efficacy of the coarse-grained BD simulation because various approximations are still used to enhance simulation efficiency in the BD approach, such as a (fixed dielectric) rigid channel structure, implicit solvent-based protein-ion interactions (i.e., grid-based steric and electrostatic potentials, including the reaction field in Eq. 2), and an implicit membrane bilayer. In this work, BD and MD results are compared in terms of the I/V relationship, the ion current (conductance) ratio, and ion number densities inside the pore. For the direct comparison with MD simulations, we used the MD-derived diffusion constants in the BD simulations, which are ∼1.5 times larger than the experimental values (see Materials and Methods).
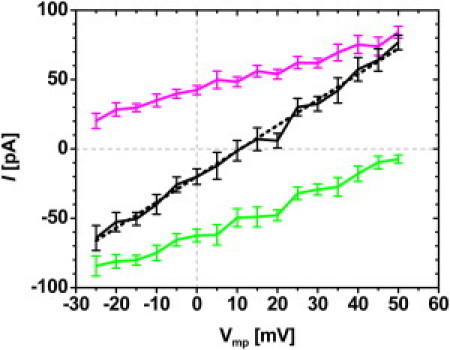
Fig. 2 compares the I/V curves from the BD and MD simulations of NMR01 in 1.0 M KCl solution with Vmp of 0, ±25, ±50, ±75, and ±100 mV. A 1.0 M KCl solution was used to enhance the sampling of ion transport events in the MD simulation. The I/V curves show excellent overall agreement between BD and MD for K+, Cl−, and total currents. The I/V curves from BD also show slight asymmetry (|I(−100 mV)| > |I(100 mV)|) as observed in MD simulation results, although the I/V relationship is symmetric at lower TM potentials up to ±50 mV. The average total conductance from BD (G = 4.9 ± 0.1 nS) equals the MD conductance (G = 4.9 ± 0.1 nS; the value after ± corresponds to the standard error throughout this work). The higher diffusion in the BD and MD simulations is responsible for the resultant higher conductance compared with the experimental value of 3.9–4.5 nS for various VDACs (28). Table S1 summarizes the current ratios from both the BD and MD simulations. The current ratios from BD remain almost constant regardless of Vmp and agree with the MD results of the positive Vmp region. The average current ratio from BD is 1.7 ± 0.1, which indicates the anion preference of the channel. The discrepancy between the current ratios from BD and MD—more specifically, the much higher ratios in MD on the negative Vmp side—is mostly due to the limited number of K+ crossing in the MD simulations (19).
Figure 2.

I/V curves of K+ (magenta), Cl− (green), and total (black) currents from the BD (solid) and MD (dotted) simulations of NMR01 in a symmetric 1.0 M KCl solution. Standard errors are also shown for the BD results.
Table 1 summarizes the average number of K+ and Cl− in the pore region (−15 Å ≤ Z ≤ 15 Å) at equilibrium (Vmp = 0 mV) and nonequilibrium (Vmp = 50 mV) conditions. Regardless of Vmp, a higher number of Cl− than K+ is found in the pore, which also indicates the anion preference of the channel. The minimal effects of Vmp on the ion distribution are observed inside the pore because the protein-ion interactions are the main determinant for the distribution. Similar results were obtained in the MD simulations under the same conditions, but with slightly elevated numbers for both K+ and Cl− in the pore. The ion number profiles along the Z axis (Fig. S2) clearly show that the difference between the pore ion numbers in BD and MD (Table 1) arises mostly from the different number of K+ at the center. In the MD simulations, trapping of K+ (due to less screened interactions between K+ and acidic residues) at the center of the channel was observed (19). The trapped K+ ions attract nearby Cl−, consequently resulting in the slightly higher number of both ions inside the pore in the MD simulations. Although such detailed protein-ion interactions are approximated by implicit solvent-based protein-ion interactions (Eq. 2), the superposition of the ion trajectories from BD is similar to that from the MD simulations, as shown in Fig. S3. Accumulated K+ ions are found close to several charged or polar residues, including Asp-16, Asp-30, Glu-84, and Asn-207. Mutations of several corresponding residues, such as Asp-16 to Lys, and Asp-30 to Lys, in Saccharomyces cerevisiae yeast VDAC (scVDAC) increase the anion selectivity of the channel (29) (see also the mutation study below).
Table 1.
Average number of ions in the pore (−15 Å ≤ Z ≤ 15 Å)
| Equilibrium (Vmp = 0 mV) |
Nonequilibrium (Vmp = 50 mV) |
|||||
|---|---|---|---|---|---|---|
| NK | NCl | NCl/NK | NK | NCl | NCl/NK | |
| BD | 4.5 ± 0.1 | 6.3 ± 0.2 | 1.4 ± 0.1 | 4.4 ± 0.1 | 6.1 ± 0.3 | 1.4 ± 0.1 |
| MD∗ | 5.4 ± 0.5 | 7.5 ± 0.6 | 1.4 ± 0.3 | 5.8 ± 0.2 | 7.6 ± 0.9 | 1.2 ± 0.2 |
Average of three independent hVDAC1 systems (19).
We also performed the BD simulations with explicit lipid molecules taken from a snapshot in the MD simulations (19). The differences in the conductance and number of ions between implicit and explicit membranes are very small (data not shown), indicating that the use of a simple implicit membrane is a reasonable approximation in the BD simulation. Given the aforementioned approximations in BD, this comparison clearly illustrates that the hierarchical approach in BD captures the essential interactions that govern ion transport through hVDAC1, and reproduces the MD results within the limitation of such approximations. Similar observations in terms of the efficacy of the hierarchical BD simulation were reported in previous MD and BD simulation studies of α-Hemolysin (18,30) and α-Hemolysin with a molecular adaptor (20,31).
Ion transport properties of hVDAC1 NMR models
Given the current debate on the validity of the reported hVDAC1 structures (7), it is necessary to thoroughly investigate the structure-channel property relationship of each NMR structure and the structure ensemble by calculating the ion transport properties under physiologically relevant conditions. To compare the BD results directly with available experimental data, we used the same diffusion constant profile (Fig. S1) with the experimental ion diffusion constants for the bulk region (see Materials and Methods).
Table S2 summarizes the single-channel conductance of each hVDAC1 NMR model in 0.1 M KCl solution with Vmp = 50 mV and its permeability ratio (p) in an asymmetric 1.0:0.1 M KCl solution. Fig. 3 shows a typical I/V curve in the asymmetric solution, and p is calculated using Eq. 3 by determining the reversal potential from the I/V curve. The experimental conductance and permeability ratio in corresponding conditions are 0.4–0.6 nS and ∼2.0 (4). From the experimental values, a selection window of conductance and permeability ratio (0.4 nS < G < 0.6 nS and 1.5 < p < 2.5) was chosen to assess the ion transport properties of the NMR structures. As shown in Fig. 4, all NMR structures except NMR02 have permeability ratios > 1.0, indicating anion selectivity of the structures. However, only three NMR models (NMR01, NMR03, and NMR20) yield a conductance and permeability ratio that is not significantly different from the experimentally measured range (considering a 95% confidence interval), and NMR03 best satisfies both selection criteria. No model yields both low conductance and cation selectivity resembling the closed state (4), demonstrating that the NMR structures represent open-state channel structures.
Figure 3.
I/V curves of K+ (magenta), Cl− (green), and total (black) currents from the BD simulations of NMR03 in an asymmetric 1.0 (cis): 0.1 (trans) M KCl solution. A linearly fitted line (black dashed) is used to determine the average reversal potential where the total current is zero.
Figure 4.

Single-channel conductance (black circle) at Vmp = 50 mV in symmetric 0.1 M KCl solution, and permeability ratio (red square) in an asymmetric 1.0:0.1 M KCl solution of the 20 hVDAC1 NMR models from the BD simulations. Error bars represent the 95% confidence interval assuming a t distribution of the samples. In the selection window (blue shaded) taken from the experimental measurements, the ion conductance ranges from 0.4 nS to 0.6 nS, and the permeability ratio ranges from 1.5 to 2.5. The permeability ratios of NMR09, NMR14, NMR15, NMR17, and NMR19 are not shown, because their values (5.55 < p < 7.82) are too large for the current scale. The conductance and permeability ratio values (with standard error) are listed in Table S2.
Assuming an equal probability of observing each NMR model, we calculated the distributions of the single-channel conductance and the reversal potentials from the 10 independent simulation runs for all of the structures, and the results are shown in Fig. 5. The reversal potential distribution is determined by linear interpolation of the I/V curves for each structure. The ensemble-averaged conductance is 0.36 ± 0.04 nS, which is not significantly below the lower bound of the conductance selection window considering a 95% confidence interval (0.30 nS < G < 0.43 nS; Table S2). Also, compared to the channel conductance (1.06 nS) from the previous PNP calculation (14), the BD simulations clearly yield a much more reasonable single-channel conductance that is comparable to the range of experimental measurement, demonstrating the importance of including the finite ion size and the direct ion-ion interactions in the pore (15). The average reversal potential is 23.7 ± 2.2 mV (corresponding to p = 3.2), which is higher than the upper bound in the selection criteria of 18.95 mV (p = 2.5). The ensemble properties based on the uniform distribution of the NMR models show good agreement with experimental conductance, whereas the anion selectivity is a bit higher than the experimental data. This observation supports the conclusion that the NMR models represent the anion-selective, open-state hVDAC1 structures.
Figure 5.

Normalized distribution of (A) single-channel conductance and (B) reversal potential for the 20 hVDAC1 NMR models. The conductance distribution profile is obtained from 10 conductance data points, and the reversal potential distribution profile is obtained from 100 reversal potential data points (100 combinations resulted from connecting two bias points near the reversal potential) of each NMR model. The ensemble average of single-channel conductance is 0.36 ± 0.04 nS, and that of the reversal potential is 23.7 ± 2.2 mV. The shaded area corresponds to the selection window for conductance (0.4 nS < G < 0.6 nS) and permeability ratio (1.5 < p < 2.5) as shown in Fig. 4. The solid squares in the plot correspond to the ensemble average, and open circles indicate the results from NMR03.
Structure and ion transport properties for selected structures
Ultimately, one must calculate the channel property as an ensemble property that arises from an ensemble of channel structures. However, since most BD or PNP studies are based on a single, rigid representative structure, it is instructive to investigate the structure-channel property relationship with a few selected NMR structures. For this purpose, three NMR models (NMR02, NMR03, and NMR11) were chosen because they have similar conductance but different permeability ratios. Table 2 summarizes their ion transport properties, including conductance, number of ions in the pore (−15 Å ≤ Z ≤ 15 Å), and permeability ratio. Both the conductance ratio and the permeability ratio show an increasing trend of anion selectivity in the order of NMR02, NMR03, and NMR11. Of interest, variations of the K+ number in the pore and the K+ conductance among the three models are large, whereas those of Cl− are small. Thus, one can envision that the permeation process of K+ would differ among the models, and the structural differences would obviously affect the K+ permeation process, resulting in different ion selectivity, whereas the Cl− permeation process would remain similar.
Table 2.
Ion transport properties of the selected hVDAC1 NMR models
| Model | Gtotal∗ | GK | GCl | GCl/GK | NK† | NCl | NCl/NK | p‡ |
|---|---|---|---|---|---|---|---|---|
| NMR02 | 0.51 | 0.18 | 0.33 | 1.8 ± 0.2 | 0.58 | 2.03 | 3.5 ± 0.3 | 1.00 |
| NMR03 | 0.53 | 0.11 | 0.42 | 3.8 ± 0.2 | 0.41 | 2.00 | 4.9 ± 0.4 | 1.77 |
| NMR11 | 0.41 | 0.04 | 0.37 | 9.3 ± 0.6 | 0.23 | 2.42 | 10.5 ± 1.1 | 3.95 |
Conductance (in nS) calculated in 0.1 M KCl solution.
Average number of ions in the pore region (−15 Å ≤ Z ≤ 15 Å) calculated in 0.1 M KCl solution.
Permeability ratio calculated from the reversal potential in 1.0:0.1 M KCl solution.
To characterize the microscopic origin of the anion selectivity difference in these models, we calculated the one-dimensional (1D) multi-ion PMFs (32) for K+ and Cl− along the Z axis from the average equilibrium ion density profile (Cα):
| (4) |
where α is the ion type and Cref is the arbitrary reference concentration that is set to the bulk concentration to make as . represents the mean potential acting on an ion along the channel axis, including the contributions from protein-ion, ion-ion, and ion-solvent interactions, and the volume exclusion effect (i.e., the variation in the ion-accessible cross-sectional area).
Fig. 6 shows the 1D multi-ion PMFs of the three NMR models with and without protein charges. The PMFs without protein charges include the volume exclusion effect and the reaction field from the membrane-solvent dielectric boundary, and thus serve as the reference PMFs to consider the influence of protein-ion interactions. The volume exclusion effect causes the barriers in all PMF profiles near the pore entrance (Z ∼ ±20 Å). Clearly, the protein charges are the characteristic determinants of the PMFs inside the pore. The Cl− PMFs have lower barriers than the reference PMFs, and the barriers of the K+ PMFs are higher, which explains why the Cl− currents in the BD simulations are larger than the K+ currents (Table 2). The similar Cl− currents in the three models are also dictated by similar, rather flat (∼1.0 kcal/mol) PMFs inside the pore. The slight differences in the Cl− currents are determined by the PMF barriers in 10 Å ≤ Z ≤ 20 Å, i.e., the order in the Cl− currents (NMR03 > NMR11 > NMR02 in Table 2) is inversely proportional to the barrier heights (NMR02 > NMR11 > NMR03 in Fig. 6). Compared to the Cl− PMF, the variation of the K+ PMFs in the pore among the selected models is significant. Clearly, the lowest K+ current in NMR11 results from the two large PMF barriers, which are higher than those in NMR02 and NMR03.
Figure 6.
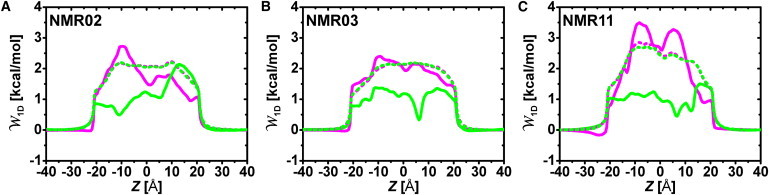
1D multi-ion PMF for K+ (magenta) and Cl− (green) calculated from the BD simulations of (A) NMR02, (B) NMR03, and (C) NMR11 in 0.1 M KCl solution under the equilibrium condition (Vmp = 0 mV). To show the contribution of the protein charge, the PMFs without the protein charge are also drawn as dotted lines.
A discussion about the relationship between the PMFs and the protein structure, including the position and orientation of the protein residues, can provide detailed insight into the structure-channel property relationship. Of the three models, NMR11 has the smallest ion-accessible area profile, whereas NMR02 and NMR03 have similar area profiles (Fig. S4 A). Hence, one would expect NMR11 to conduct a smaller ionic current because it has the narrowest pore, and the electrostatic effect from protein residues (especially the charged residues) would be amplified in NMR11 due to crowding of the charged residues. This notion is illustrated in Fig. 6, which shows that the reference PMF of NMR11 has a larger barrier than the other models, and the PMF change considering the protein charge effect is the largest in NMR11. The effect of the smaller pore in NMR11 is also clearly captured at the PMF peaks at Z = −8 Å, where pore-facing Lys-61 and Lys-96 are positioned to strongly hinder the K+ permeation and attract Cl−. The electrostatic effect from these residues is stronger in NMR11 than in NMR02 and NMR03, as the Z position corresponds to the narrowest pore by the N-terminus (see Fig. S4 B for the cross-sectional average ion density in the same Z position).
In addition, the K+ PMF barrier in NMR11 is enhanced because Glu-84 (near Z = 0 Å) is buried in the lipid region (Fig. S4 B), which reduces the attraction of K+ into the pore, whereas the side chain of Glu-84 in NMR02 points directly into the pore (Fig. S4 C). The side chain of Glu-84 in NMR03 is located inside the channel but its orientation is parallel with the pore wall. Hence, the order of local K+ PMF minima near Z = 0 Å (NMR02 < NMR03 < NMR11) can be attributed to the relative orientation of Glu-84. Among the charged residues in the N-terminal region, Arg-15 exemplifies the effect of the different orientation of the residue on the ion permeation. As shown in Fig. S4 D, the side chain of Arg-15 in NMR03 and NMR11 is located at the XY center of the pore and faces the pore, which results in the deep Cl− PMF well near Z = 8 Å. In contrast, the wall-facing Arg-15 in NMR02 results in weaker attraction of Cl− at this position. Consequently, higher densities of Cl− are observed near Arg-15 in NMR03 and NMR11, but not in NMR02. Asp-16 is also found to strongly affect the K+ PMF barrier, which causes a decrease of the K+ PMF from the reference PMF near the trans-side (Z > 0) pore entrance for NMR02 and NMR03. Localized K+ trajectories are observed between Asp-16 and the cluster of the Asn residues (Asn-168, Asn-183, Asn-185, and Asn-207) in NMR02 and NMR03. However, in NMR11, the N-terminal region is positioned between Asp-16 and the Asn cluster to interrupt the K+ attraction site and cause the reduction of the K+ permeation.
The results of these detailed analyses show that one can explain the microscopic origins of the different ion selectivities among the models by examining the PMF, ion trajectories, and structural information. Specifically, the conformation of the flexible N-terminal region and orientation of its charged residues play important roles in determining the overall conduction properties of the NMR models.
Mutation effects on ion transport properties
Mutation studies have been used to characterize the role of specific residues in ion transport properties. The ability to reproduce or predict mutation effects from computational studies is important because such studies can explain specific mutation-induced changes on a microscopic level. We selected seven mutation sites from the experimental measurements of yeast scVDAC (29,33): D15K, K19E, D30K, K61E, K95E, E220K, and K274E. Previous experimental functional studies indicated a structural similarity between scVDAC and hVDAC1 (34). The corresponding residues in hVDAC1 are D16K, K20E, D30K, K61E, K96E, G220K, and K274E. The five mutations of D15K, K19E, D30K, K61E, and K95E in scVDAC were found to notably affect the ion selectivity, whereas those of E220K and K274E resulted in negligible selectivity changes (29,33). The positions of the mutation sites are depicted in Fig. 7, A and B.
Figure 7.

(A) Top view (from Z < 0) and (B) side view of NMR03 with the selected mutation sites of Asp-16, Lys-20, Asp-30, Lys-61, Lys-96, Gly-220, and Lys-274. (C) Comparison of permeability ratio changes of the selected mutants between the BD simulation and experimental data. The permeability ratio change (Rp) is defined as pmutant/pWT.
Because NMR03 shows the best agreement with the experimental conductance and reversal potential, we used NMR03 as a template wild-type (WT) structure for the aforementioned mutants. Table 3 summarizes the reversal potentials (Vrev) calculated from the BD simulations and compares them with the experimental data from scVDAC (33). Given the assumption that each mutation does not induce a significant structural change from NMR03, the BD simulation reproduces the experiment reasonably well except for D16K and K274E (see also Fig. 7 C, which compares the permeability ratio change (Rp = pmutation/pWT) between the BD simulations and the experimental data).
Table 3.
Reversal potentials (in mV) of WT VDACs and their mutants
| BD∗: hVDAC1 |
Experiment∗ (29): scVDAC |
||
|---|---|---|---|
| WT | 12.0 ± 2.1 | WT | 10.2 ± 0.2 |
| D16K | 26.2 ± 1.3 (+14.2) | D15K | 15.7 ± 1.1 (+5.5) |
| D30K | 16.8 ± 0.8 (+4.8) | D30K | 14.6 ± 0.3 (+4.4) |
| K20E | 2.0 ± 2.4 (−10.0) | K19E | −2.1 ± 0.3 (−12.3) |
| K61E | 1.9 ± 2.4 (−10.1) | K61E | 1.8 ± 0.5 (−8.4) |
| K96E | 8.2 ± 2.6 (−3.8) | K95E | 3.0 ± 1.0 (−7.2) |
| G220K | 14.9 ± 0.9 (+2.9) | E220K | 10.9 ± 0.1 (+0.7) |
| K274E | −1.9 ± 2.0 (−13.9) | K274E | 10.1 ± 0.5 (−0.1) |
The reversal potential shift from WT is given in parentheses.
The changes in Vrev are correlated with those in the 1D multi-ion PMF barriers (Fig. S5). The mutations' impact on the PMF is highly dependent on the residue position. Mutations near the pore entrance are likely to result in a local change of the PMF. For example, the K20E mutation is located near the pore entrance on the trans side, and it has only a slight impact on the Cl− PMF near its location (10 Å ≤ Z ≤ 20 Å). On the other hand, mutations that occur inside the channel pore affect the overall K+ and Cl− PMFs. This is illustrated by the K61E mutation on the channel wall inside the pore, which perturbs both the K+ and Cl− PMFs over a wide range along the Z axis. Even though these mutations affect the ion PMFs differently, they result in similar shifts in Vrev.
A large discrepancy between the BD simulation and the experiment is found for D16K and K274E (Fig. 7 C and Table 3). In the case of D16K, whereas Vrev changes by 5.5 mV in the experiment, a larger increase by 14.2 mV is observed in the BD simulation. This is because Asp-16 is located in the flexible N-terminal helix, and its mutation to Lys would result in a different conformation and movement of the helix, which is not considered in the current BD simulation of the mutant. The K274E mutation also shows a negligible Vrev change in the experiment, but its BD simulation yields the largest decrease (cation selectivity). This arises from the perturbation of the Cl− PMF by the K274E mutation on β-strand 19 at the trans-side pore entrance; the mutation inverts the deep potential well in the WT to a large barrier near Z = 7.5 Å (Fig. S5 D). This considerable alteration in both the PMF and the reversal potential is again attributed to the rigid-body assumption in BD. In the hVDAC1 structure, the side chain of Lys-274 is toward the channel lumen. Consequently, mutating Lys-274 to Glu affects the electrostatic potential inside the pore and causes a significant shift in Vrev. Considering the location of Lys-274 close to the pore entrance and the flexibility of the native VDAC structure, the side chain of Glu-274 from the mutation can be positioned outside of the pore. Therefore, the K274E mutation may have little effect on Vrev in experimental mutagenesis studies of scVDAC (7,34).
In general, the BD simulations reproduced the experimental ion selectivity change from single-point mutations reasonably well. The discrepancies observed for the D16K and K274E mutations are likely due to possible conformation changes, structural differences of mutated residues (between in hVDAC1 and in scVDAC), and the limitation of the fixed-structure approximation in the BD approach.
Conclusions
The results of our GCMC/BD simulation study provide several novel (to our knowledge) insights into the relationship between the hVDAC1 structure and ion transport. The single-channel conductance and permeability ratio calculations demonstrate that the 20 NMR structures of hVDAC1 (PDB:2K4T) conduct ions and are anion-selective (Fig. 4). Assuming equal probability in calculating the ensemble properties of the structures, the BD simulations yield a similar single-channel conductance and slightly higher permeability ratio compared with the experimental data (Fig. 5). Of note, the NMR03 model best reproduced both the experimental conductance and the ion selectivity, suggesting that it may represent the representative open-state hVDAC1 structure. This notion is further corroborated by the BD simulation study of various mutants based on the NMR03 model, which showed overall good agreement with the experimental data in the change of the reversal potential due to various single-point mutations (Table 3 and Fig. 7).
In the context of computational biophysics, our BD simulation study also confirms the importance of the hierarchical approach for closely reproducing key microscopic properties of ion transport, such as ion diffusion constants and ion-ion interactions that are observed in MD simulation. Remarkably, despite its intrinsic limitations, such as a rigid channel, implicit solvent-based protein-ion interactions, and use of an implicit membrane bilayer, the BD simulation shows overall excellent agreement with the all-atom MD simulation in terms of the I/V curves (Fig. 2), the current ratio (Table S1), and the ion number profiles (Table 1 and Fig. S2). Finally, this study shows that the 1D multi-ion PMF calculation can be used to elucidate variations in channel conductance and ion selectivity due to structural differences in the NMR models (Table 2, Fig. 6, and Fig. S4) or mutations (Table 3 and Fig. S5).
Acknowledgments
We thank Bernhard Egwolf for many helpful discussions about the GCMC/BD simulation.
This work was supported in part by institutional funding from the University of Kansas, the J. R. and Inez Jay Fund, the National Institutes of Health (R01-GM092950), the National Science Foundation (NSF OCI-0503992) through TeraGrid resources provided by Purdue University (to W.I.), and the Intramural Research Program of the National Heart, Lung, and Blood Institute (to R.W.P.). K.I.L. was supported by a Korea Research Foundation Grant funded by the Korean Government (KRF-2006-352-D00132).
Supporting Material
References
- 1.Schein S.J., Colombini M., Finkelstein A. Reconstitution in planar lipid bilayers of a voltage-dependent anion-selective channel obtained from paramecium mitochondria. J. Membr. Biol. 1976;30:99–120. doi: 10.1007/BF01869662. [DOI] [PubMed] [Google Scholar]
- 2.Shimizu S., Narita M., Tsujimoto Y. Bcl-2 family proteins regulate the release of apoptogenic cytochrome c by the mitochondrial channel VDAC. Nature. 1999;399:483–487. doi: 10.1038/20959. [DOI] [PubMed] [Google Scholar]
- 3.Simamura E., Hirai K.I., Shimizu S. Furanonaphthoquinones cause apoptosis of cancer cells by inducing the production of reactive oxygen species by the mitochondrial voltage-dependent anion channel. Cancer Biol. Ther. 2006;5:1523–1529. doi: 10.4161/cbt.5.11.3302. [DOI] [PubMed] [Google Scholar]
- 4.Colombini M. Voltage gating in the mitochondrial channel, VDAC. J. Membr. Biol. 1989;111:103–111. doi: 10.1007/BF01871775. [DOI] [PubMed] [Google Scholar]
- 5.Komarov A.G., Graham B.H., Colombini M. The physiological properties of a novel family of VDAC-like proteins from Drosophila melanogaster. Biophys. J. 2004;86:152–162. doi: 10.1016/S0006-3495(04)74093-X. [DOI] [PMC free article] [PubMed] [Google Scholar]
- 6.Hiller S., Garces R.G., Wagner G. Solution structure of the integral human membrane protein VDAC-1 in detergent micelles. Science. 2008;321:1206–1210. doi: 10.1126/science.1161302. [DOI] [PMC free article] [PubMed] [Google Scholar]
- 7.Colombini M. The published 3D structure of the VDAC channel: native or not? Trends Biochem. Sci. 2009;34:382–389. doi: 10.1016/j.tibs.2009.05.001. [DOI] [PubMed] [Google Scholar]
- 8.Bayrhuber M., Meins T., Zeth K. Structure of the human voltage-dependent anion channel. Proc. Natl. Acad. Sci. USA. 2008;105:15370–15375. doi: 10.1073/pnas.0808115105. [DOI] [PMC free article] [PubMed] [Google Scholar]
- 9.Hiller S., Abramson J., Zeth K. The 3D structures of VDAC represent a native conformation. Trends Biochem. Sci. 2010;35:514–521. doi: 10.1016/j.tibs.2010.03.005. [DOI] [PMC free article] [PubMed] [Google Scholar]
- 10.Kuyucak S., Andersen O.S., Chung S.H. Models of permeation in ion channels. Rep. Prog. Phys. 2001;64:1427–1472. [Google Scholar]
- 11.Roux B., Allen T., Im W. Theoretical and computational models of biological ion channels. Q. Rev. Biophys. 2004;37:15–103. doi: 10.1017/s0033583504003968. [DOI] [PubMed] [Google Scholar]
- 12.Chung S.H., Corry B. Three computational methods for studying permeation, selectivity and dynamics in biological ion channels. Soft Matter. 2005;1:417–427. doi: 10.1039/b512455g. [DOI] [PubMed] [Google Scholar]
- 13.Ujwal R., Cascio D., Abramson J. The crystal structure of mouse VDAC1 at 2.3 A resolution reveals mechanistic insights into metabolite gating. Proc. Natl. Acad. Sci. USA. 2008;105:17742–17747. doi: 10.1073/pnas.0809634105. [DOI] [PMC free article] [PubMed] [Google Scholar]
- 14.Choudhary O.P., Ujwal R., Grabe M. The electrostatics of VDAC: implications for selectivity and gating. J. Mol. Biol. 2010;396:580–592. doi: 10.1016/j.jmb.2009.12.006. [DOI] [PMC free article] [PubMed] [Google Scholar]
- 15.Im W., Roux B. Ion permeation and selectivity of OmpF porin: a theoretical study based on molecular dynamics, Brownian dynamics, and continuum electrodiffusion theory. J. Mol. Biol. 2002;322:851–869. doi: 10.1016/s0022-2836(02)00778-7. [DOI] [PubMed] [Google Scholar]
- 16.Im W., Seefeld S., Roux B. A grand canonical Monte Carlo-Brownian dynamics algorithm for simulating ion channels. Biophys. J. 2000;79:788–801. doi: 10.1016/S0006-3495(00)76336-3. [DOI] [PMC free article] [PubMed] [Google Scholar]
- 17.Im W., Roux B. Brownian dynamics simulations of ions channels: a general treatment of electrostatic reaction fields for molecular pores of arbitrary geometry. J. Chem. Phys. 2001;115:4850–4861. [Google Scholar]
- 18.Noskov S.Y., Im W., Roux B. Ion permeation through the α-hemolysin channel: theoretical studies based on Brownian dynamics and Poisson-Nernst-Plank electrodiffusion theory. Biophys. J. 2004;87:2299–2309. doi: 10.1529/biophysj.104.044008. [DOI] [PMC free article] [PubMed] [Google Scholar]
- 19.Rui H., Lee K.I., Im W. Molecular dynamics studies of ion permeation in voltage dependent anion channels. Biophys. J. 2010;100:602–610. doi: 10.1016/j.bpj.2010.12.3711. [DOI] [PMC free article] [PubMed] [Google Scholar]
- 20.Egwolf B., Luo Y., Roux B. Ion selectivity of α-hemolysin with β-cyclodextrin adapter. II. Multi-ion effects studied with grand canonical Monte Carlo/Brownian dynamics simulations. J. Phys. Chem. B. 2010;114:2901–2909. doi: 10.1021/jp906791b. [DOI] [PMC free article] [PubMed] [Google Scholar]
- 21.Chung S.H., Allen T.W., Kuyucak S. Conducting-state properties of the KcsA potassium channel from molecular and Brownian dynamics simulations. Biophys. J. 2002;82:628–645. doi: 10.1016/S0006-3495(02)75427-1. [DOI] [PMC free article] [PubMed] [Google Scholar]
- 22.Smolyanitsky A., Aboud S., Saraniti M. Brownian dynamics study of the effects of dielectric constant on conductivity of porins. J. Comput. Theor. Nanos. 2010;7:2543–2546. [Google Scholar]
- 23.Ermak D.L., McCammon J.A. Brownian dynamics with hydrodynamic interactions. J. Chem. Phys. 1978;69:1352–1360. [Google Scholar]
- 24.van der Straaten T.A., Kathawala G., Ravaioli U. BioMOCA—a Boltzmann transport Monte Carlo model for ion channel simulation. Mol. Simul. 2005;31:151–171. [Google Scholar]
- 25.Darden T., York D., Pedersen L. Particle mesh Ewald—an N.Log(N) method for Ewald sums in large systems. J. Chem. Phys. 1993;98:10089–10092. [Google Scholar]
- 26.Venable R.M., Hatcher E., Pastor R.W. Comparing simulated and experimental translation and rotation constants: range of validity for viscosity scaling. J. Phys. Chem. B. 2010;114:12501–12507. doi: 10.1021/jp105549s. [DOI] [PMC free article] [PubMed] [Google Scholar]
- 27.Hodgkin A.L., Huxley A.F., Katz B. Ionic currents underlying activity in the giant axon of the squid. Arch. Sci. Physiol. (Paris) 1949;3:129–150. [Google Scholar]
- 28.Roos N., Benz R., Brdiczka D. Identification and characterization of the pore-forming protein in the outer membrane of rat liver mitochondria. Biochim. Biophys. Acta. 1982;686:204–214. doi: 10.1016/0005-2736(82)90114-6. [DOI] [PubMed] [Google Scholar]
- 29.Blachly-Dyson E., Peng S.Z., Forte M. Selectivity changes in site-directed mutants of the VDAC ion channel: structural implications. Science. 1990;247:1233–1236. doi: 10.1126/science.1690454. [DOI] [PubMed] [Google Scholar]
- 30.Aksimentiev A., Schulten K. Imaging α-hemolysin with molecular dynamics: ionic conductance, osmotic permeability, and the electrostatic potential map. Biophys. J. 2005;88:3745–3761. doi: 10.1529/biophysj.104.058727. [DOI] [PMC free article] [PubMed] [Google Scholar]
- 31.Luo Y., Egwolf B., Roux B. Ion selectivity of α-hemolysin with a β-cyclodextrin adapter. I. Single ion potential of mean force and diffusion coefficient. J. Phys. Chem. B. 2010;114:952–958. doi: 10.1021/jp906790f. [DOI] [PMC free article] [PubMed] [Google Scholar]
- 32.Kirkwood J.G. Statistical mechanics of fluid mixtures. J. Chem. Phys. 1935;3:300–313. [Google Scholar]
- 33.Peng S., Blachly-Dyson E., Colombini M. Large scale rearrangement of protein domains is associated with voltage gating of the VDAC channel. Biophys. J. 1992;62:123–131. doi: 10.1016/S0006-3495(92)81799-X. discussion 131–135. [DOI] [PMC free article] [PubMed] [Google Scholar]
- 34.Colombini M. VDAC: the channel at the interface between mitochondria and the cytosol. Mol. Cell. Biochem. 2004;256-257:107–115. doi: 10.1023/b:mcbi.0000009862.17396.8d. [DOI] [PubMed] [Google Scholar]
Associated Data
This section collects any data citations, data availability statements, or supplementary materials included in this article.