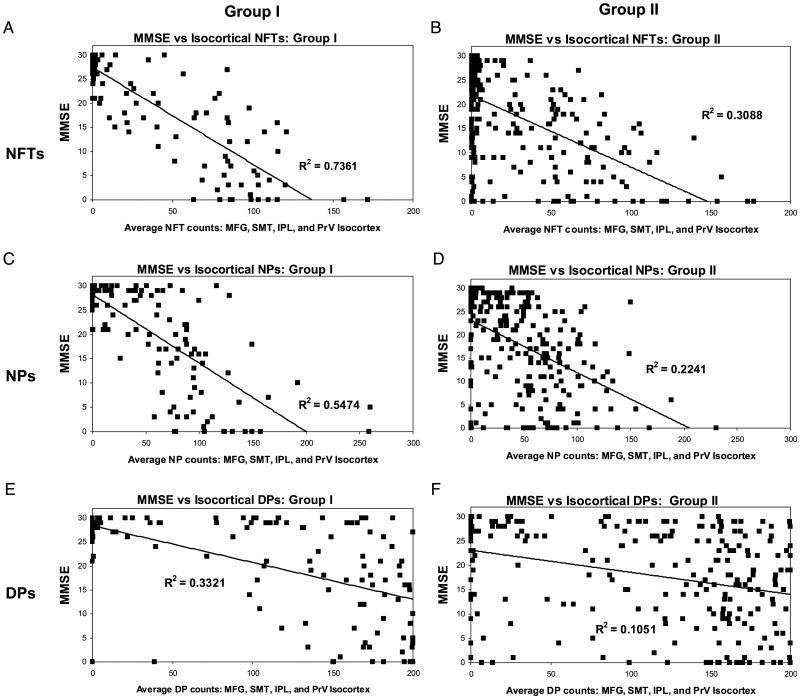
FIGURE 4.
Correlating histopathologic lesions of Alzheimer disease (AD) with premortem cognitive decline as quantified with the Mini-Mental State Examination (MMSE). (A, B) Results for neurofibrillary tangles (NFTs), (C, D) results for neuritic amyloid plaques (NPs), and (E, F) results for diffuse plaques (DPs) in Group I (A, C, E) and Group II (with Lewy bodies, argyrophilic grains, infarct[s], hippocampal sclerosis, and/or frontotemporal dementia) (B, D, F). Note that the correlation coefficients are consistently higher for Group I versus Group II, and for both groups the correlation coefficients are NFTs > NPs > DPs. There are a few Group I patients with dementia who lack NFTs and NPs. SMT, superior and middle temporal gyri; MFG, middle frontal gyrus; IPL, inferior parietal lobule; PrV, primary visual cortex.

